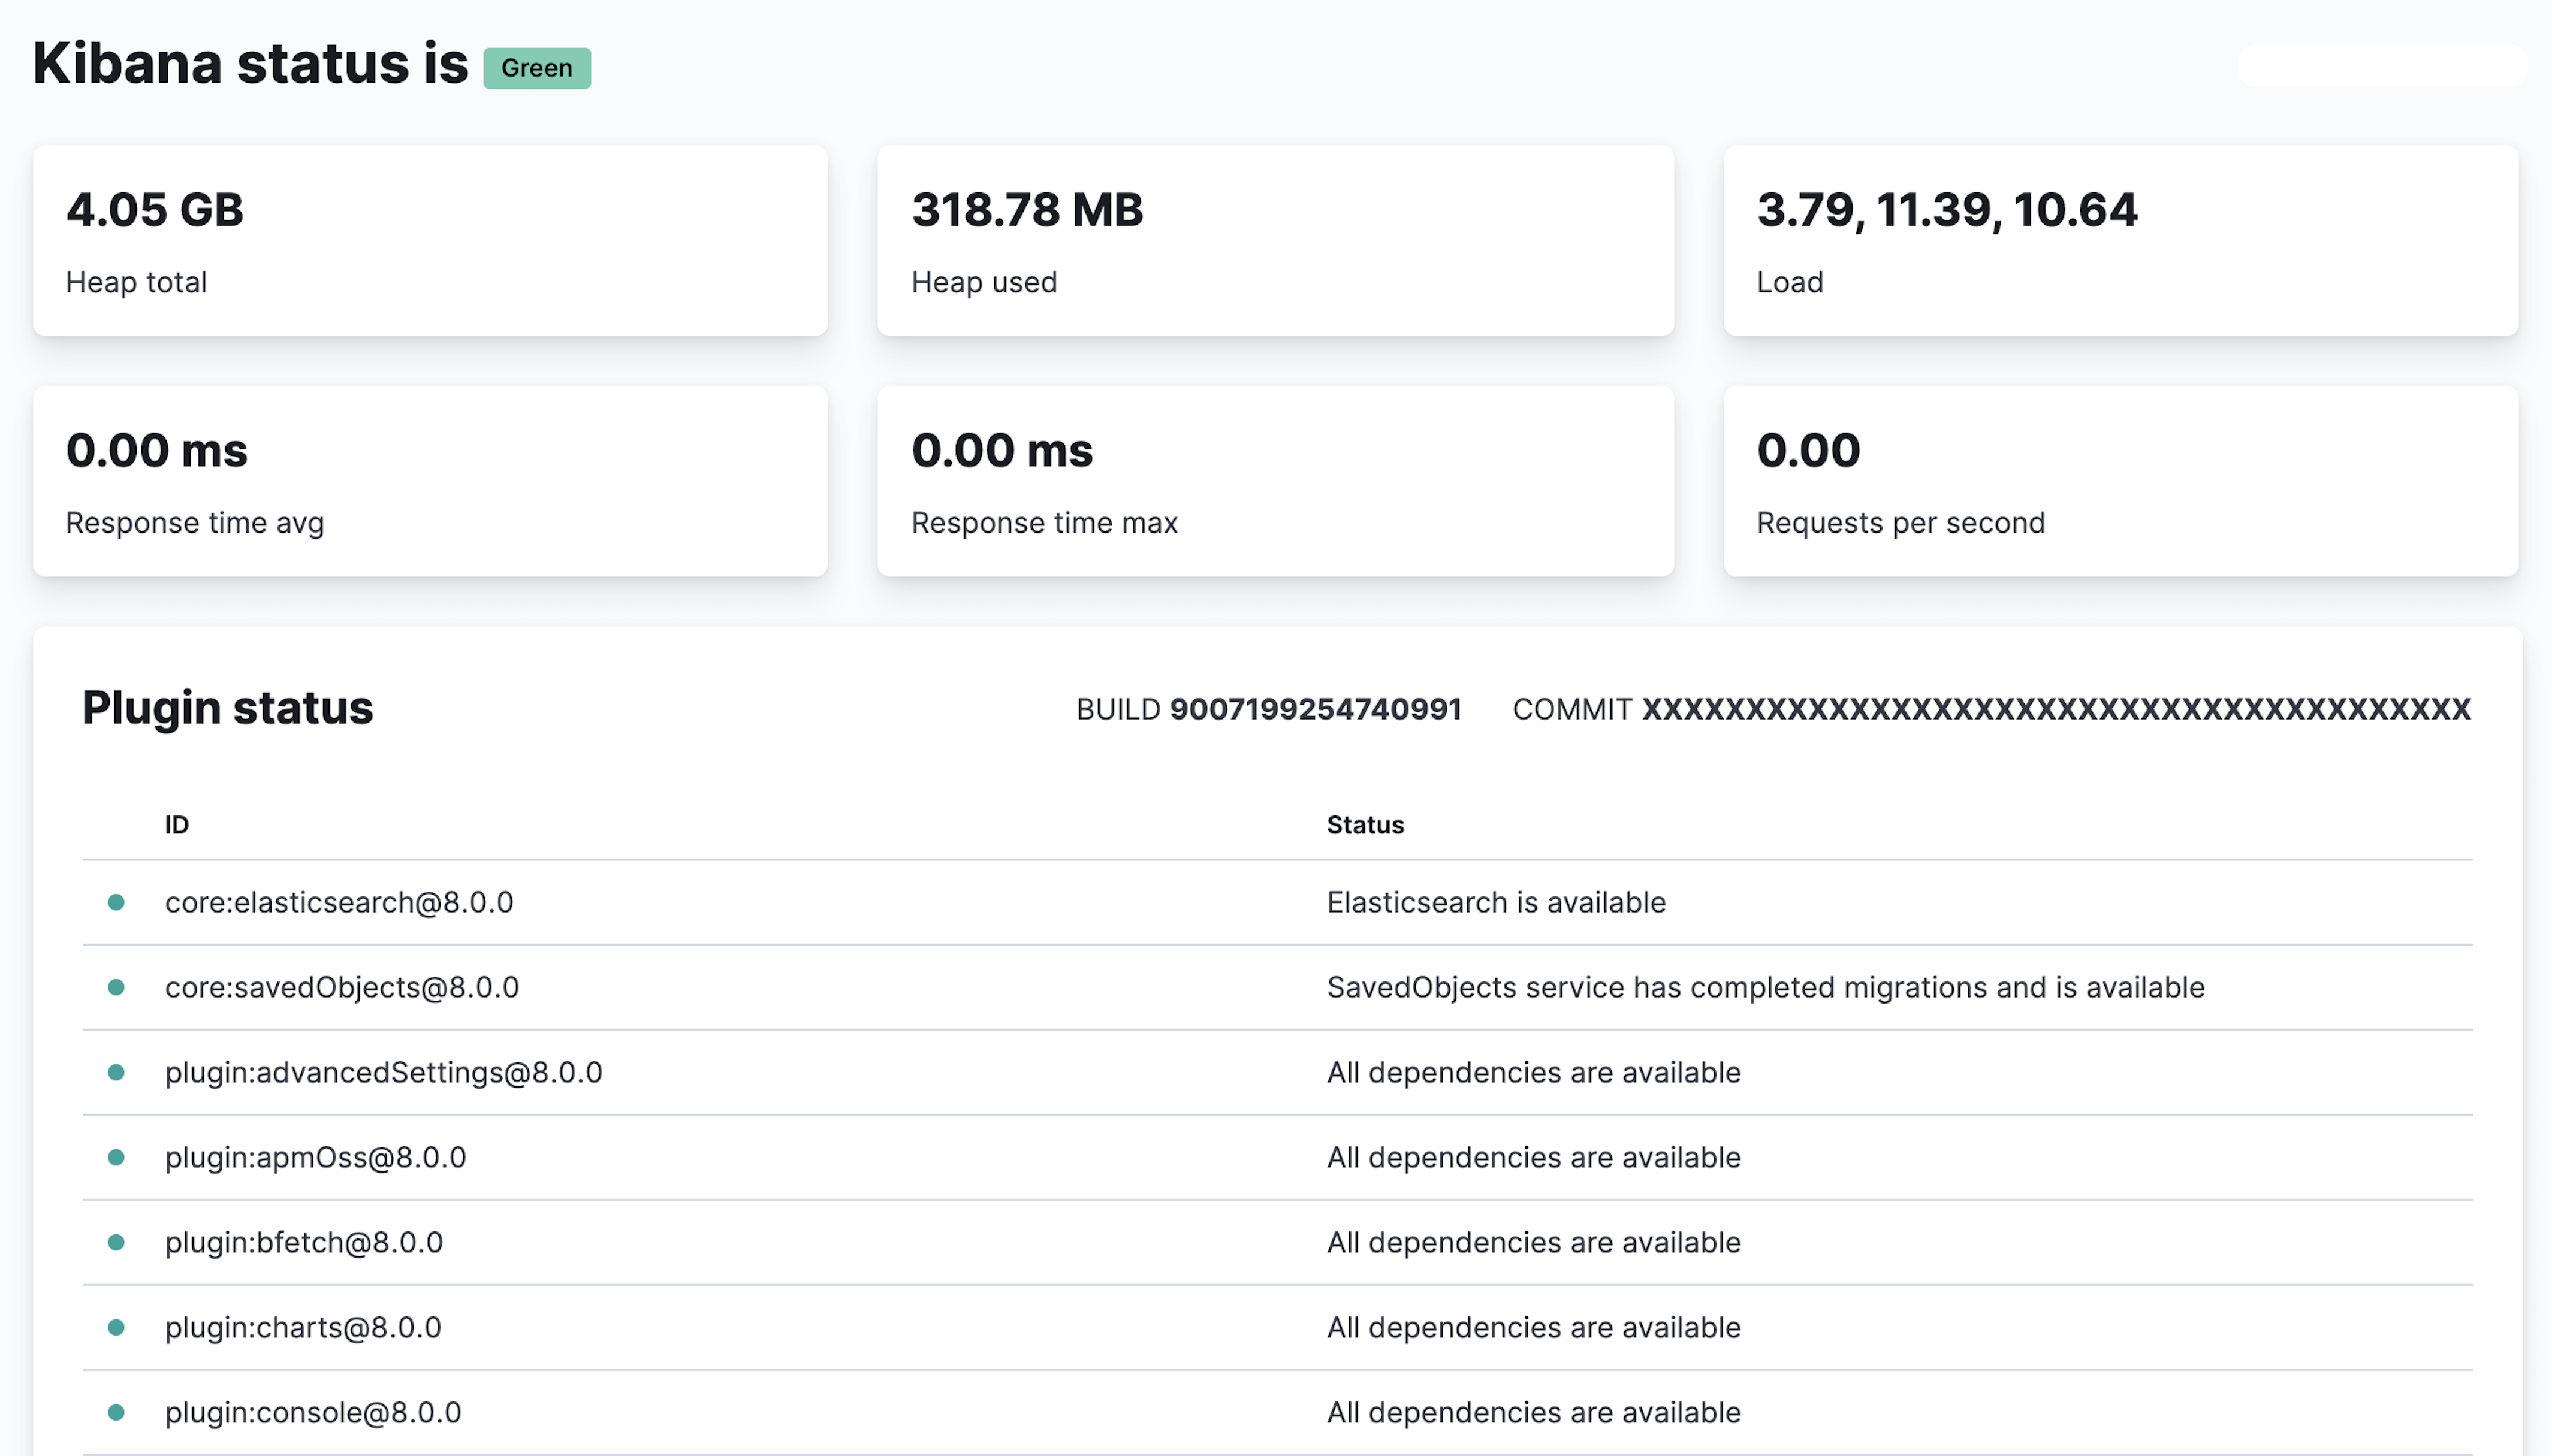
Check Kibana server status
The status page displays information about the server resource usage and installed plugins. It only reports for the individual responding Kibana instance.
To view Kibana's status, use the status endpoint. For example, localhost:5601/status.

For JSON-formatted server status details, use the Kibana current status API. For example, localhost:5601/api/status.
The following steps demonstrate a typical investigative flow. It assumes the Kibana current status API is saved locally as kibana_status.json, and uses third-party tool JQ as a JSON processor.
Check the overall status.
The UI will report "Kibana status is" and then the status. You can see this in the API output by running the following command:
cat kibana_status.json | jq '{ overall: .status.overall.level }'Check the core plugins.
The UI includes a Plugin status table with a list of plugins. IDs for core plugins use a prefix of
core.You can check these in the API output by running the following command:
cat kibana_status.json | jq -r '.status.core|{ elasticsearch: .elasticsearch.level, savedObjects: .savedObjects.level }'Before you review any further plugins, check that the
elasticsearchandsavedObjectsare healthy and resolve any issues:- If the connection to Elasticsearch is unhealthy, refer to Error: Kibana server is not ready yet.
- If the connection to Saved Objects is unhealthy, refer to Troubleshoot Kibana migration and upgrades.
Check non-core plugins.
The UI Plugin Status list reports the status of the other plugins running on the instance. Plugins can be dependent upon each other. You should first check the health of the common underlying plugins:
alerting,reporting,ruleRegistry,savedObjects,security, andtaskManager.You can check these in the API output by running the following command:
cat kibana_status.json | jq -rc '.status.plugins|to_entries[]|select(.key=="taskManager" or .key=="savedObjects" or .key=="security" or .key=="reporting" or .key=="ruleRegistry" or .key=="alerting") |{plugin:.key, status:.value.level, reason:.value.summary}'For an example of a degraded Task Manager and how that degradation cascades into other plugins, refer to Troubleshooting Kibana health. For more information on investigating a degraded Task Manager, refer to Troubleshoot Kibana Task Manager.
For a deeper troubleshooting walkthrough, refer to our Troubleshooting Kibana health blog and video.