Enhance dashboards
editEnhance dashboards
editNow that you have added panels to your dashboard, you can add filter panels to interact with the data, and Markdown panels to add context to the data. To make your dashboard look the way you want, use the editing options.
Add controls
editTo filter the data on your dashboard in real-time, add a Controls panel.
Kibana supports two types of Controls:
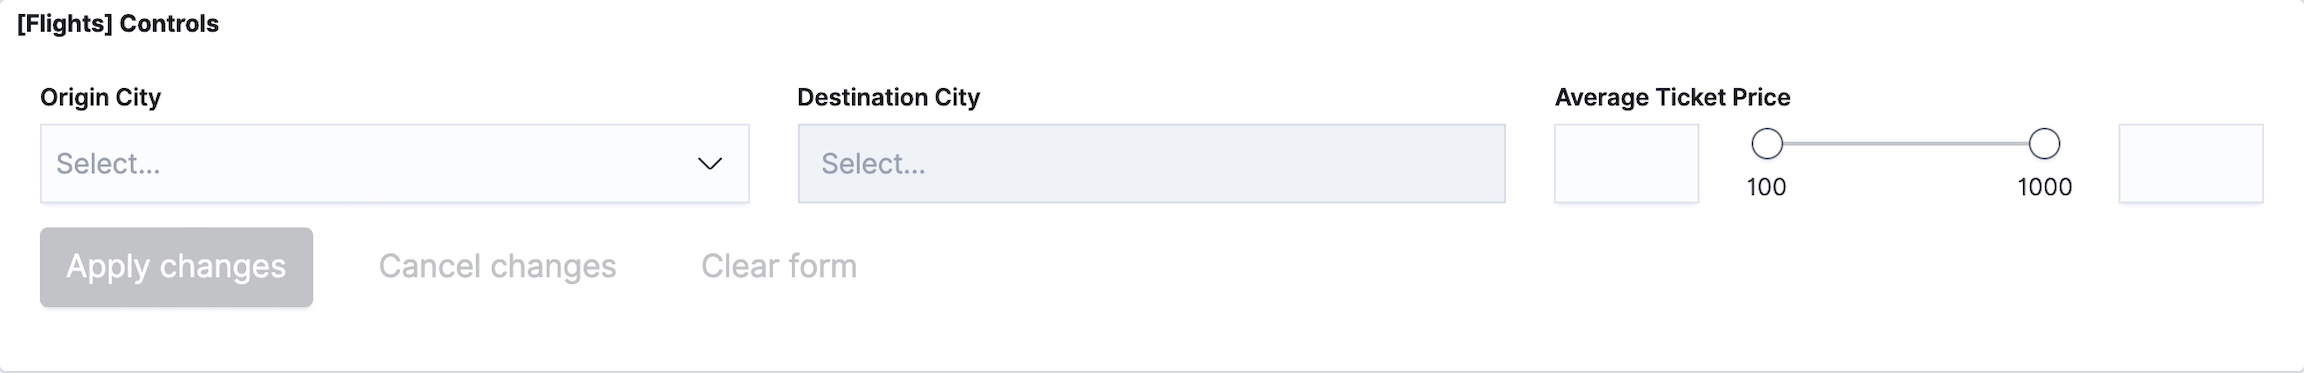
- Options list — Filters content based on one or more specified options. The dropdown menu is dynamically populated with the results of a terms aggregation. For example, use the options list on the sample flight dashboard when you want to filter the data by origin city and destination city.
-
Range slider — Filters data within a specified range of numbers. The minimum and maximum values are dynamically populated with the results of a min and max aggregation. For example, use the range slider when you want to filter the sample flight dashboard by a specific average ticket price.
- From the dashboard, click Create panel.
- On the New Visualization window, click Controls.
- Click Options, then configure the following, then click Update:
- Update Kibana filters on each change — When selected, all interactive inputs create filters that refresh the dashboard. When unselected, Kibana filters are created only when you click Apply changes.
- Use time filter — When selected, the aggregations that generate the options list and time range are connected to the time filter.
- Pin filters for all applications — When selected, all filters created by interacting with the inputs are automatically pinned.
Add text
editAdd text panels with Markdown when you want to provide context to the other panels on your dashboard, such as important information, instructions, and images.
Markdown is a text entry field that accepts GitHub-flavored Markdown text. For information about GitHub-flavored Markdown text, click Help.
- From the dashboard, click Create panel.
- On the New Visualization window, click Text.
- In the Markdown field, enter the text, then click Update.
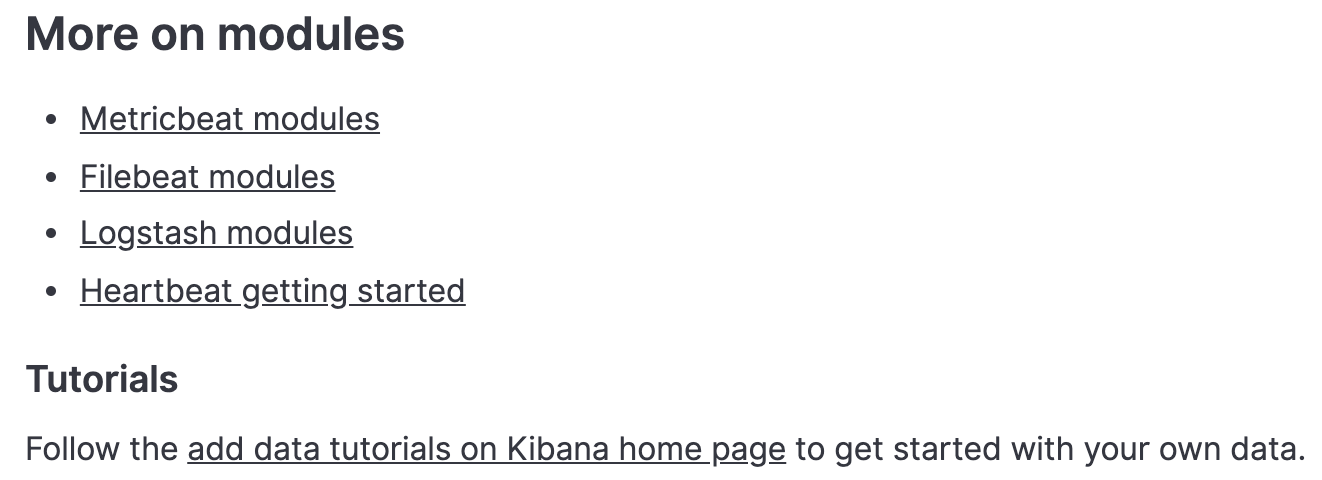
For example, when you enter:
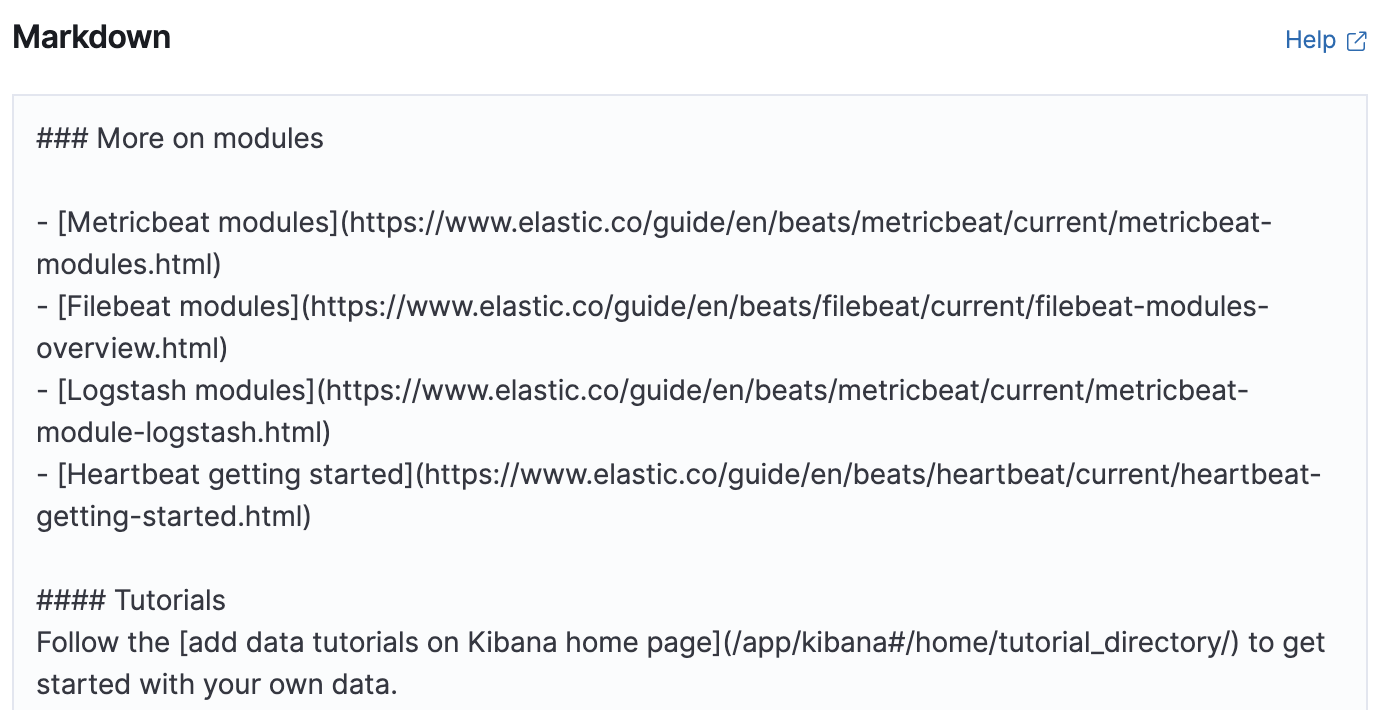
The following instructions are displayed:
Or when you enter:
The following image is displayed: