IMPORTANT: No additional bug fixes or documentation updates
will be released for this version. For the latest information, see the
current release documentation.
Anomaly Detection with Machine Learning
edit
IMPORTANT: This documentation is no longer updated. Refer to Elastic's version policy and the latest documentation.
Anomaly Detection with Machine Learning
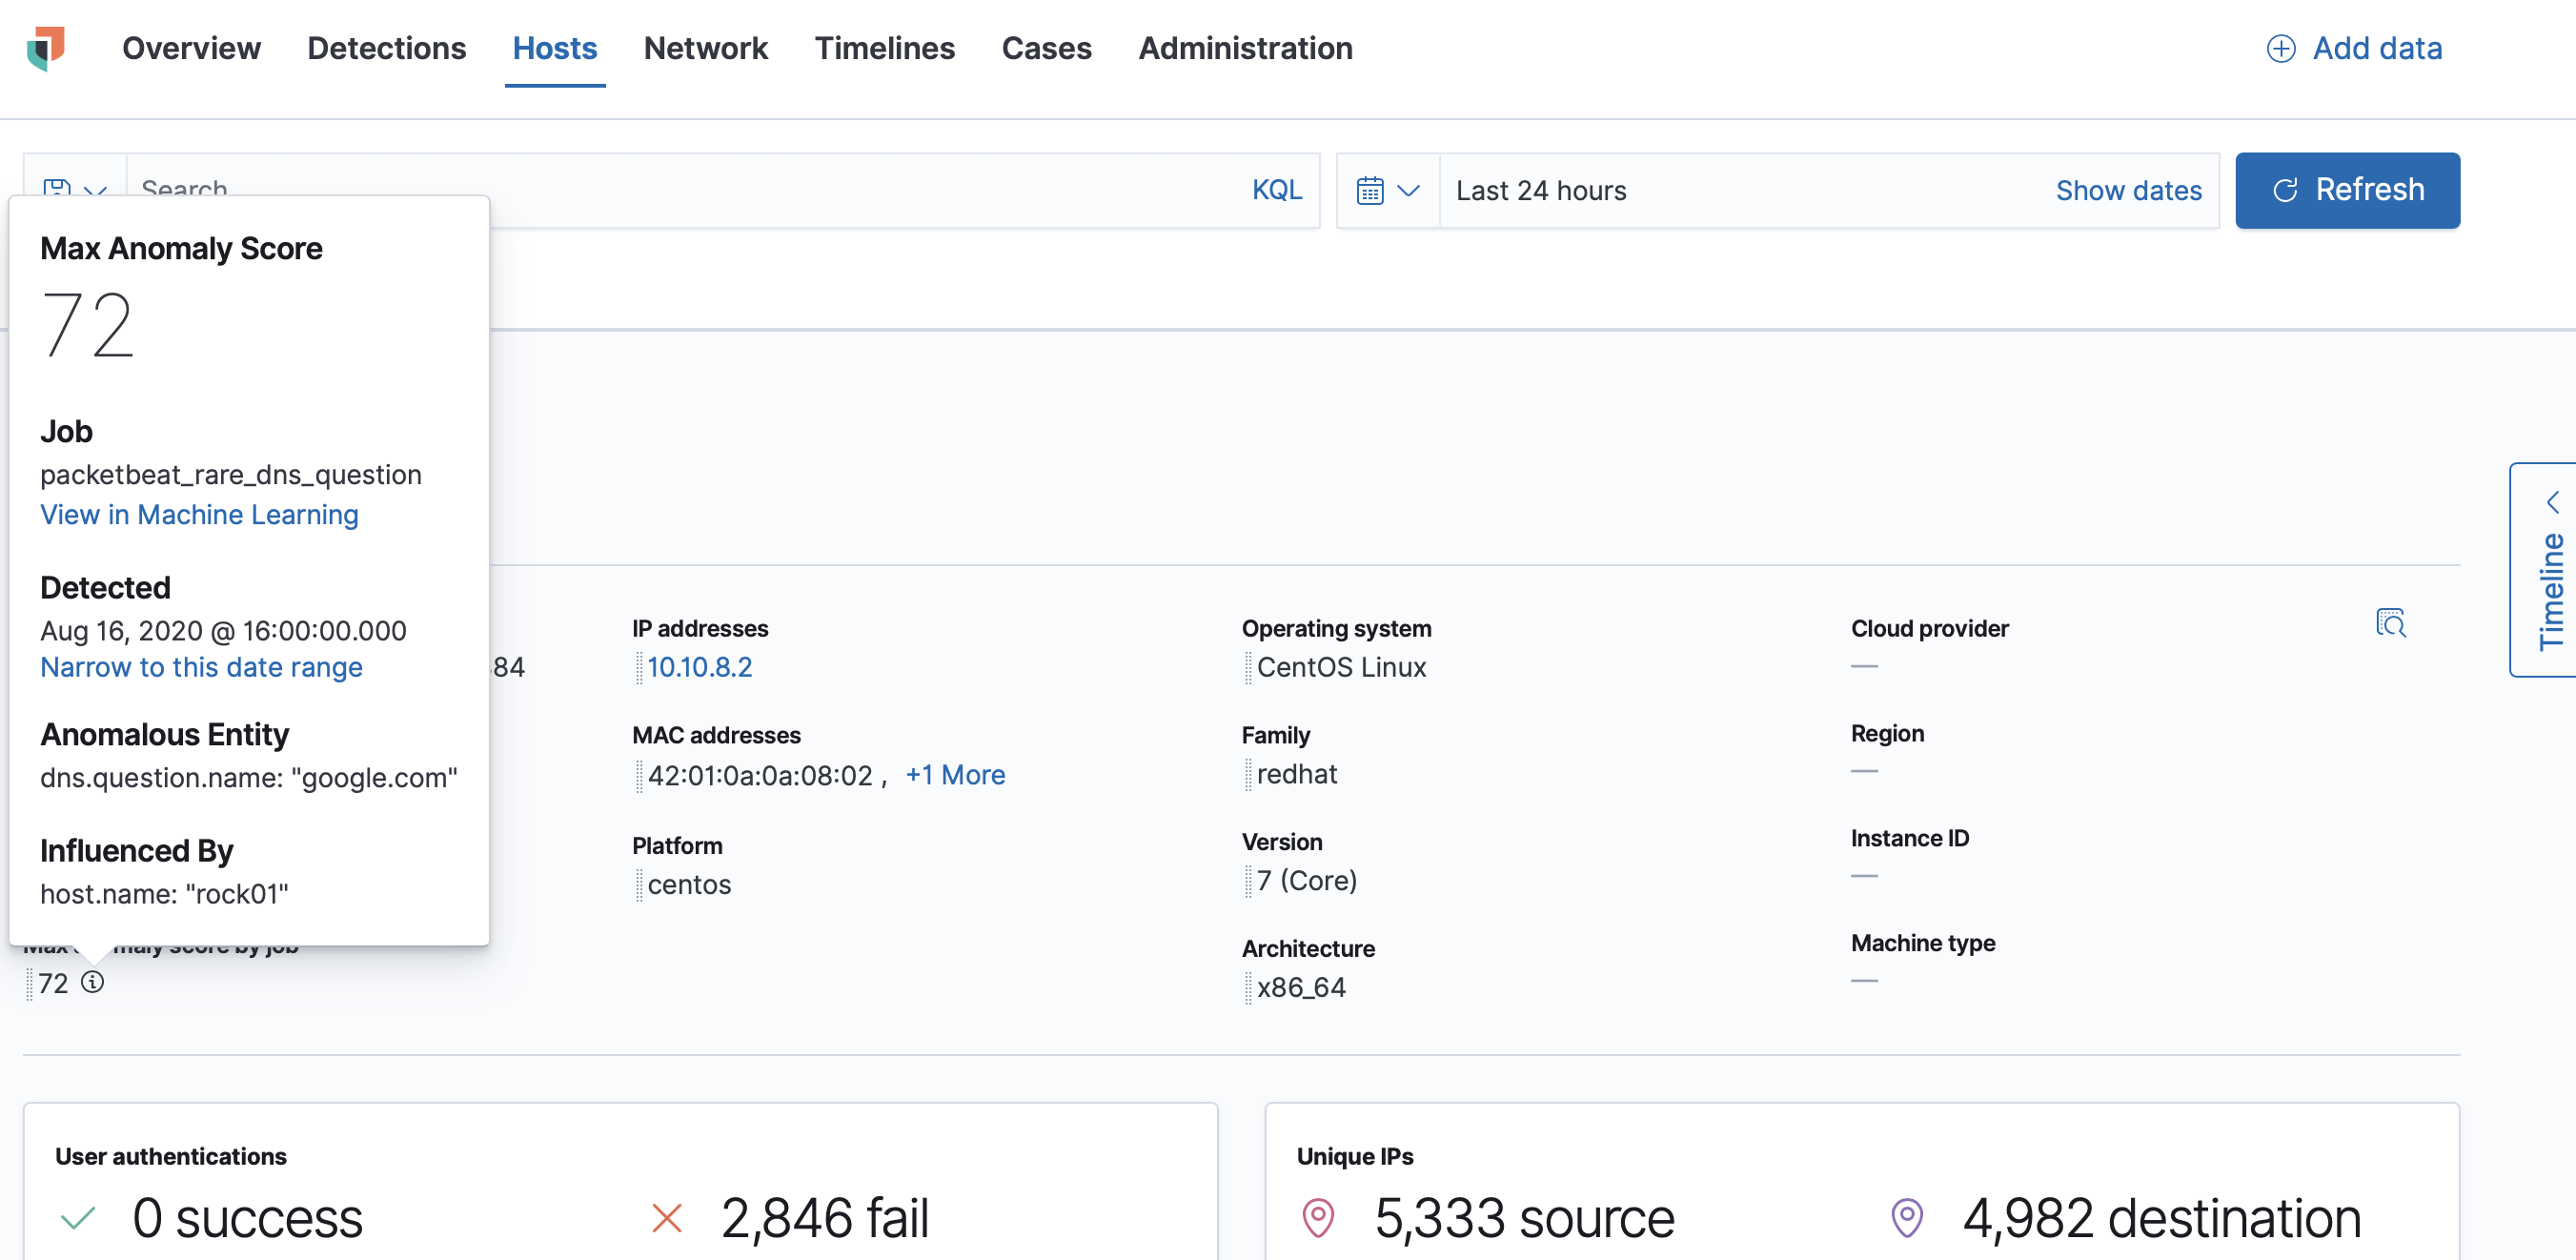
editFor Free Trial
and Platinum subscription deployments,
Machine Learning functionality is available throughout Elastic Security. You can
view the details of detected anomalies in the Anomalies table
shown on the Hosts, Network and associated details pages. You can drag and drop
anomaly details to Timeline, such as the Entity itself, or any of the
associated Influencers.