IMPORTANT: No additional bug fixes or documentation updates
will be released for this version. For the latest information, see the
current release documentation.
Search geographic data
edit
IMPORTANT: This documentation is no longer updated. Refer to Elastic's version policy and the latest documentation.
Search geographic data
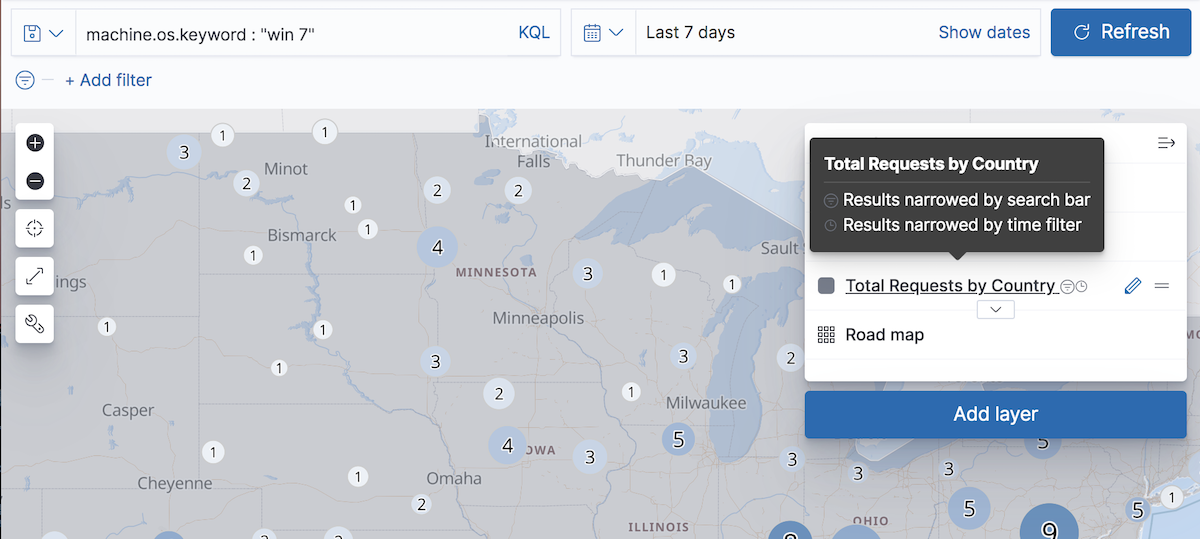
editUse the filters, query bar, and time filter to focus in on just the data you want.
Only layers requesting data from Elasticsearch are narrowed when you submit a search request.
Layers narrowed by the filters and query bar contain the filter icon ![]() next to the layer name in the legend.
Only layers requesting data from Elasticsearch using an index pattern with a configured time field are narrowed by the time filter.
Layers narrowed by the time filter contain the clock icon
next to the layer name in the legend.
Only layers requesting data from Elasticsearch using an index pattern with a configured time field are narrowed by the time filter.
Layers narrowed by the time filter contain the clock icon ![]() next to the layer name in the legend.
next to the layer name in the legend.
You can create a layer that requests data from Elasticsearch from the following:
-
Vector layer with:
- Documents
- Clusters and grid
- Point to point
- Term join
- Tracks
- Heat map layer