Elastic Security
editElastic Security
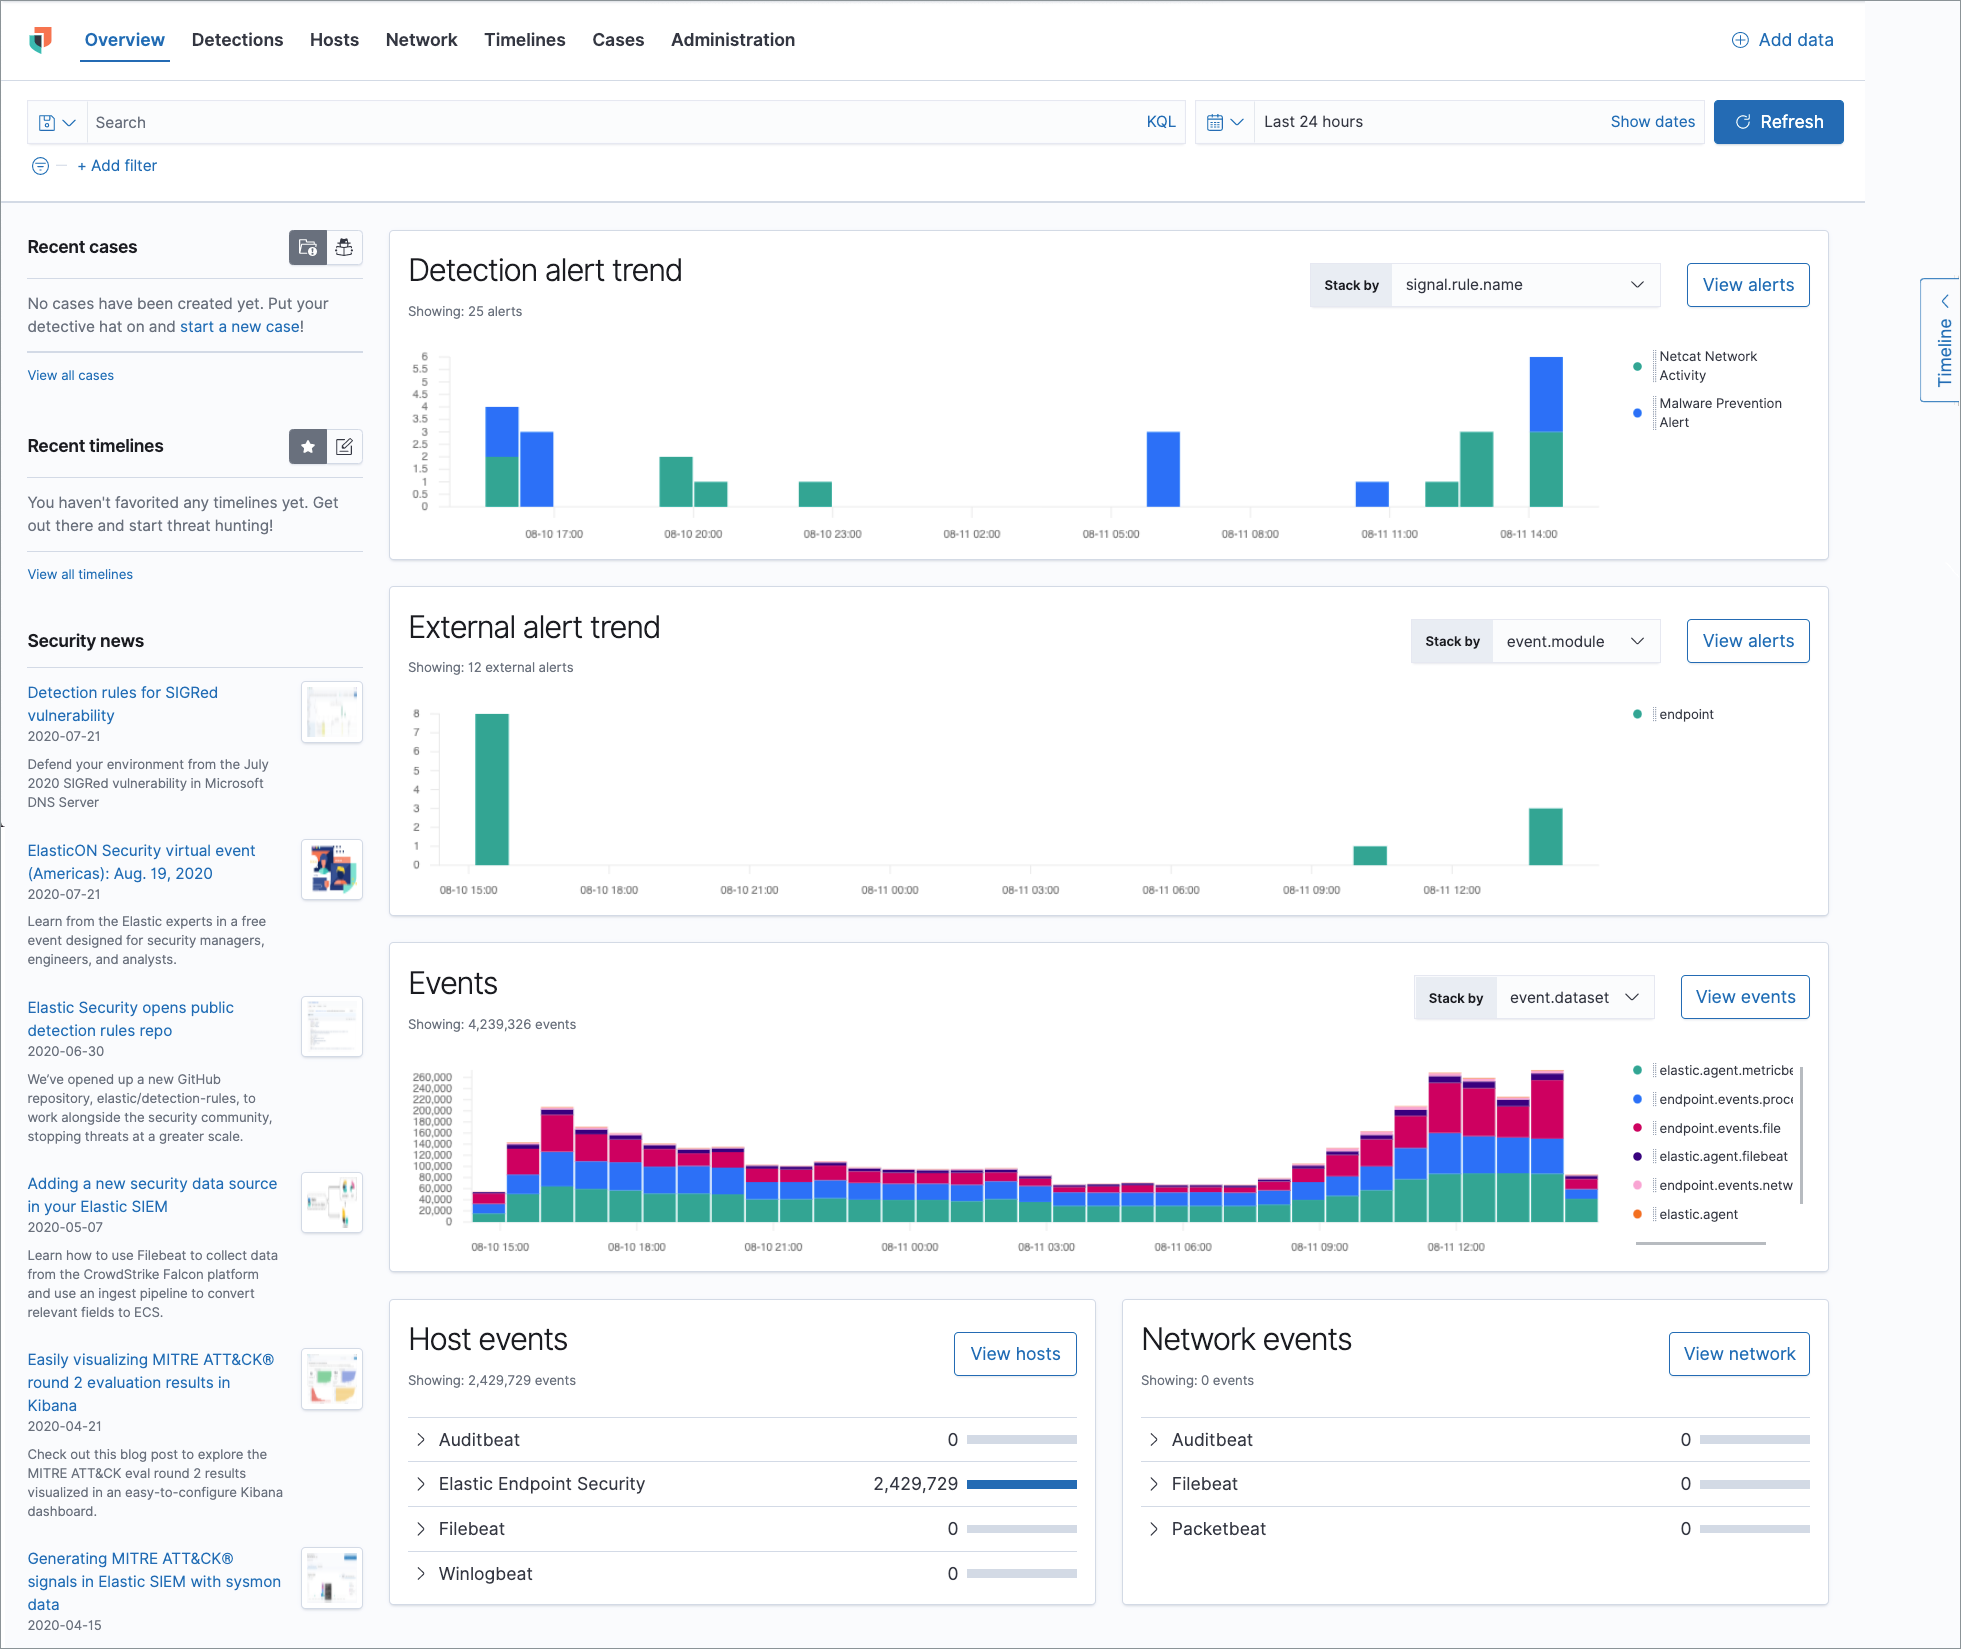
editElastic Security combines SIEM threat detection features with endpoint prevention and response capabilities in one solution, including:
- A detection engine to identify attacks and system misconfiguration
- A workspace for event triage and investigations
- Interactive visualizations to investigate process relationships
- Embedded case management and automated actions
- Detection of signatureless attacks with prebuilt machine learning anomaly jobs and detection rules
Add data
editKibana provides step-by-step instructions to help you add data. The Security Guide is a good source for more detailed information and instructions.
Beats
editAuditbeat, Filebeat, Winlogbeat, and Packetbeat send security events and other data to Elasticsearch.
The default index patterns for Elastic Security events are auditbeat-*, winlogbeat-*,
filebeat-*, packetbeat-*, endgame-*, logs-*, and apm-*-transaction*. To change the default pattern patterns, go to Stack Management > Advanced Settings > securitySolution:defaultIndex.
Elastic Security endpoint agent
editThe agent detects and protects against malware, and ships host and network events directly to Elastic Security.
Elastic Common Schema (ECS) for normalizing data
editThe Elastic Common Schema (ECS) defines a common set of fields to be used for storing event data in Elasticsearch. ECS helps users normalize their event data to better analyze, visualize, and correlate the data represented in their events.
Elastic Security can ingest and normalize events from ECS-compatible data sources.