Rendering pre-captured profiler JSON
editRendering pre-captured profiler JSON
editThe Search Profiler queries the cluster that the Kibana node is attached to. It does this by executing the query against the cluster and collecting the results.
But sometimes you may want to investigate performance problems that are temporal in nature. For example, a query might only be slow at certain time of day when many customers are using your system. You can setup a process to automatically profile slow queries when they occur and then save those profile responses for later analysis.
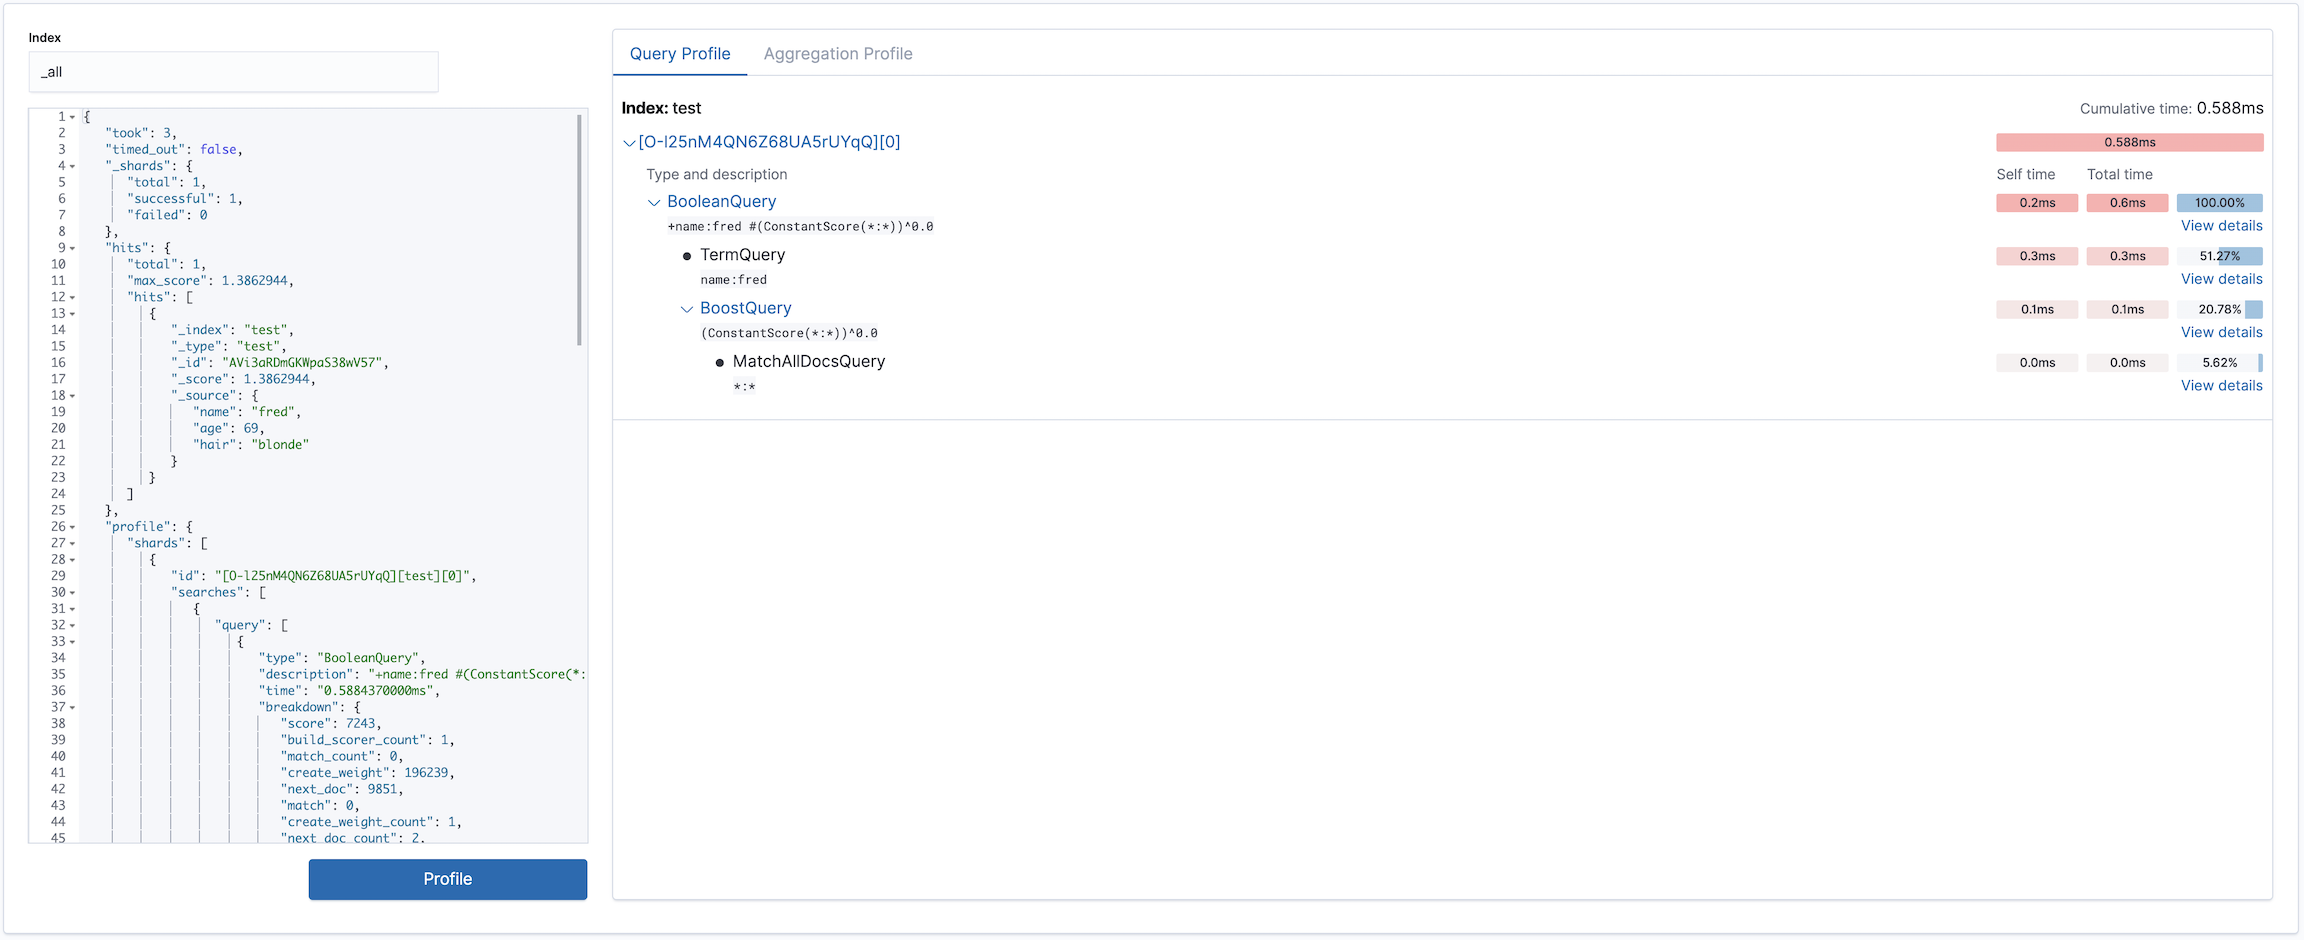
The Search Profiler supports this workflow by allowing you to paste the pre-captured JSON in the query editor. The Search Profiler will detect that you have entered a JSON response (rather than a query) and will just render the visualization, rather than querying the cluster.
To see how this works, copy and paste the following profile response into the query editor and click Profile.
{
   "took": 3,
   "timed_out": false,
   "_shards": {
      "total": 1,
      "successful": 1,
      "failed": 0
   },
   "hits": {
      "total": 1,
      "max_score": 1.3862944,
      "hits": [
         {
            "_index": "test",
            "_type": "test",
            "_id": "AVi3aRDmGKWpaS38wV57",
            "_score": 1.3862944,
            "_source": {
               "name": "fred",
               "age": 69,
               "hair": "blonde"
            }
         }
      ]
   },
   "profile": {
      "shards": [
         {
            "id": "[O-l25nM4QN6Z68UA5rUYqQ][test][0]",
            "searches": [
               {
                  "query": [
                     {
                        "type": "BooleanQuery",
                        "description": "+name:fred #(ConstantScore(*:*))^0.0",
                        "time": "0.5884370000ms",
                        "breakdown": {
                           "score": 7243,
                           "build_scorer_count": 1,
                           "match_count": 0,
                           "create_weight": 196239,
                           "next_doc": 9851,
                           "match": 0,
                           "create_weight_count": 1,
                           "next_doc_count": 2,
                           "score_count": 1,
                           "build_scorer": 375099,
                           "advance": 0,
                           "advance_count": 0
                        },
                        "children": [
                           {
                              "type": "TermQuery",
                              "description": "name:fred",
                              "time": "0.3016880000ms",
                              "breakdown": {
                                 "score": 4218,
                                 "build_scorer_count": 1,
                                 "match_count": 0,
                                 "create_weight": 132425,
                                 "next_doc": 2196,
                                 "match": 0,
                                 "create_weight_count": 1,
                                 "next_doc_count": 2,
                                 "score_count": 1,
                                 "build_scorer": 162844,
                                 "advance": 0,
                                 "advance_count": 0
                              }
                           },
                           {
                              "type": "BoostQuery",
                              "description": "(ConstantScore(*:*))^0.0",
                              "time": "0.1223030000ms",
                              "breakdown": {
                                 "score": 0,
                                 "build_scorer_count": 1,
                                 "match_count": 0,
                                 "create_weight": 17366,
                                 "next_doc": 0,
                                 "match": 0,
                                 "create_weight_count": 1,
                                 "next_doc_count": 0,
                                 "score_count": 0,
                                 "build_scorer": 102329,
                                 "advance": 2604,
                                 "advance_count": 2
                              },
                              "children": [
                                 {
                                    "type": "MatchAllDocsQuery",
                                    "description": "*:*",
                                    "time": "0.03307600000ms",
                                    "breakdown": {
                                       "score": 0,
                                       "build_scorer_count": 1,
                                       "match_count": 0,
                                       "create_weight": 6068,
                                       "next_doc": 0,
                                       "match": 0,
                                       "create_weight_count": 1,
                                       "next_doc_count": 0,
                                       "score_count": 0,
                                       "build_scorer": 25615,
                                       "advance": 1389,
                                       "advance_count": 2
                                    }
                                 }
                              ]
                           }
                        ]
                     }
                  ],
                  "rewrite_time": 168640,
                  "collector": [
                     {
                        "name": "CancellableCollector",
                        "reason": "search_cancelled",
                        "time": "0.02952900000ms",
                        "children": [
                           {
                              "name": "SimpleTopScoreDocCollector",
                              "reason": "search_top_hits",
                              "time": "0.01931700000ms"
                           }
                        ]
                     }
                  ]
               }
            ],
            "aggregations": []
         }
      ]
   }
}