Managing Alerts
editManaging Alerts
editThis functionality is in beta and is subject to change. The design and code is less mature than official GA features and is being provided as-is with no warranties. Beta features are not subject to the support SLA of official GA features.
The Alerts tab provides a cross-app view of alerting. Different Kibana apps like Metrics, APM, Uptime, and SIEM can offer their own alerts, and the Alerts tab provides a central place to:
- Create and edit alerts
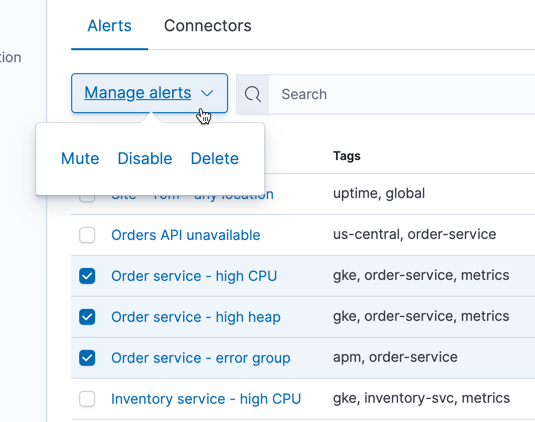
- Control alerts including enabling/disabling, muting/unmuting, and deleting
- Drill-down to alert details
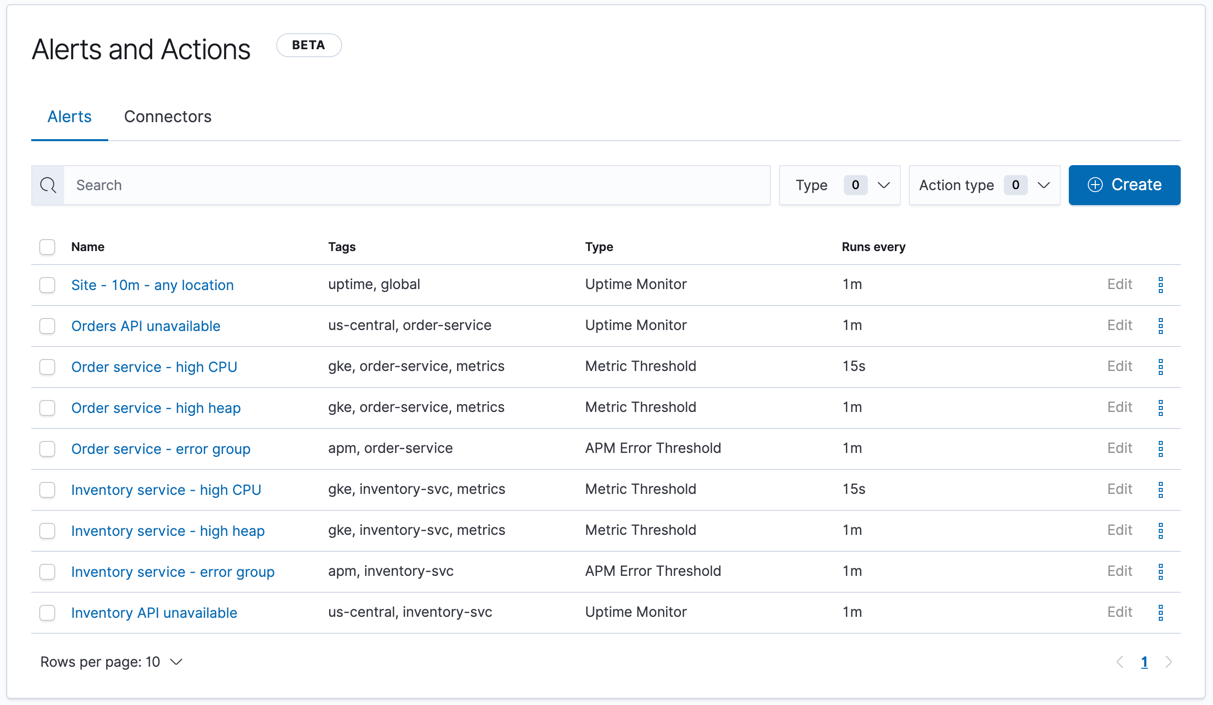
For more information on alerting concepts and the types of alerts and actions available, see Alerting and Actions.
Finding alerts
editThe Alerts tab lists all alerts in the current space, including summary information about their execution frequency, tags, and type.
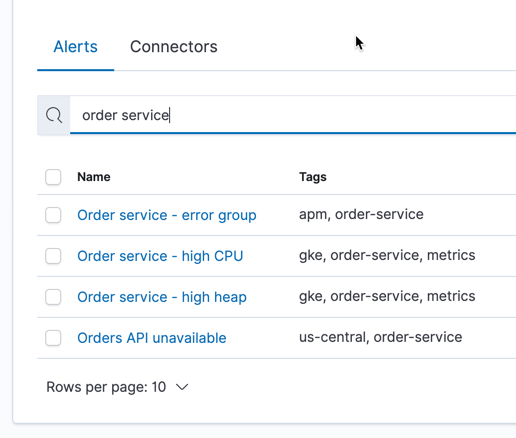
The search bar can be used to quickly find alerts by name or tag.
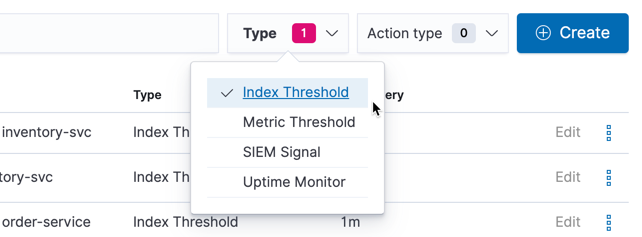
The type dropdown lets you filter to a subset of alert types.
The Action type dropdown lets you filter by the type of action used in the alert.
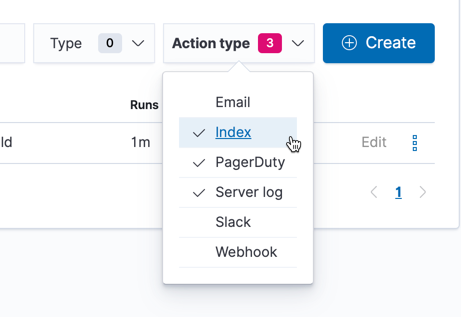
Creating and editing alerts
editMany alerts must be created within the context of a Kibana app like Metrics, APM, or Uptime, but others are generic. Generic alert types can be created in the Alerts management UI by clicking the Create button. This will launch a flyout that guides you through selecting an alert type and configuring it’s properties. Refer to Alert types for details on what types of alerts are available and how to configure them.
After an alert is created, you can re-open the flyout and change an alerts properties by clicking the Edit button shown on each row of the alert listing.
Controlling alerts
editThe alert listing allows you to quickly mute/unmute, disable/enable, and delete individual alerts by clicking the action button.

These operations can also be performed in bulk by multi-selecting alerts and clicking the Manage alerts button:
