- Kibana Guide: other versions:
- What is Kibana?
- What’s new in 8.8
- Kibana concepts
- Quick start
- Set up
- Install Kibana
- Configure Kibana
- Alerting and action settings
- APM settings
- Banners settings
- Cases settings
- Enterprise Search settings
- Fleet settings
- i18n settings
- Logging settings
- Logs settings
- Metrics settings
- Monitoring settings
- Reporting settings
- Search sessions settings
- Secure settings
- Security settings
- Spaces settings
- Task Manager settings
- Telemetry settings
- URL drilldown settings
- Start and stop Kibana
- Access Kibana
- Securing access to Kibana
- Add data
- Upgrade Kibana
- Configure security
- Configure reporting
- Configure logging
- Configure monitoring
- Command line tools
- Production considerations
- Discover
- Dashboard and visualizations
- Canvas
- Maps
- Build a map to compare metrics by country or region
- Track, visualize, and alert on assets in real time
- Map custom regions with reverse geocoding
- Heat map layer
- Tile layer
- Vector layer
- Plot big data
- Search geographic data
- Configure map settings
- Connect to Elastic Maps Service
- Import geospatial data
- Troubleshoot
- Reporting and sharing
- Machine learning
- Graph
- Alerting
- Observability
- APM
- Security
- Dev Tools
- Fleet
- Osquery
- Stack Monitoring
- Stack Management
- REST API
- Get features API
- Kibana spaces APIs
- Kibana role management APIs
- User session management APIs
- Saved objects APIs
- Data views API
- Index patterns APIs
- Alerting APIs
- Action and connector APIs
- Cases APIs
- Add comment
- Create case
- Delete cases
- Delete comments
- Find case activity
- Find cases
- Find connectors
- Get alerts
- Get case activity
- Get case
- Get case status
- Get cases by alert
- Get comments
- Get configuration
- Get reporters
- Get tags
- Push case
- Set configuration
- Update cases
- Update comment
- Update configuration
- Import and export dashboard APIs
- Logstash configuration management APIs
- Machine learning APIs
- Osquery manager API
- Short URLs APIs
- Get Task Manager health
- Upgrade assistant APIs
- Kibana plugins
- Troubleshooting
- Accessibility
- Release notes
- Kibana 8.8.2
- Kibana 8.8.1
- Kibana 8.8.0
- Kibana 8.7.1
- Kibana 8.7.0
- Kibana 8.6.1
- Kibana 8.6.0
- Kibana 8.5.2
- Kibana 8.5.1
- Kibana 8.5.0
- Kibana 8.4.3
- Kibana 8.4.2
- Kibana 8.4.1
- Kibana 8.4.0
- Kibana 8.3.3
- Kibana 8.3.2
- Kibana 8.3.1
- Kibana 8.3.0
- Kibana 8.2.3
- Kibana 8.2.2
- Kibana 8.2.1
- Kibana 8.2.0
- Kibana 8.1.3
- Kibana 8.1.2
- Kibana 8.1.1
- Kibana 8.1.0
- Kibana 8.0.0
- Kibana 8.0.0-rc2
- Kibana 8.0.0-rc1
- Kibana 8.0.0-beta1
- Kibana 8.0.0-alpha2
- Kibana 8.0.0-alpha1
- Developer guide
Trace sample timeline
editTrace sample timeline
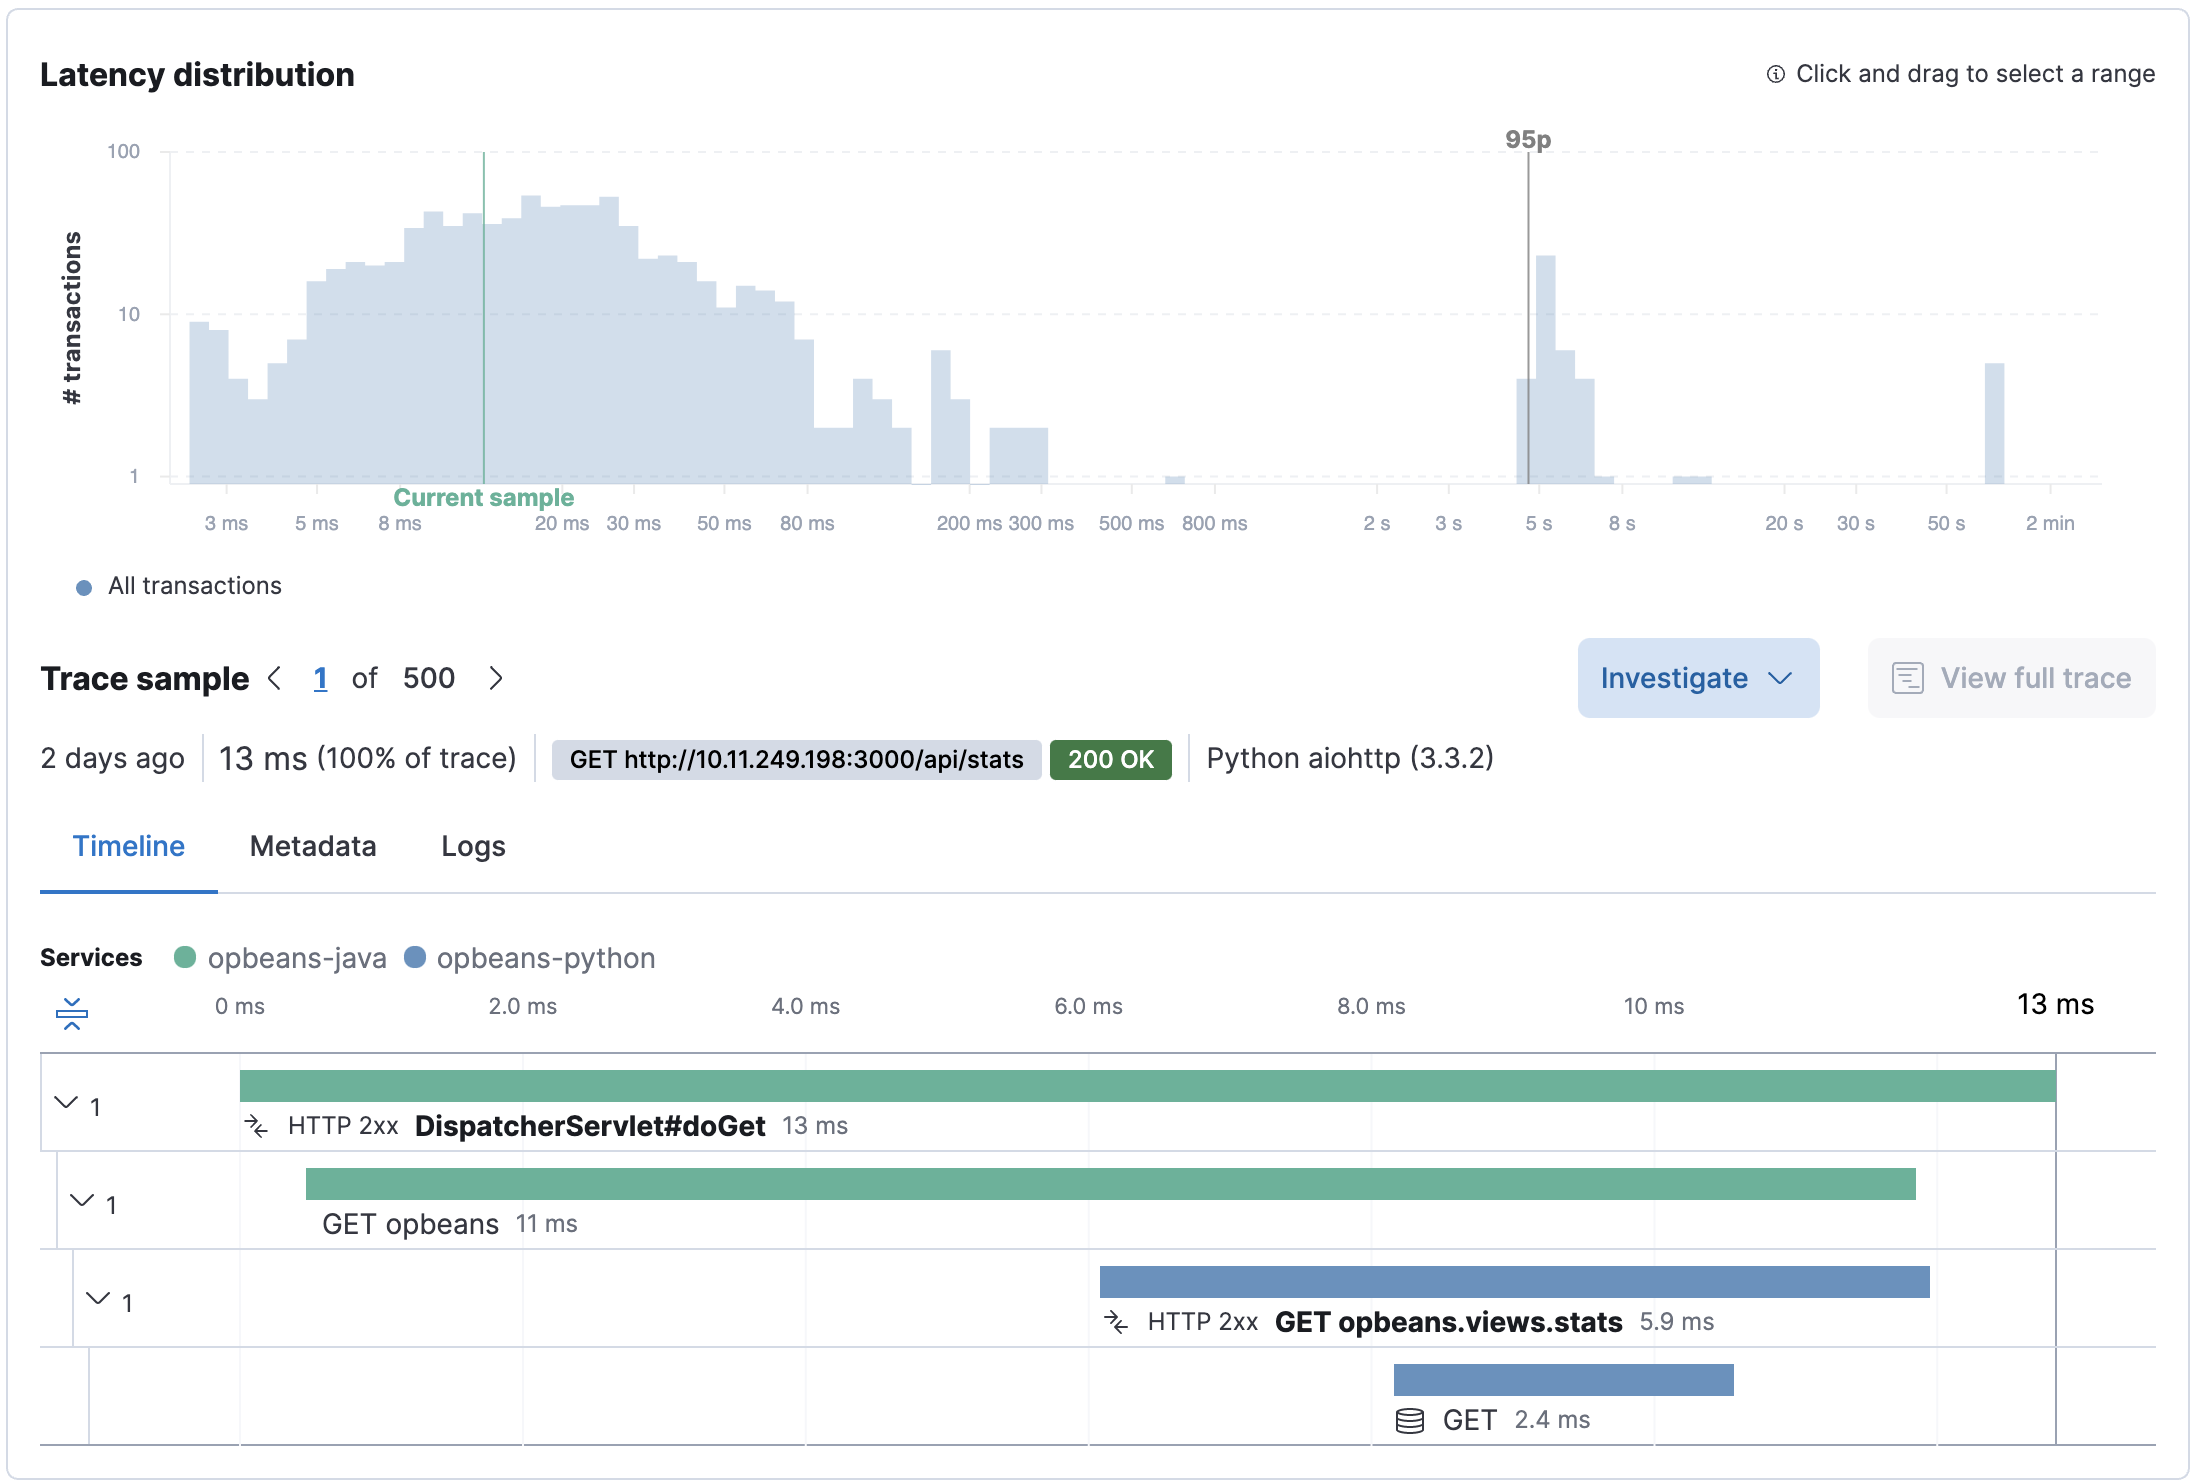
editThe trace sample timeline visualization is a bird’s-eye view of what your application was doing while it was trying to respond to a request. This makes it useful for visualizing where a selected transaction spent most of its time.

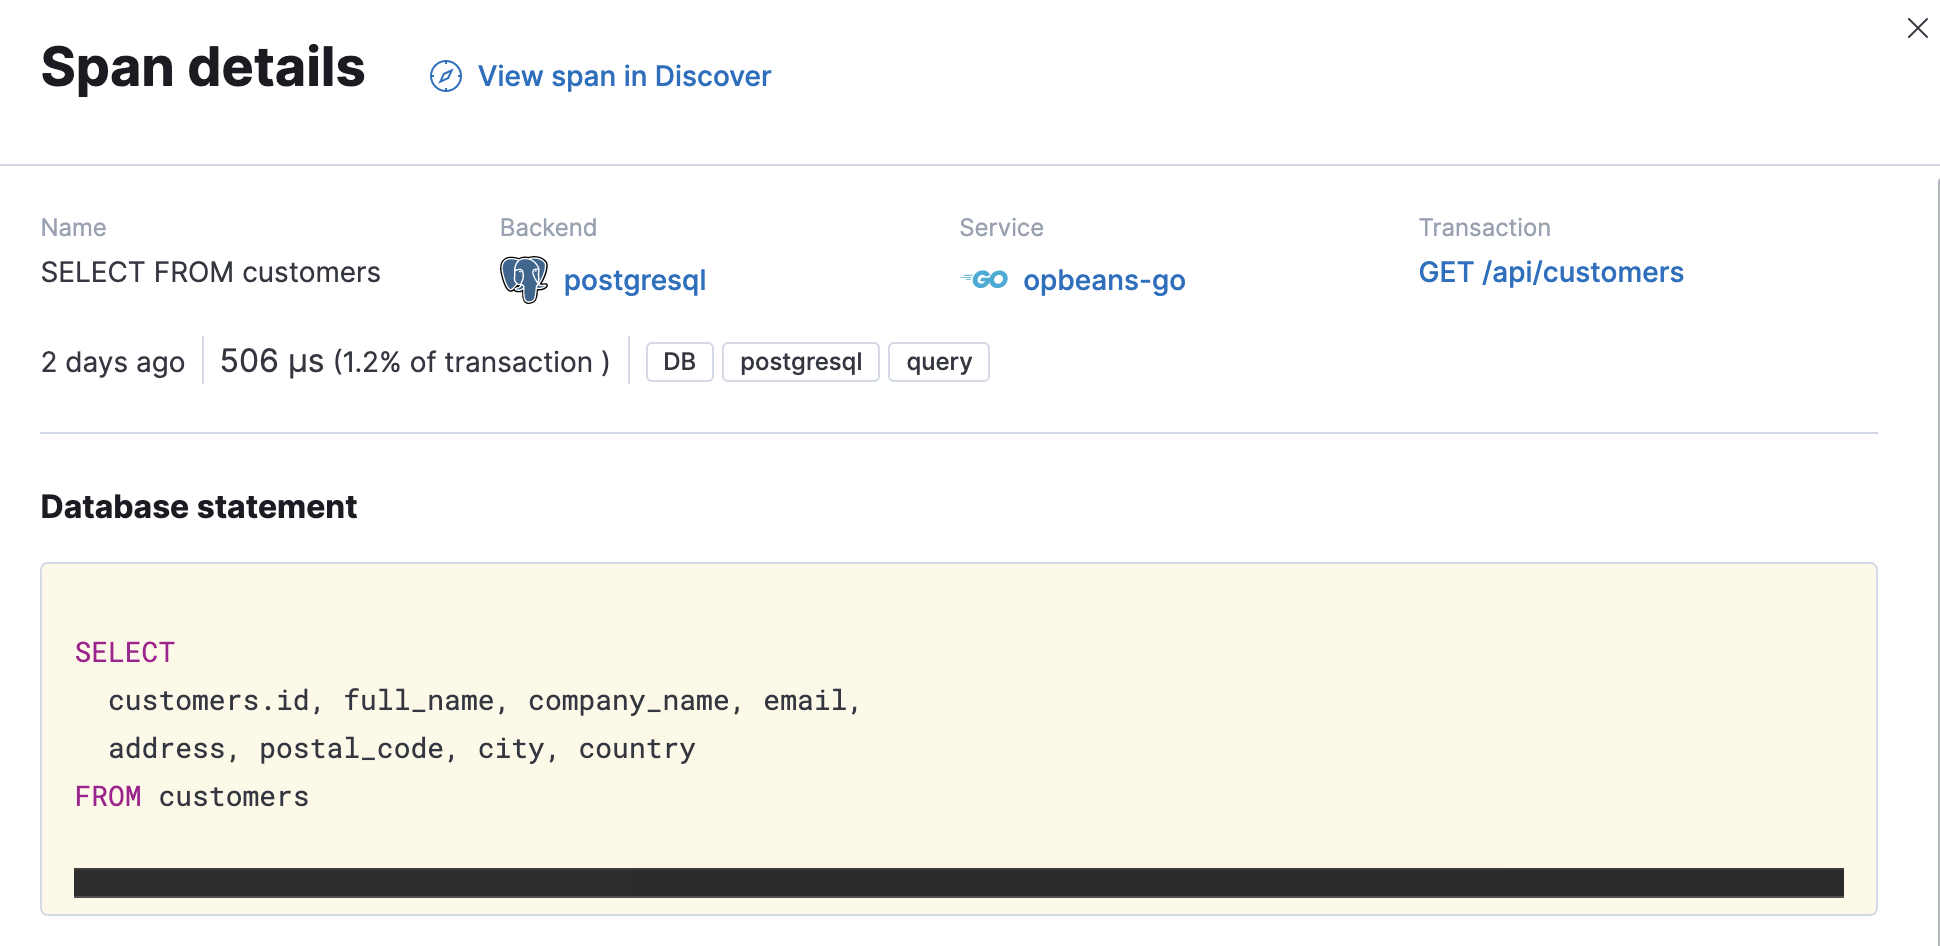
View a span in detail by clicking on it in the timeline waterfall. For example, when you click on an SQL Select database query, the information displayed includes the actual SQL that was executed, how long it took, and the percentage of the trace’s total time. You also get a stack trace, which shows the SQL query in your code. Finally, APM knows which files are your code and which are just modules or libraries that you’ve installed. These library frames will be minimized by default in order to show you the most relevant stack trace.
A span is the duration of a single event. Spans are automatically captured by APM agents, and you can also define custom spans. Each span has a type and is defined by a different color in the timeline/waterfall visualization.

Investigate
editThe trace sample timeline features an Investigate button which provides a quick way to jump to other areas of the Elastic Observability UI while maintaining the context of the currently selected trace sample. For example, quickly view:
- logs and metrics for the selected pod
- logs and metrics for the selected host
-
trace logs for the selected
trace.id - uptime status of the selected domain
- the service map filtered by the selected trace
- the selected transaction in Discover
- your custom links
Distributed tracing
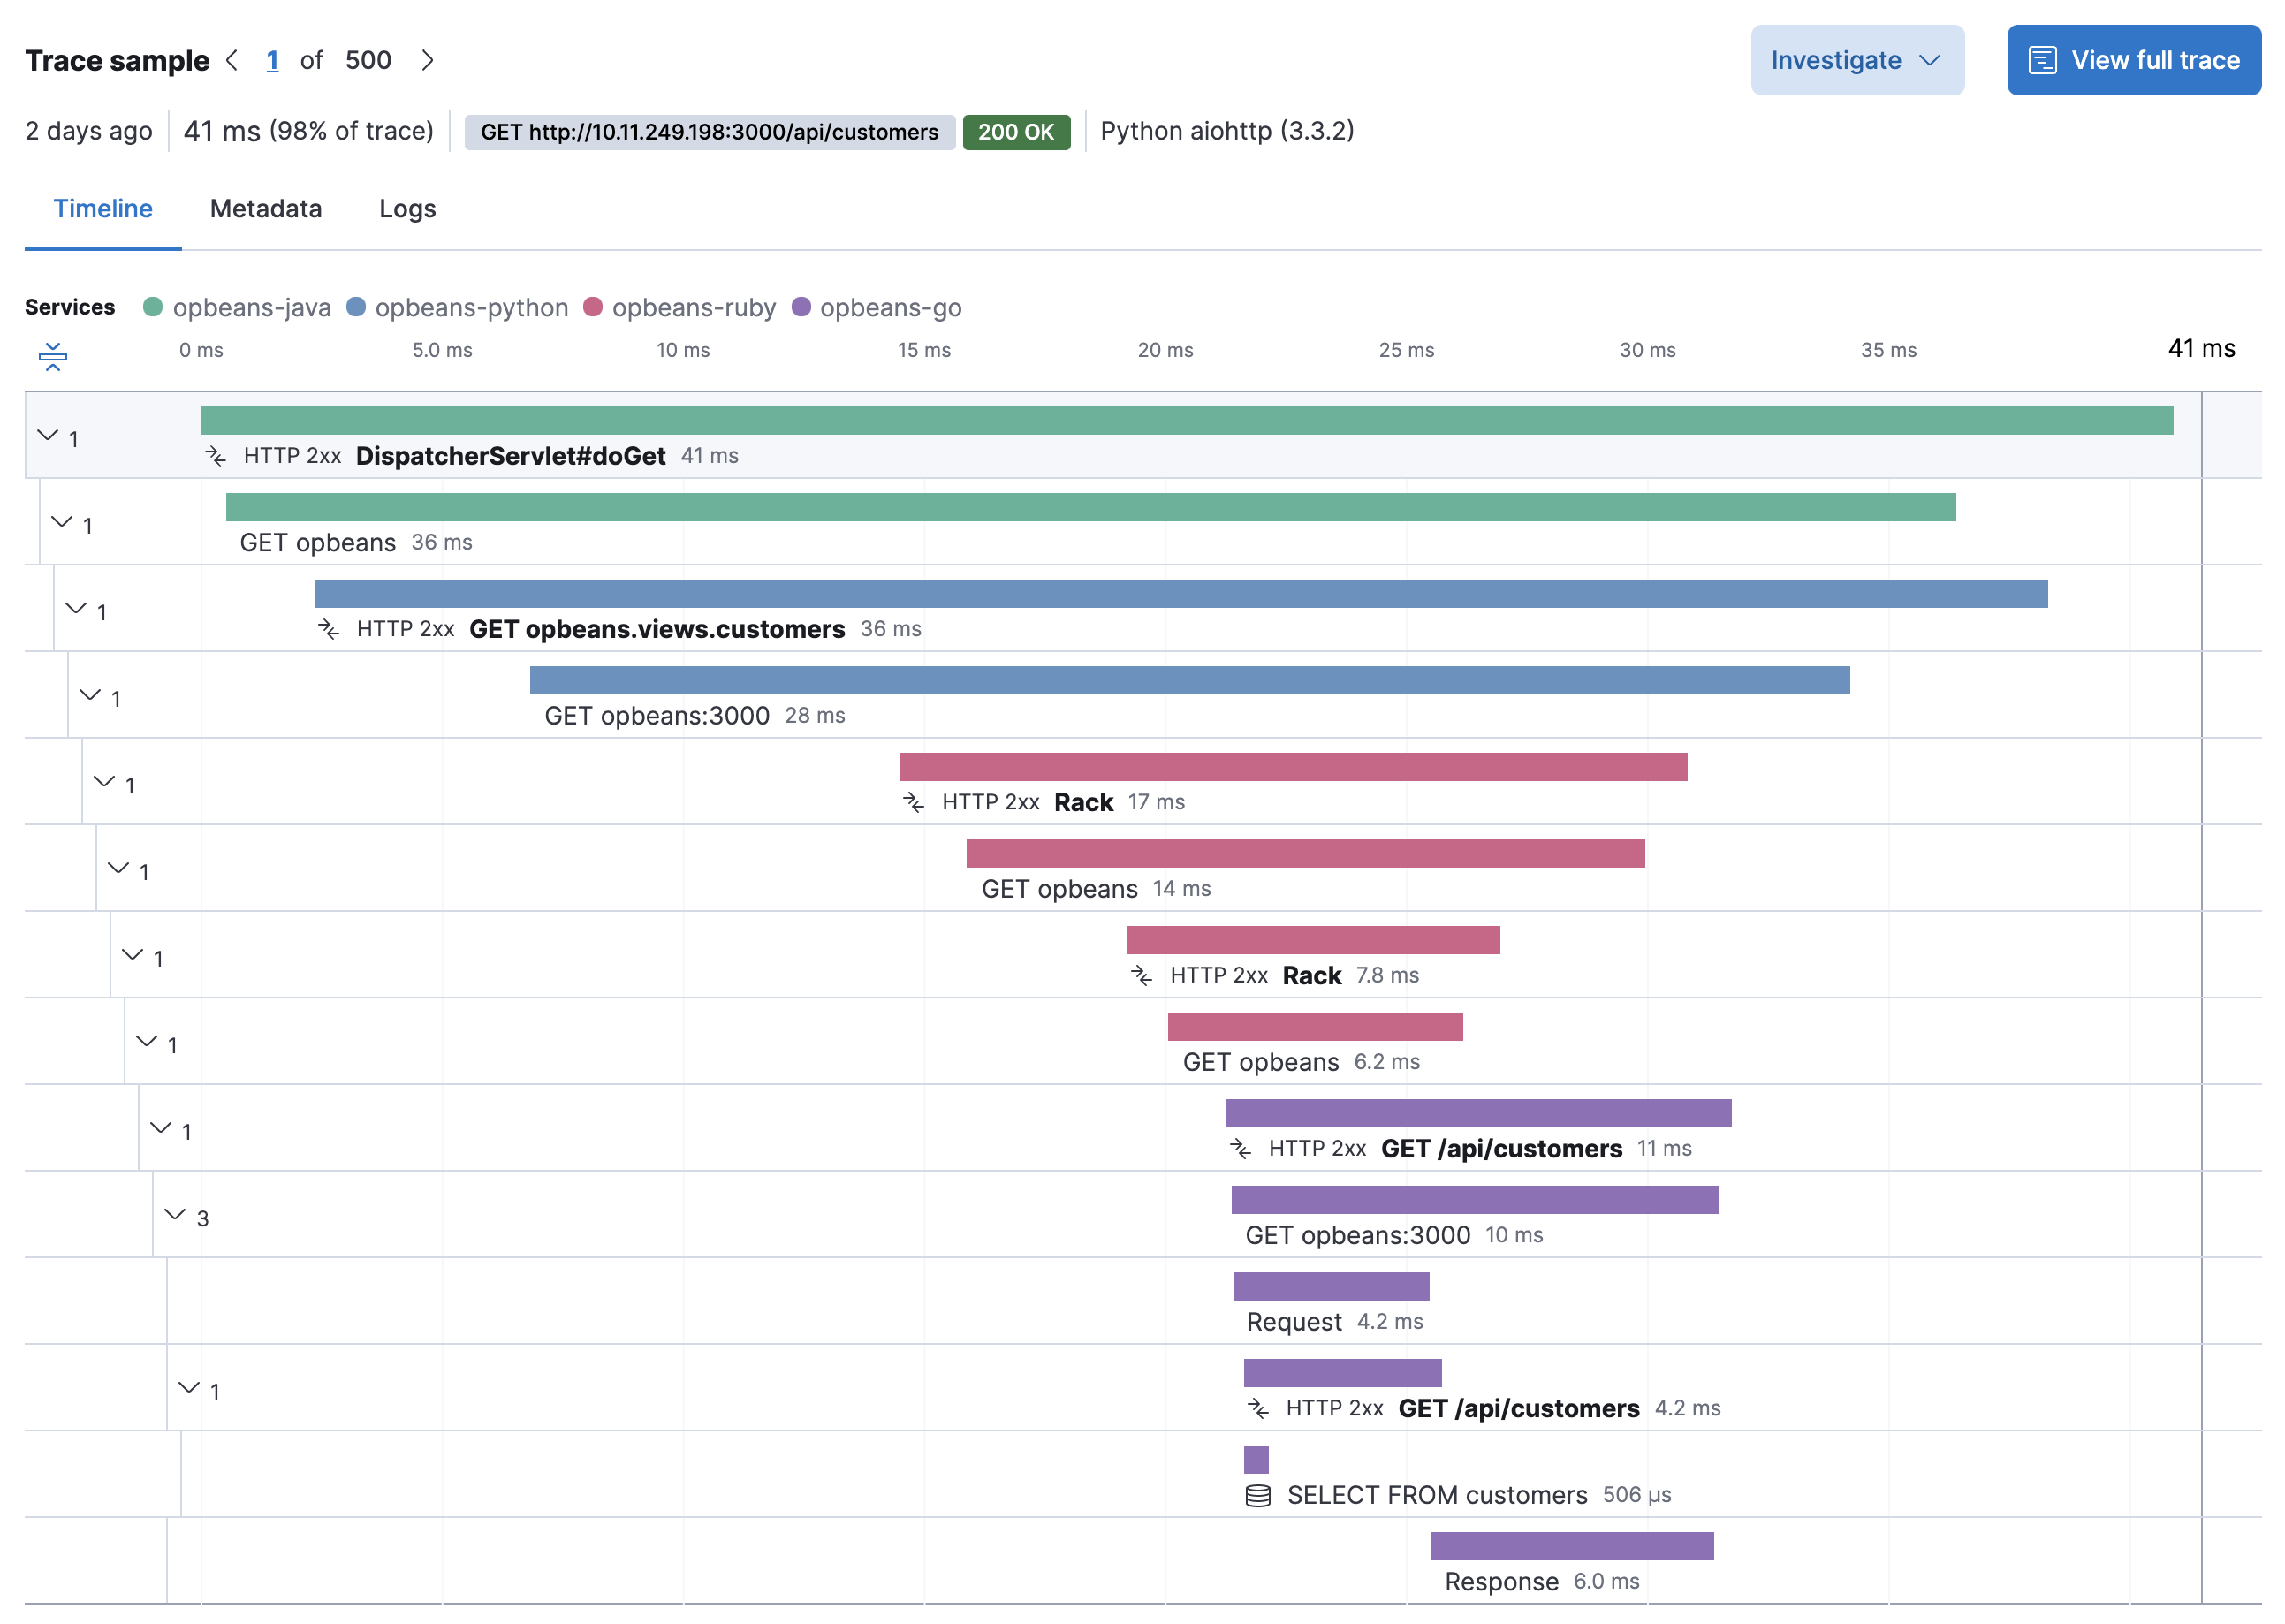
editIf your trace sample timeline is colorful, it’s indicative of a distributed trace. Services in a distributed trace are separated by color and listed in the order they occur.

As application architectures are shifting from monolithic to more distributed, service-based architectures, distributed tracing has become a crucial feature of modern application performance monitoring. It allows you to trace requests through your service architecture automatically, and visualize those traces in one single view in the APM app. From initial web requests to your front-end service, to queries made to your back-end services, this makes finding possible bottlenecks throughout your application much easier and faster.

Don’t forget; by definition, a distributed trace includes more than one transaction.
When viewing distributed traces in the timeline waterfall,
you’ll see this icon: ![]() ,
which indicates the next transaction in the trace.
For easier problem isolation, transactions can be collapsed in the waterfall by clicking
the icon to the left of the transactions.
Transactions can also be expanded and viewed in detail by clicking on them.
,
which indicates the next transaction in the trace.
For easier problem isolation, transactions can be collapsed in the waterfall by clicking
the icon to the left of the transactions.
Transactions can also be expanded and viewed in detail by clicking on them.
After exploring these traces, you can return to the full trace by clicking View full trace.
Distributed tracing is supported by all APM agents, and there’s no additional configuration needed.
On this page