- Kibana Guide: other versions:
- What is Kibana?
- What’s new in 8.8
- Kibana concepts
- Quick start
- Set up
- Install Kibana
- Configure Kibana
- Alerting and action settings
- APM settings
- Banners settings
- Cases settings
- Enterprise Search settings
- Fleet settings
- i18n settings
- Logging settings
- Logs settings
- Metrics settings
- Monitoring settings
- Reporting settings
- Search sessions settings
- Secure settings
- Security settings
- Spaces settings
- Task Manager settings
- Telemetry settings
- URL drilldown settings
- Start and stop Kibana
- Access Kibana
- Securing access to Kibana
- Add data
- Upgrade Kibana
- Configure security
- Configure reporting
- Configure logging
- Configure monitoring
- Command line tools
- Production considerations
- Discover
- Dashboard and visualizations
- Canvas
- Maps
- Build a map to compare metrics by country or region
- Track, visualize, and alert on assets in real time
- Map custom regions with reverse geocoding
- Heat map layer
- Tile layer
- Vector layer
- Plot big data
- Search geographic data
- Configure map settings
- Connect to Elastic Maps Service
- Import geospatial data
- Troubleshoot
- Reporting and sharing
- Machine learning
- Graph
- Alerting
- Observability
- APM
- Security
- Dev Tools
- Fleet
- Osquery
- Stack Monitoring
- Stack Management
- REST API
- Get features API
- Kibana spaces APIs
- Kibana role management APIs
- User session management APIs
- Saved objects APIs
- Data views API
- Index patterns APIs
- Alerting APIs
- Action and connector APIs
- Cases APIs
- Add comment
- Create case
- Delete cases
- Delete comments
- Find case activity
- Find cases
- Find connectors
- Get alerts
- Get case activity
- Get case
- Get case status
- Get cases by alert
- Get comments
- Get configuration
- Get reporters
- Get tags
- Push case
- Set configuration
- Update cases
- Update comment
- Update configuration
- Import and export dashboard APIs
- Logstash configuration management APIs
- Machine learning APIs
- Osquery manager API
- Short URLs APIs
- Get Task Manager health
- Upgrade assistant APIs
- Kibana plugins
- Troubleshooting
- Accessibility
- Release notes
- Kibana 8.8.2
- Kibana 8.8.1
- Kibana 8.8.0
- Kibana 8.7.1
- Kibana 8.7.0
- Kibana 8.6.1
- Kibana 8.6.0
- Kibana 8.5.2
- Kibana 8.5.1
- Kibana 8.5.0
- Kibana 8.4.3
- Kibana 8.4.2
- Kibana 8.4.1
- Kibana 8.4.0
- Kibana 8.3.3
- Kibana 8.3.2
- Kibana 8.3.1
- Kibana 8.3.0
- Kibana 8.2.3
- Kibana 8.2.2
- Kibana 8.2.1
- Kibana 8.2.0
- Kibana 8.1.3
- Kibana 8.1.2
- Kibana 8.1.1
- Kibana 8.1.0
- Kibana 8.0.0
- Kibana 8.0.0-rc2
- Kibana 8.0.0-rc1
- Kibana 8.0.0-beta1
- Kibana 8.0.0-alpha2
- Kibana 8.0.0-alpha1
- Developer guide
Debug grok expressions
editDebug grok expressions
editYou can build and debug grok patterns in the Kibana Grok Debugger before you use them in your data processing pipelines. Grok is a pattern matching syntax that you can use to parse arbitrary text and structure it. Grok is good for parsing syslog, apache, and other webserver logs, mysql logs, and in general, any log format that is written for human consumption.
Grok patterns are supported in Elasticsearch runtime fields, the Elasticsearch grok ingest processor, and the Logstash grok filter. For syntax, see Grokking grok.
The Elastic Stack ships with more than 120 reusable grok patterns. For a complete list of patterns, see Elasticsearch grok patterns and Logstash grok patterns.
Because Elasticsearch and Logstash share the same grok implementation and pattern libraries, any grok pattern that you create in the Grok Debugger will work in both Elasticsearch and Logstash.
Get started
editThis example walks you through using the Grok Debugger. This tool is automatically enabled in Kibana.
If you’re using Elastic Stack security features, you must have the manage_pipeline
permission to use the Grok Debugger.
- Open the main menu, click Dev Tools, then click Grok Debugger.
-
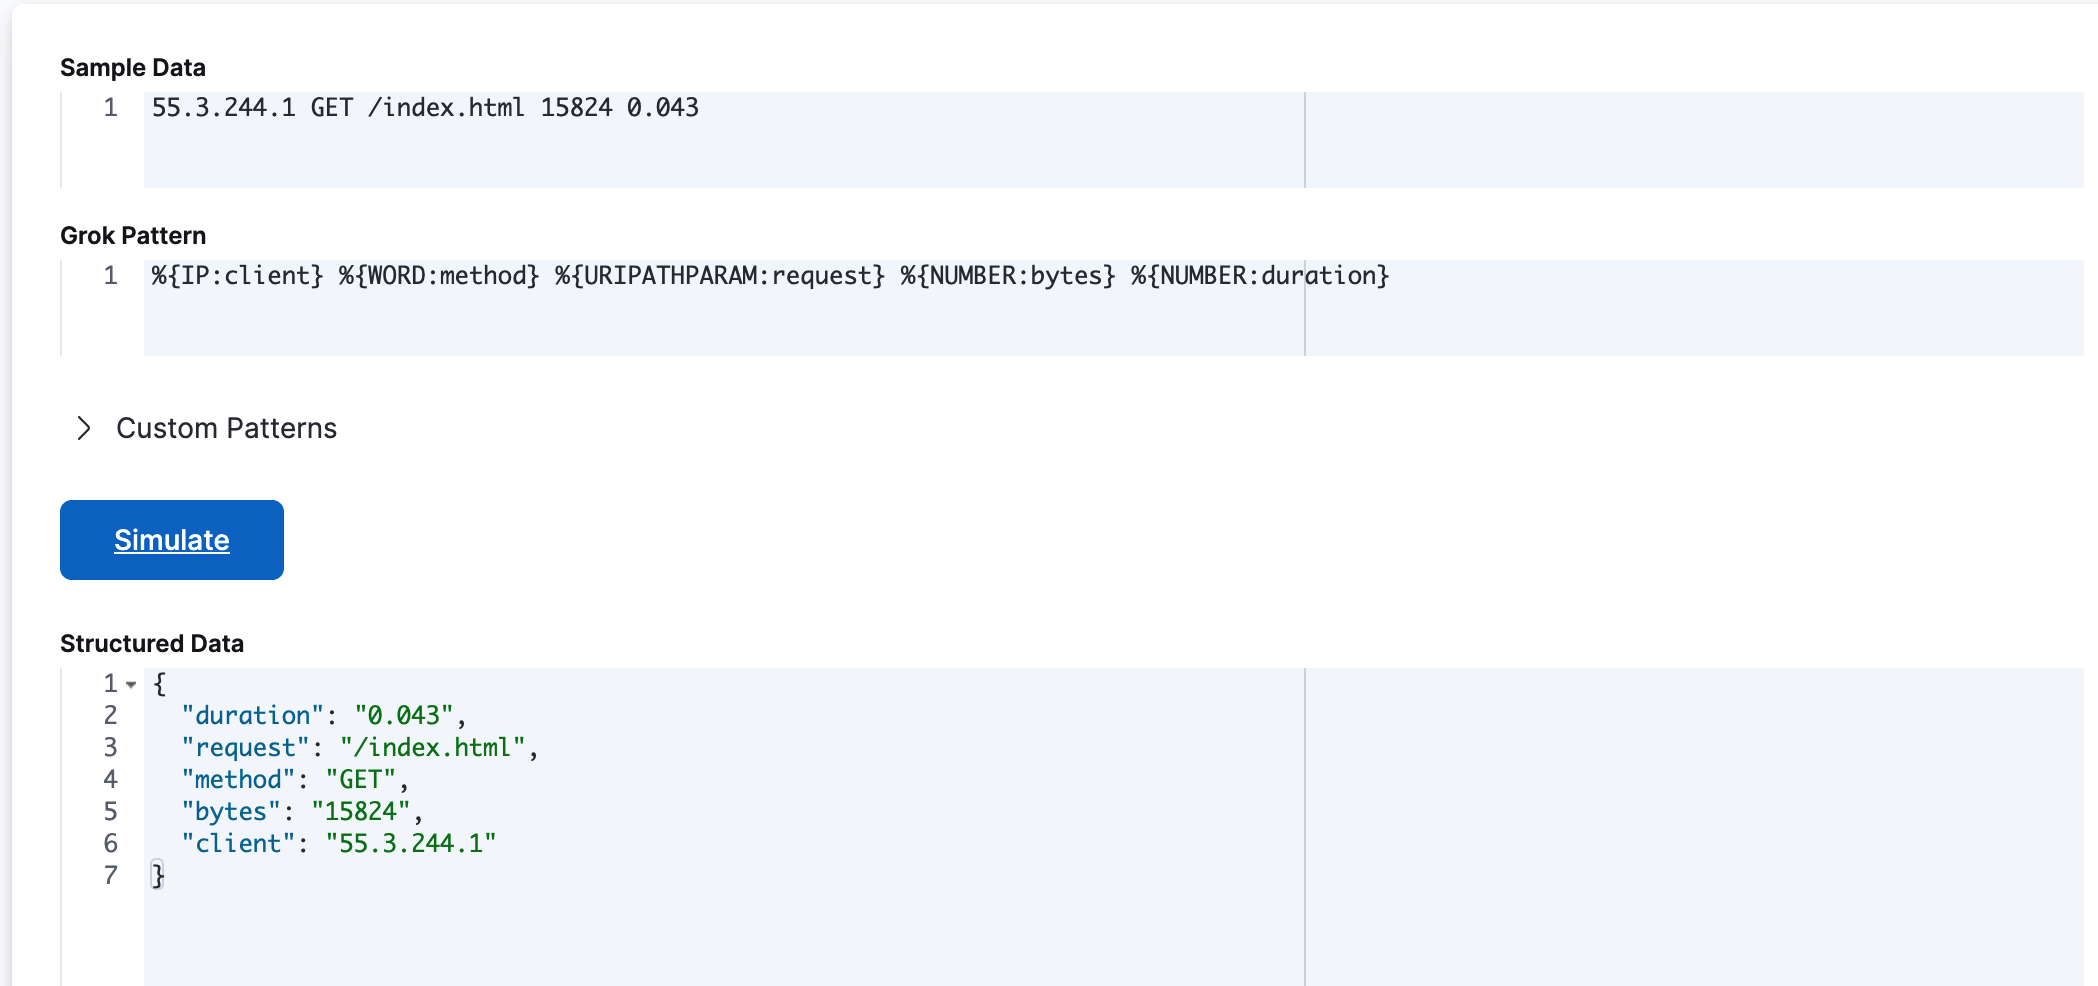
In Sample Data, enter a message that is representative of the data that you want to parse. For example:
55.3.244.1 GET /index.html 15824 0.043
-
In Grok Pattern, enter the grok pattern that you want to apply to the data.
To parse the log line in this example, use:
%{IP:client} %{WORD:method} %{URIPATHPARAM:request} %{NUMBER:bytes} %{NUMBER:duration}
-
Click Simulate.
You’ll see the simulated event that results from applying the grok pattern.

Test custom patterns
editIf the default grok pattern dictionary doesn’t contain the patterns you need, you can define, test, and debug custom patterns using the Grok Debugger.
Custom patterns that you enter in the Grok Debugger are not saved. Custom patterns are only available for the current debugging session and have no side effects.
Follow this example to define a custom pattern.
-
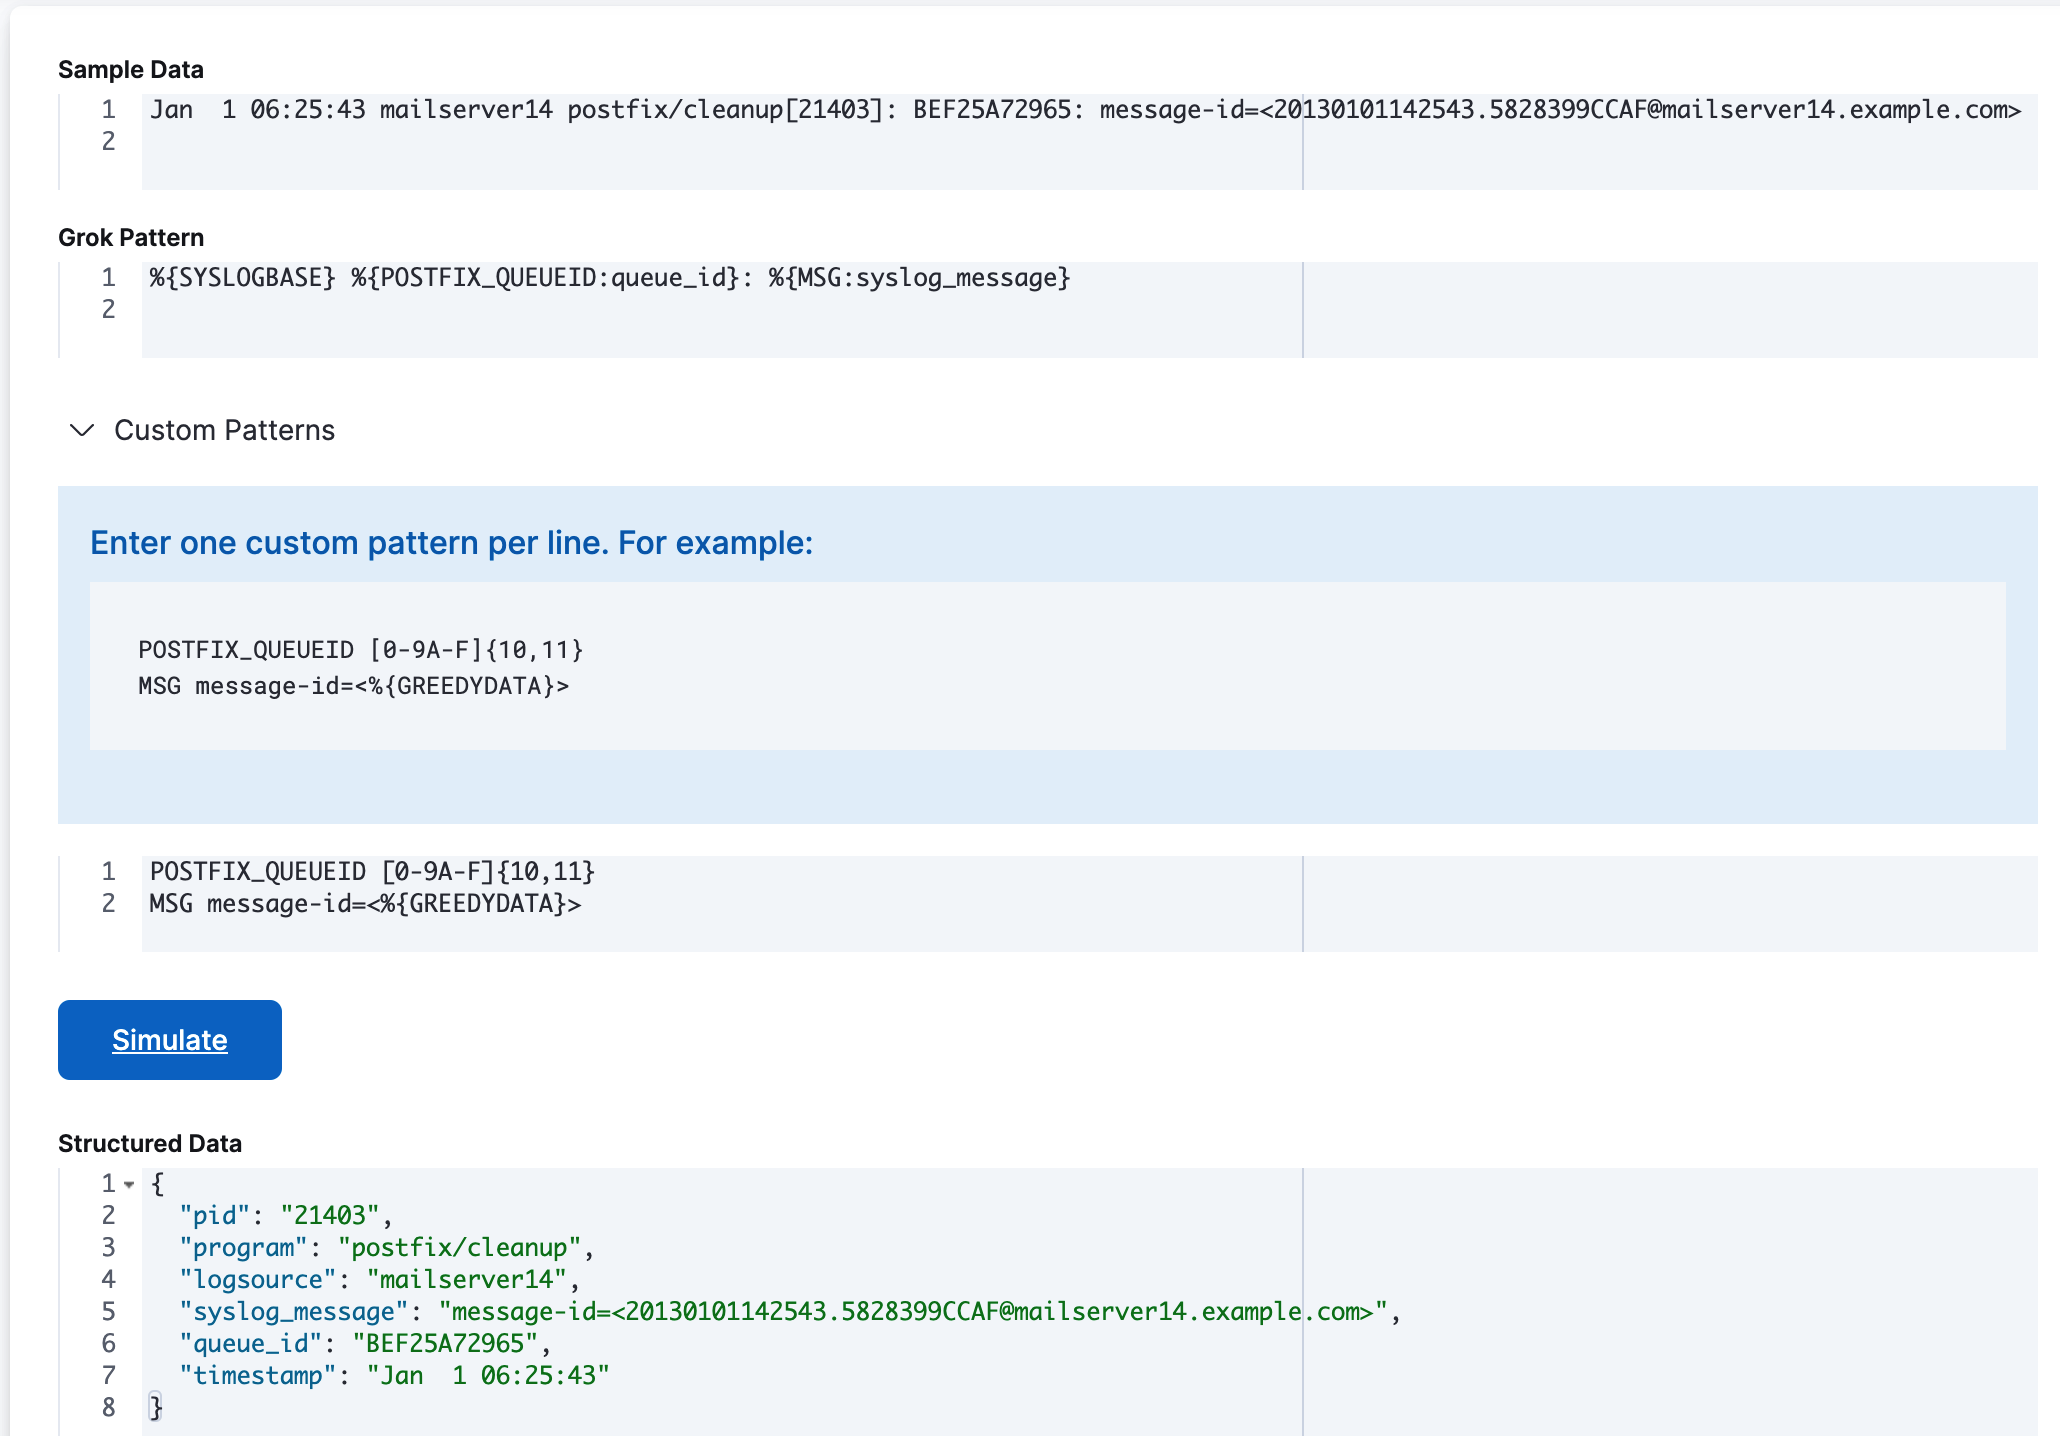
In Sample Data, enter the following sample message:
Jan 1 06:25:43 mailserver14 postfix/cleanup[21403]: BEF25A72965: message-id=<20130101142543.5828399CCAF@mailserver14.example.com>
-
Enter this grok pattern:
%{SYSLOGBASE} %{POSTFIX_QUEUEID:queue_id}: %{MSG:syslog_message}
Notice that the grok pattern references custom patterns called
POSTFIX_QUEUEIDandMSG. -
Expand Custom Patterns and enter pattern definitions for the custom patterns that you want to use in the grok expression. You must specify each pattern definition on its own line.
For this example, you must specify pattern definitions for
POSTFIX_QUEUEIDandMSG:POSTFIX_QUEUEID [0-9A-F]{10,11} MSG message-id=<%{GREEDYDATA}>
-
Click Simulate.
You’ll see the simulated output event that results from applying the grok pattern that contains the custom pattern:

If an error occurs, you can continue iterating over the custom pattern until the output matches the event that you expect.
On this page