- Kibana Guide: other versions:
- What is Kibana?
- What’s new in 8.8
- Kibana concepts
- Quick start
- Set up
- Install Kibana
- Configure Kibana
- Alerting and action settings
- APM settings
- Banners settings
- Cases settings
- Enterprise Search settings
- Fleet settings
- i18n settings
- Logging settings
- Logs settings
- Metrics settings
- Monitoring settings
- Reporting settings
- Search sessions settings
- Secure settings
- Security settings
- Spaces settings
- Task Manager settings
- Telemetry settings
- URL drilldown settings
- Start and stop Kibana
- Access Kibana
- Securing access to Kibana
- Add data
- Upgrade Kibana
- Configure security
- Configure reporting
- Configure logging
- Configure monitoring
- Command line tools
- Production considerations
- Discover
- Dashboard and visualizations
- Canvas
- Maps
- Build a map to compare metrics by country or region
- Track, visualize, and alert on assets in real time
- Map custom regions with reverse geocoding
- Heat map layer
- Tile layer
- Vector layer
- Plot big data
- Search geographic data
- Configure map settings
- Connect to Elastic Maps Service
- Import geospatial data
- Troubleshoot
- Reporting and sharing
- Machine learning
- Graph
- Alerting
- Observability
- APM
- Security
- Dev Tools
- Fleet
- Osquery
- Stack Monitoring
- Stack Management
- REST API
- Get features API
- Kibana spaces APIs
- Kibana role management APIs
- User session management APIs
- Saved objects APIs
- Data views API
- Index patterns APIs
- Alerting APIs
- Action and connector APIs
- Cases APIs
- Add comment
- Create case
- Delete cases
- Delete comments
- Find case activity
- Find cases
- Find connectors
- Get alerts
- Get case activity
- Get case
- Get case status
- Get cases by alert
- Get comments
- Get configuration
- Get reporters
- Get tags
- Push case
- Set configuration
- Update cases
- Update comment
- Update configuration
- Import and export dashboard APIs
- Logstash configuration management APIs
- Machine learning APIs
- Osquery manager API
- Short URLs APIs
- Get Task Manager health
- Upgrade assistant APIs
- Kibana plugins
- Troubleshooting
- Accessibility
- Release notes
- Kibana 8.8.2
- Kibana 8.8.1
- Kibana 8.8.0
- Kibana 8.7.1
- Kibana 8.7.0
- Kibana 8.6.1
- Kibana 8.6.0
- Kibana 8.5.2
- Kibana 8.5.1
- Kibana 8.5.0
- Kibana 8.4.3
- Kibana 8.4.2
- Kibana 8.4.1
- Kibana 8.4.0
- Kibana 8.3.3
- Kibana 8.3.2
- Kibana 8.3.1
- Kibana 8.3.0
- Kibana 8.2.3
- Kibana 8.2.2
- Kibana 8.2.1
- Kibana 8.2.0
- Kibana 8.1.3
- Kibana 8.1.2
- Kibana 8.1.1
- Kibana 8.1.0
- Kibana 8.0.0
- Kibana 8.0.0-rc2
- Kibana 8.0.0-rc1
- Kibana 8.0.0-beta1
- Kibana 8.0.0-alpha2
- Kibana 8.0.0-alpha1
- Developer guide
Storage explorer
editStorage explorer
editThis functionality is in beta and is subject to change. The design and code is less mature than official GA features and is being provided as-is with no warranties. Beta features are not subject to the support SLA of official GA features.
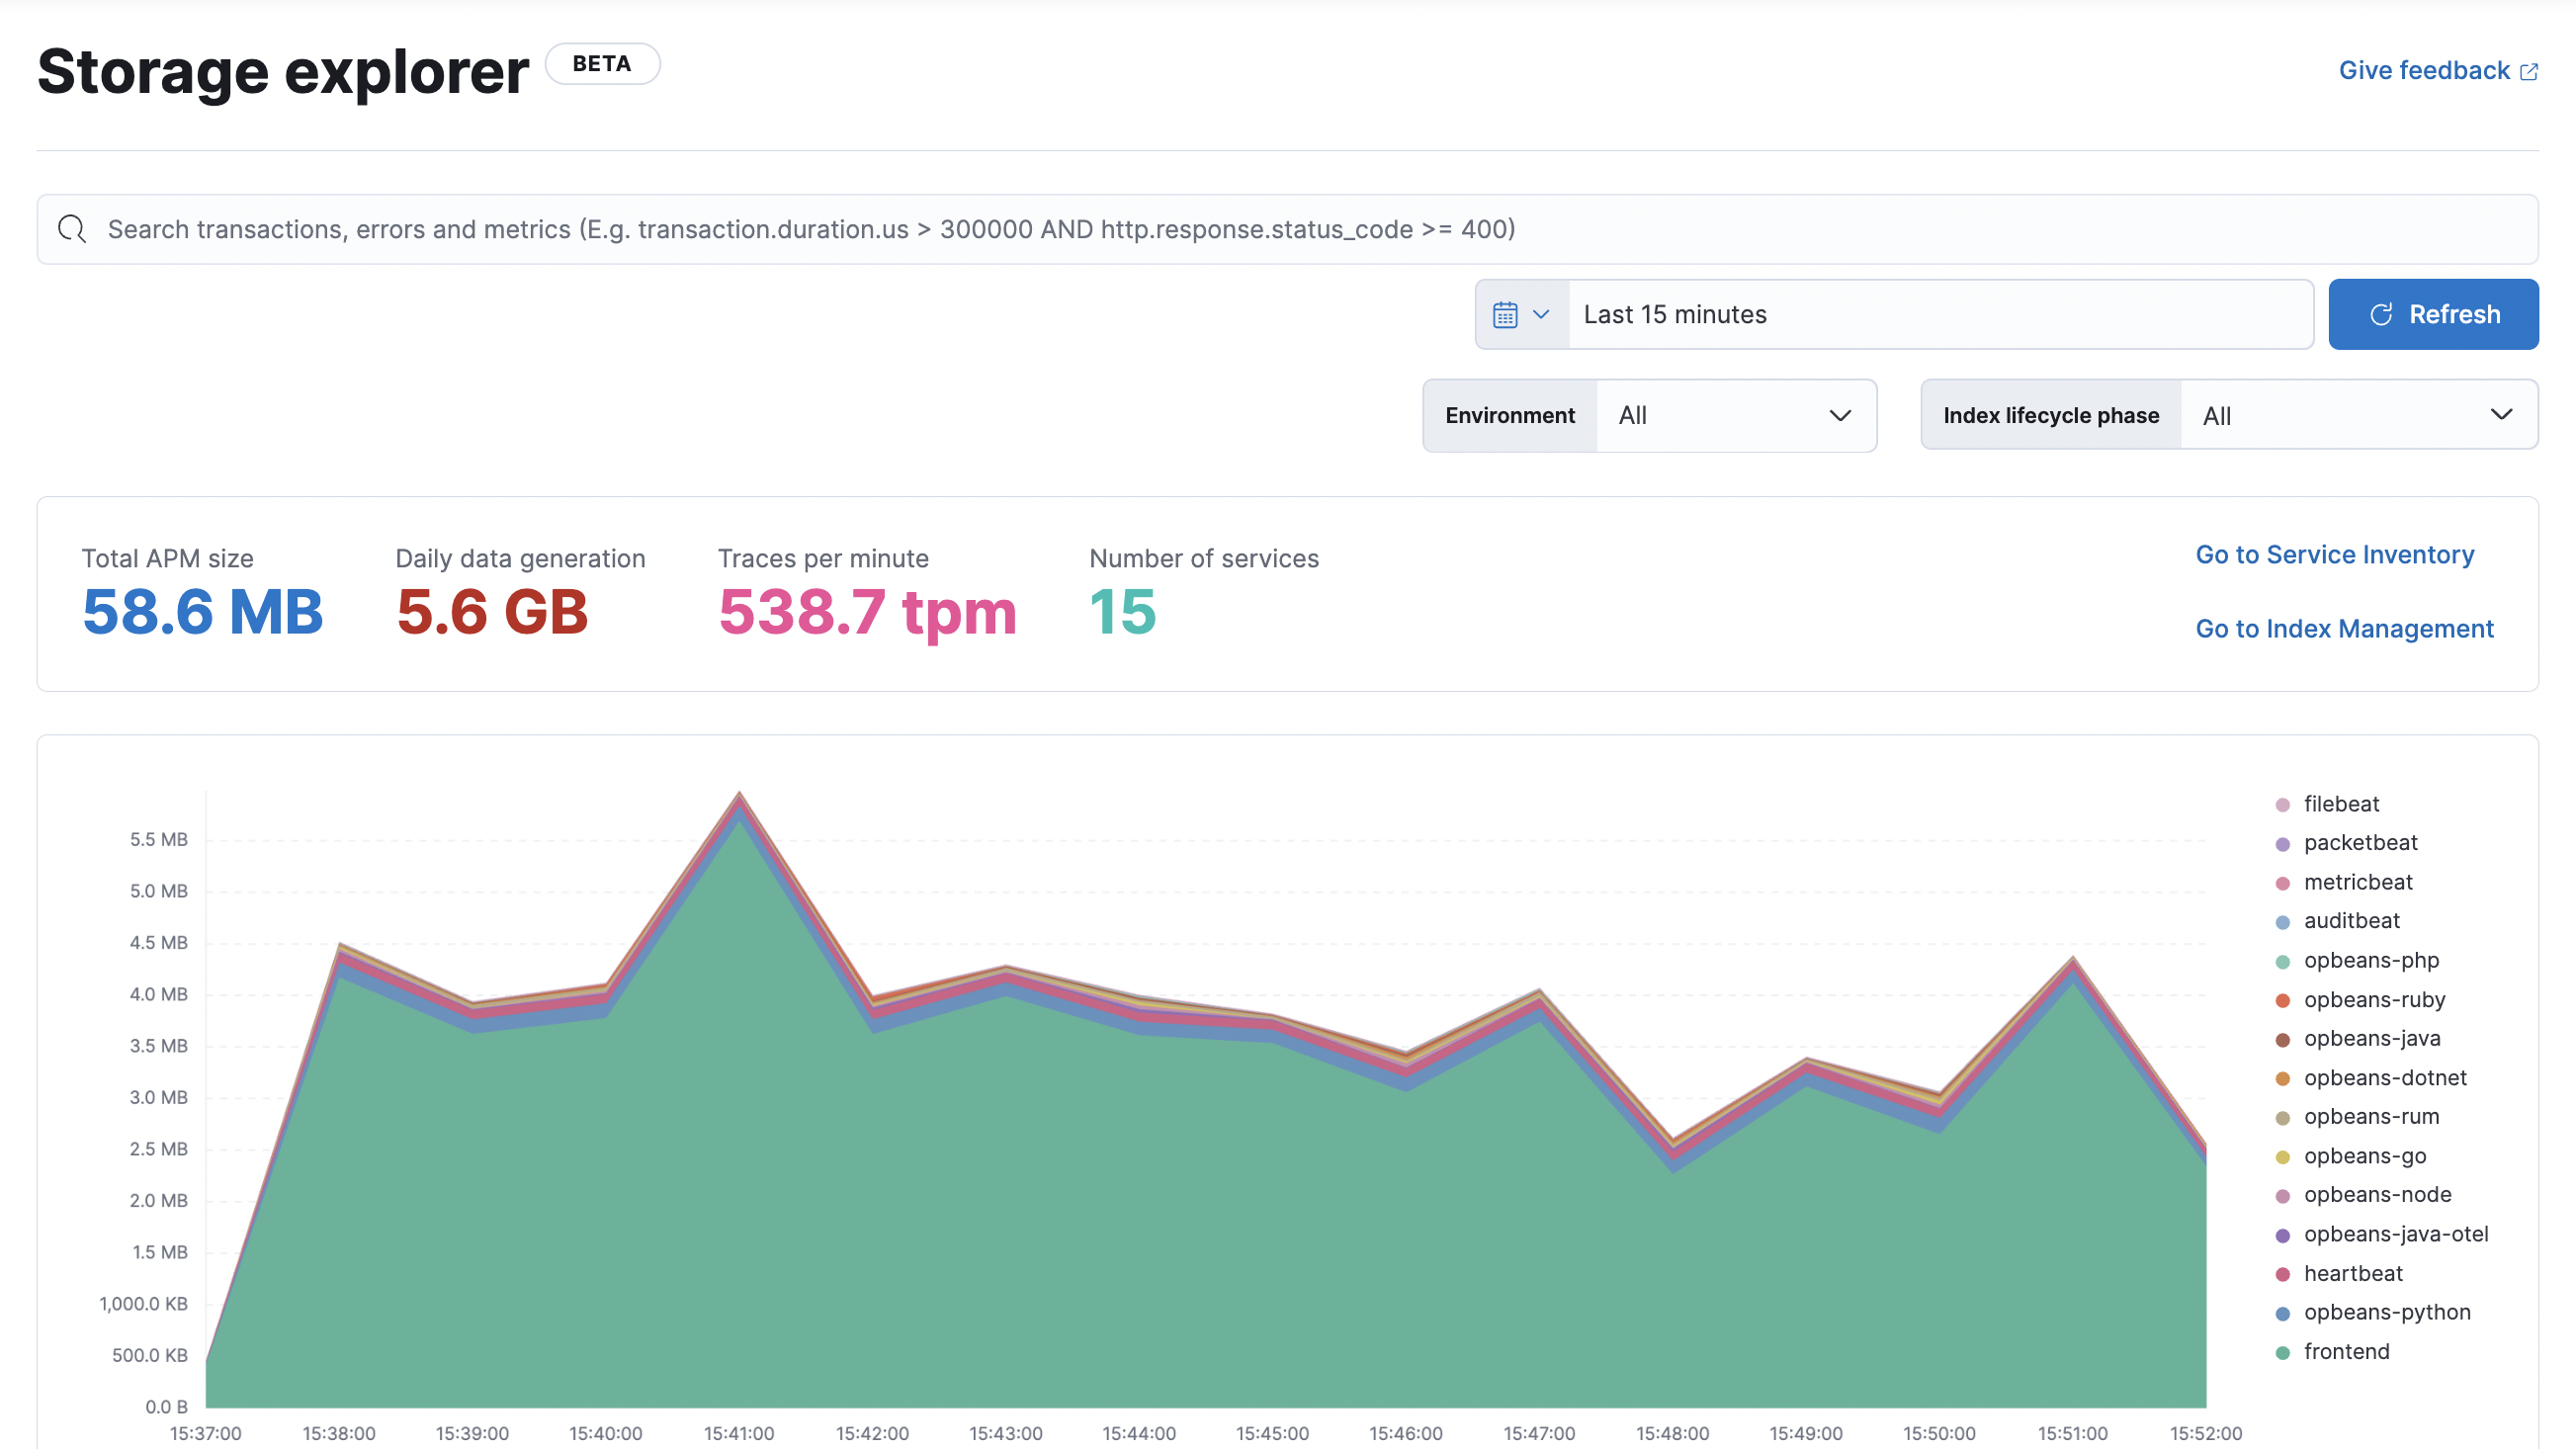
Analyze your APM data and manage costs with storage explorer. For example, analyze the storage footprint of each of your services to see which are producing large amounts of data—then change the sample rate of a service to lower the amount of data ingested. Or, expand the time filter to visualize data trends over time so that you can better forecast and prepare for future storage needs.

Index lifecycle phases
editA default index lifecycle policy is applied to each APM data stream, but can be customized depending on your business needs. Use the Index lifecycle phase dropdown to visualize and analyze your storage by phase.
Customizing the default APM index lifecycle policies can save money by specifying things like:
- The point at which an index can be moved to less performant hardware.
- The point at which availability is not as critical and the number of replicas can be reduced.
- When the index can be safely deleted.
See Index lifecycle management to learn more about customizing the default APM index lifecycle policies.
Service size chart
editThe service size chart displays the estimated size of each service over time. Expand the time filter to visualize data trends and estimate daily data generation.
Service statistics table
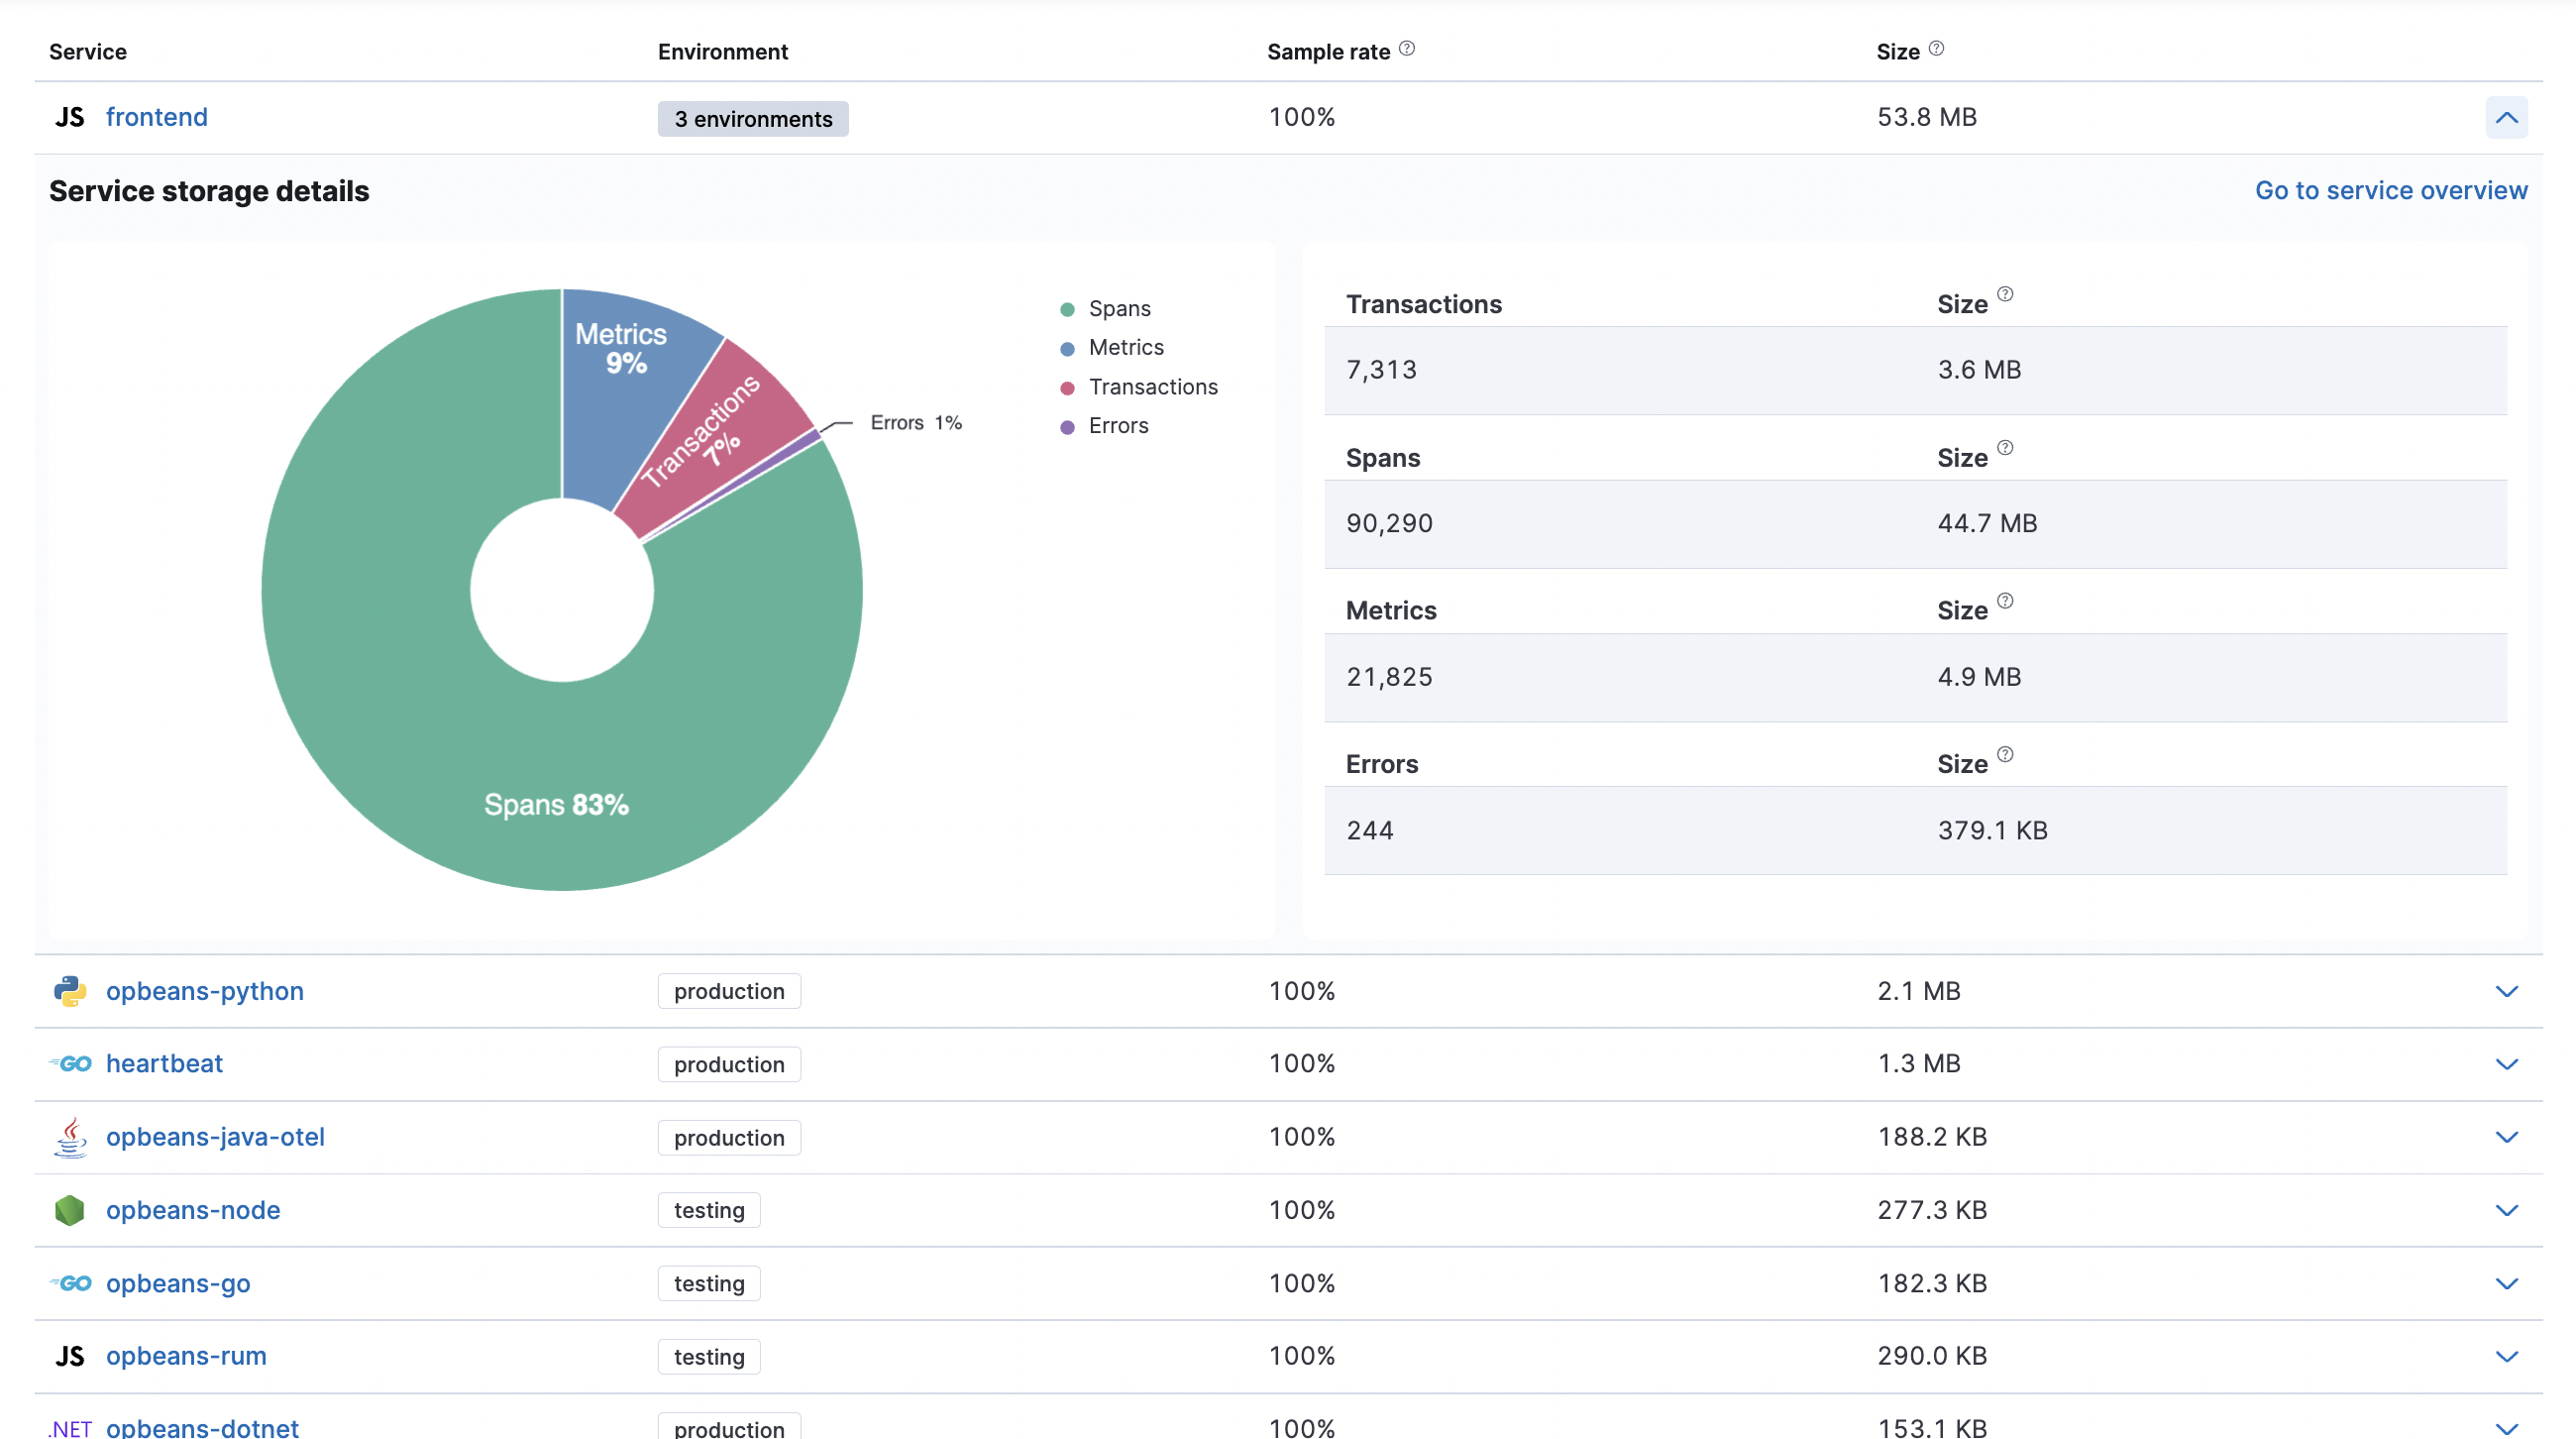
editThe service statistics table provides detailed information on each service:
- A list of service environments.
- The sampling rate. This value is calculated by dividing the number of sampled transactions by total throughput. It might differ from the configured sampling rate for two reasons: with head-based sampling, the initial service makes the sampling decision, and with tail-based sampling, granular policies allow you to set multiple sample rates.
- The estimated size on disk. This storage size includes both primary and replica shards and is calculated by prorating the total size of your indices by the service’s document count divided by the total number of documents.
- Number of transactions, spans, errors, and metrics — doc count and size on disk.

As you explore your service statistics, you might want to take action to reduce the number of documents and therefore storage size of a particular service.
Reduce the number of transactions
editTo reduce the number of transactions a service generates, configure a more aggressive transaction sampling policy. Transaction sampling lowers the amount of data ingested without negatively impacting the usefulness of your data.
Reduce the number of spans
editTo reduce the number of spans a service generates, enable span compression. Span compression saves on data and transfer costs by compressing multiple, similar spans into a single span.
Reduce the number of metrics
editTo reduce the number of system, runtime, and application metrics, tune the APM agent or agents that are collecting the data. You can disable the collection of specific metrics with the disable metrics configuration. Or, you can set the metrics interval to zero seconds to deactivate metrics entirely. Most APM agents support both options. See the relevant APM agent configuration options for more details.
Reduce the number of errors
editTo reduce the number of errors a service generate, work with your developers to change how exceptions are handled in your code.
Privileges
editStorage explorer requires expanded privileges to view. See Create a storage explorer user for more information.
Limitations
editMulti-cluster deployments are not supported.
On this page