Quick start
editQuick start
editTo quickly get up and running with Kibana, set up on Cloud, then add a sample data set that you can explore and analyze.
When you’ve finished, you’ll know how to:
Required privileges
editWhen security is enabled, you must have read, write, and manage privileges on the kibana_sample_data_* indices.
Learn how to secure access to Kibana, or refer to Security privileges for more information.
Set up on cloud
editThere’s no faster way to get started than with Elastic Cloud:
- Sign up for a free trial.
- Follow the on-screen steps to create your first project.
That’s it! You’re ready to get some data into your project.
Add the sample data
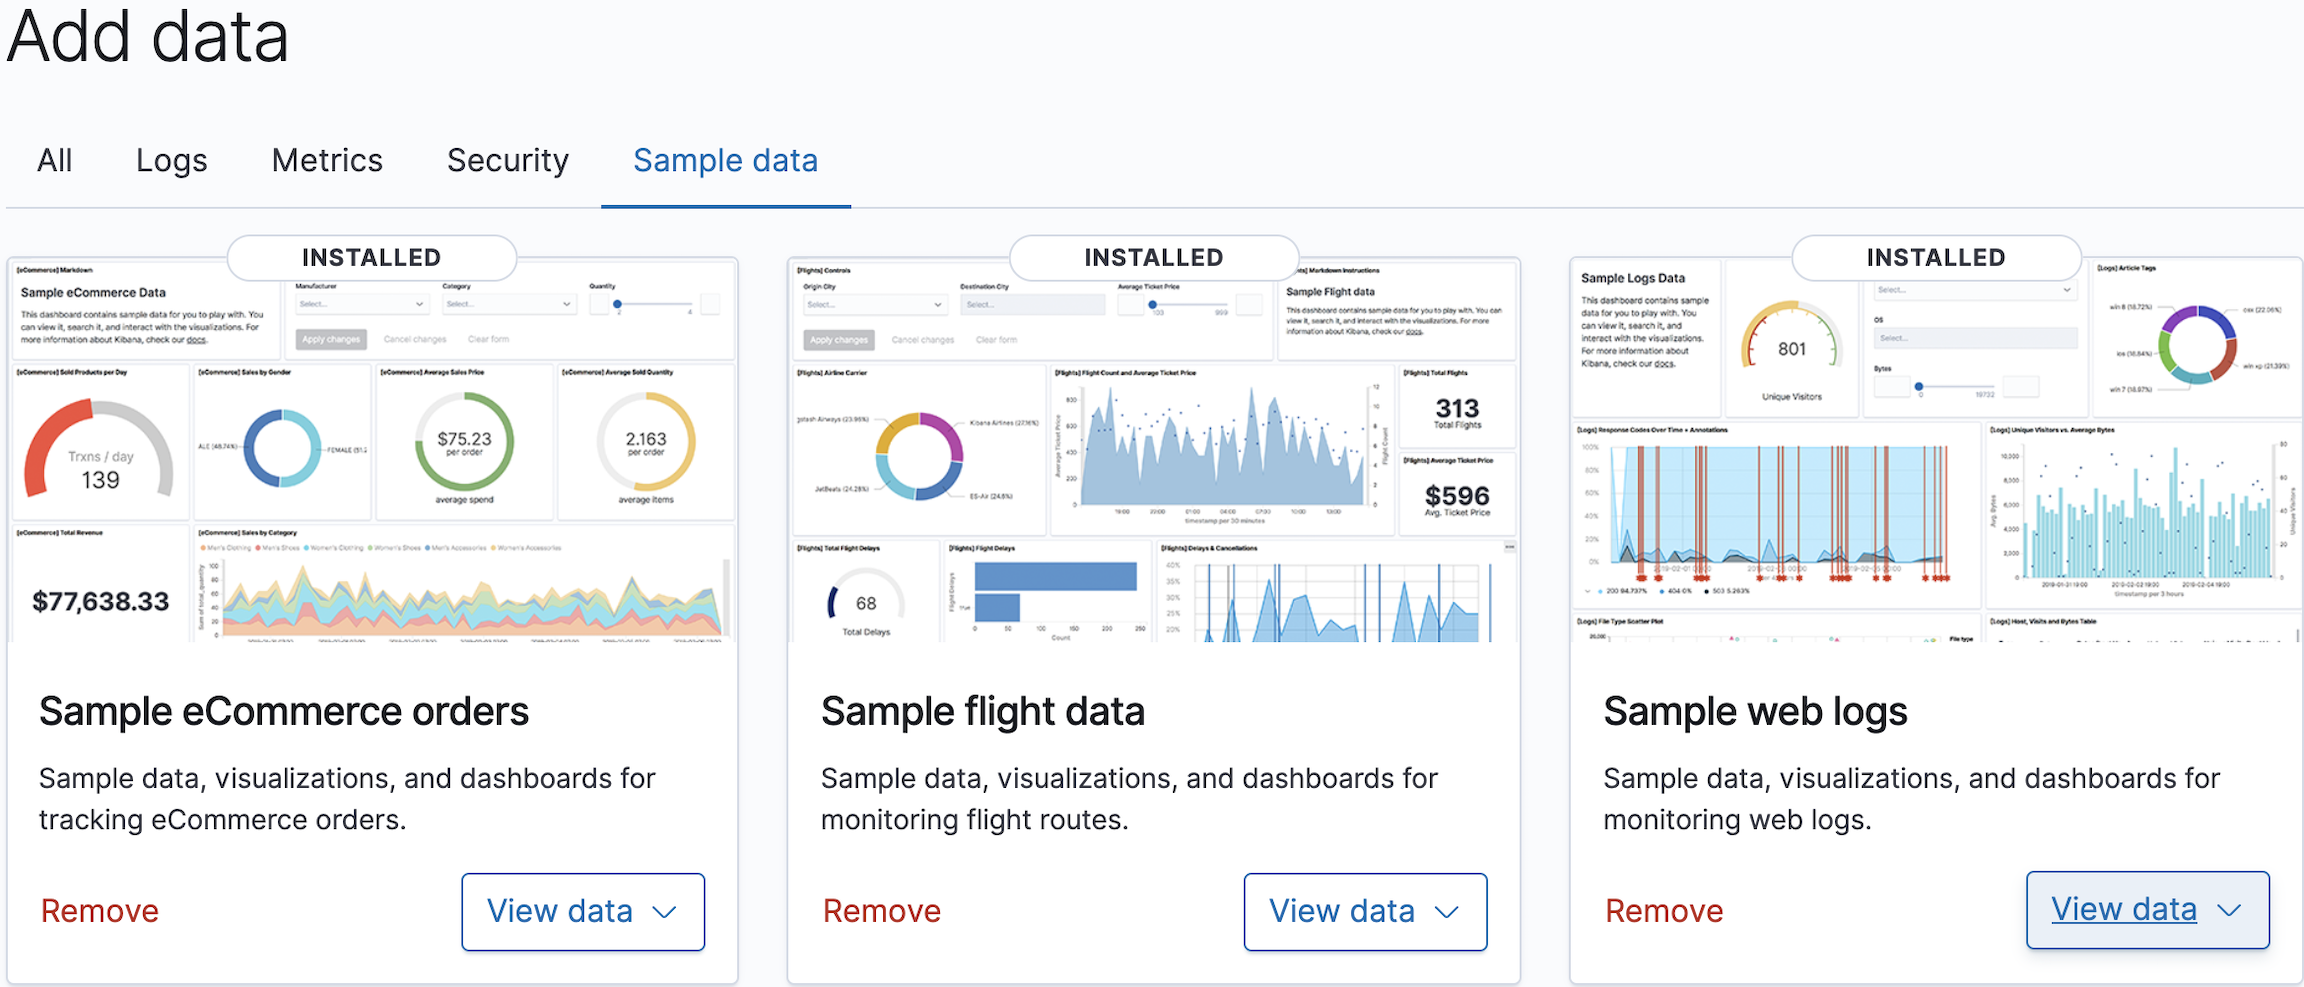
editSample data sets come with sample visualizations, dashboards, and more to help you explore Kibana without adding your own data.
- From the home page, click Try our sample data.
-
On the Sample eCommerce orders card, click Add data.
Explore the data
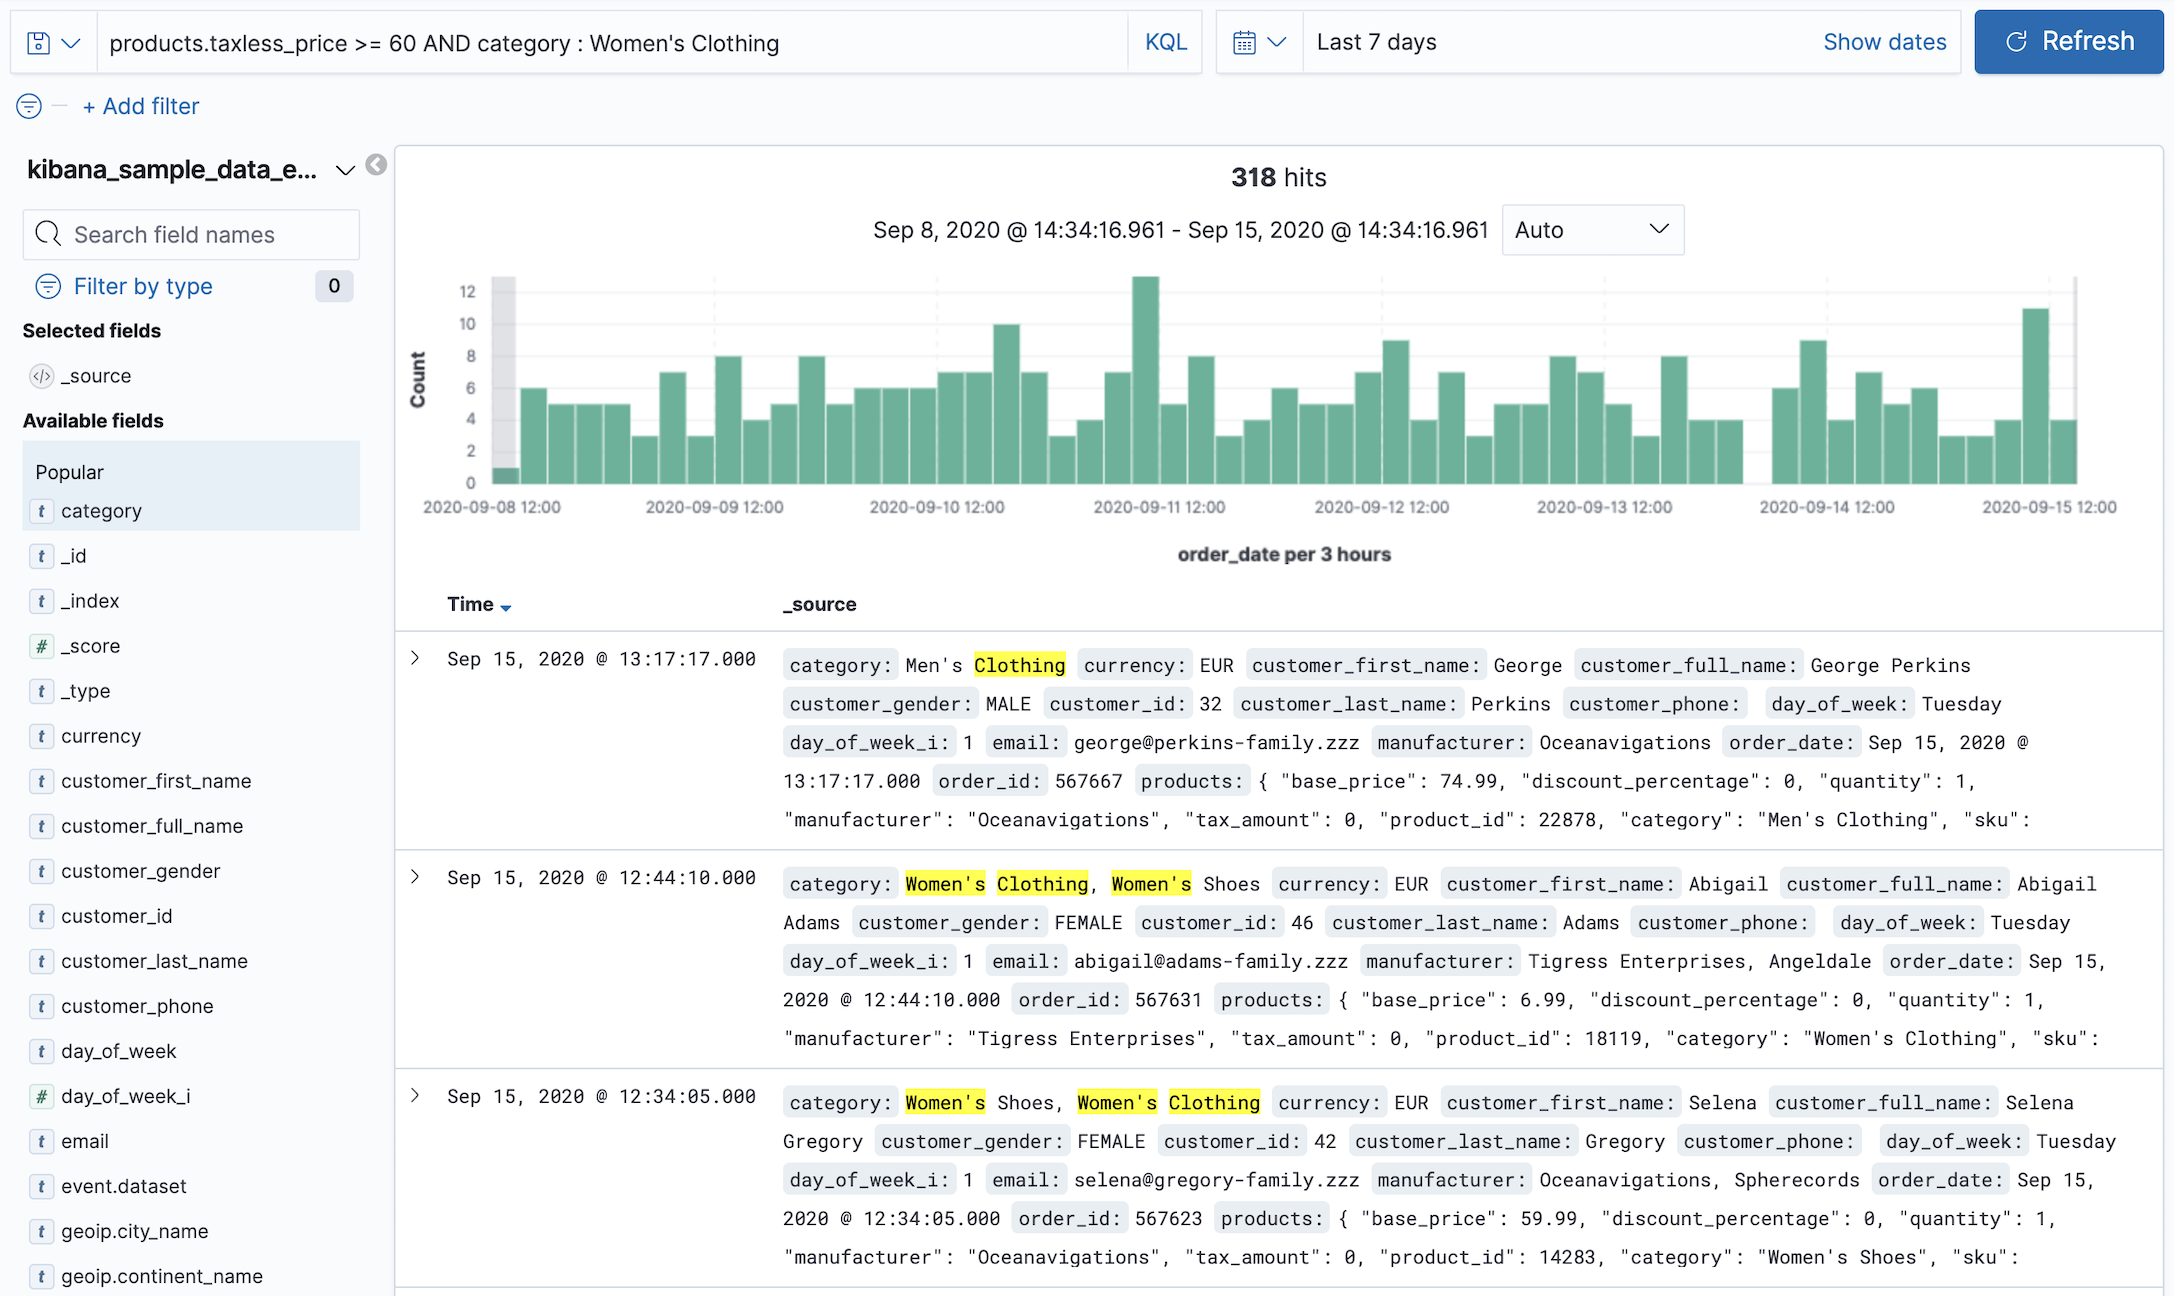
editDiscover displays an interactive histogram that shows the distribution of of data, or documents, over time, and a table that lists the fields for each document that matches the index. By default, all fields are shown for each matching document.
- Open the main menu, then click Discover.
-
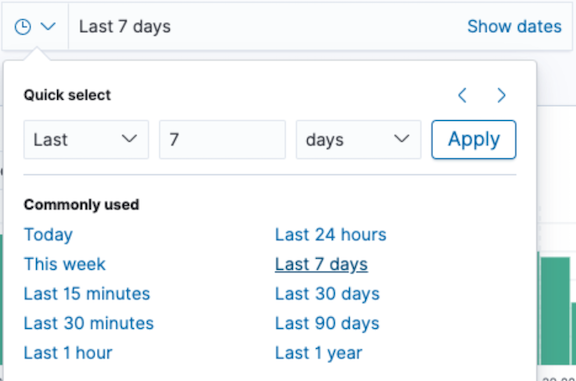
Change the time filter to Last 7 days.
-
To focus in on the documents you want to view, use the Kibana Query Language. In the KQL search field, enter:
products.taxless_price >= 60 AND category : Women's Clothing
The query returns the women’s clothing orders for $60 and more.
-
Hover over the list of Available fields, then click + next to the fields you want to view in the table.
For example, when you add the category field, the table displays the product categories for the orders.
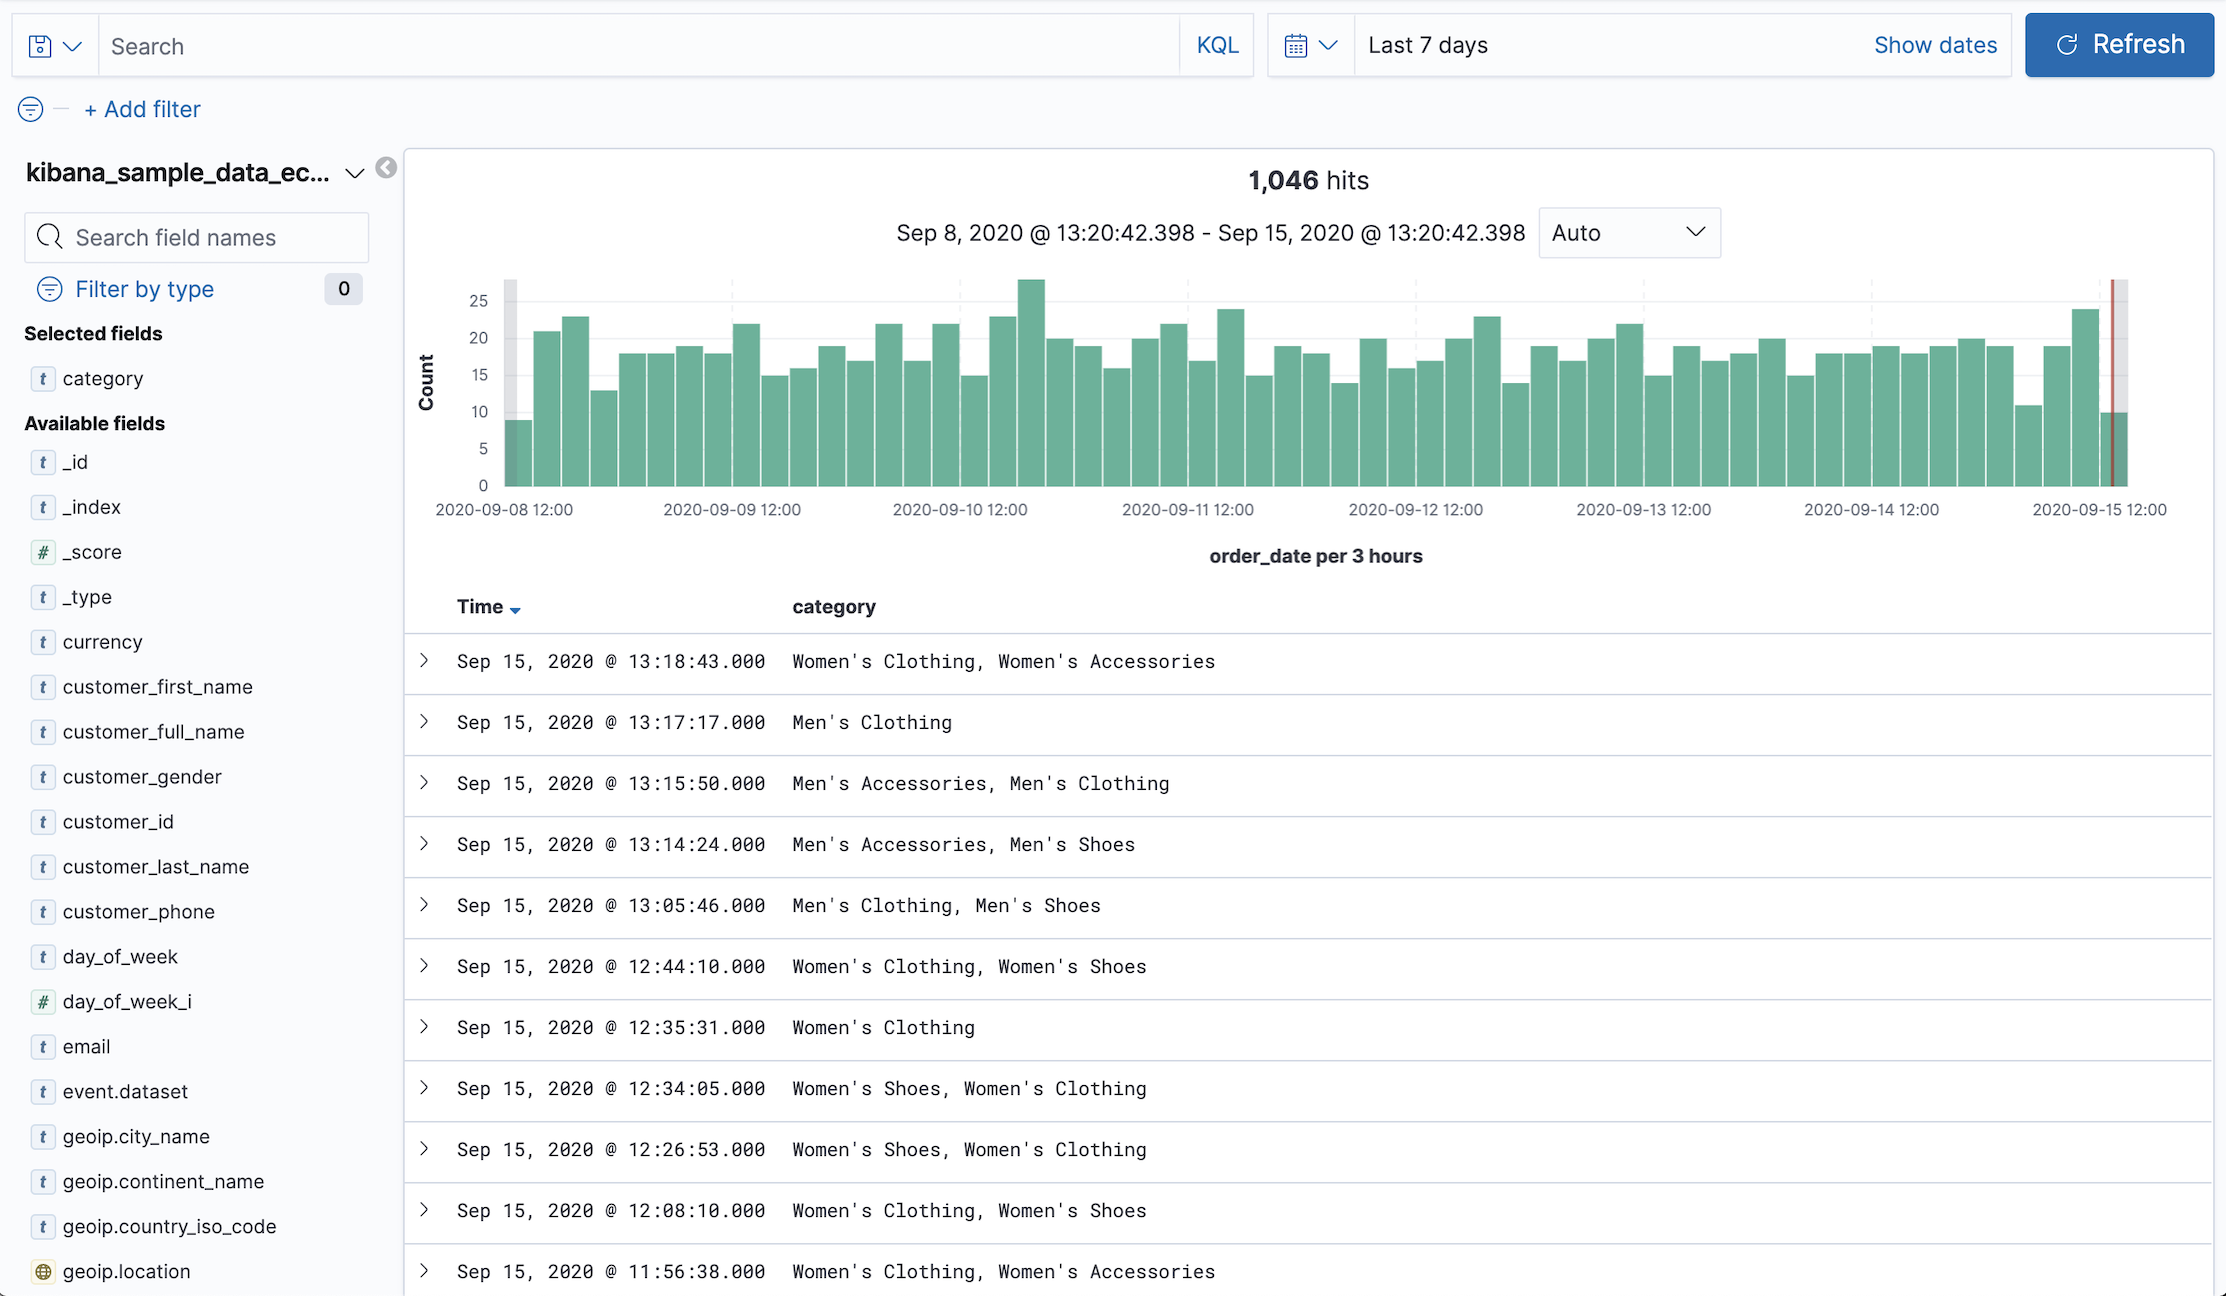
For more information, refer to Discover.
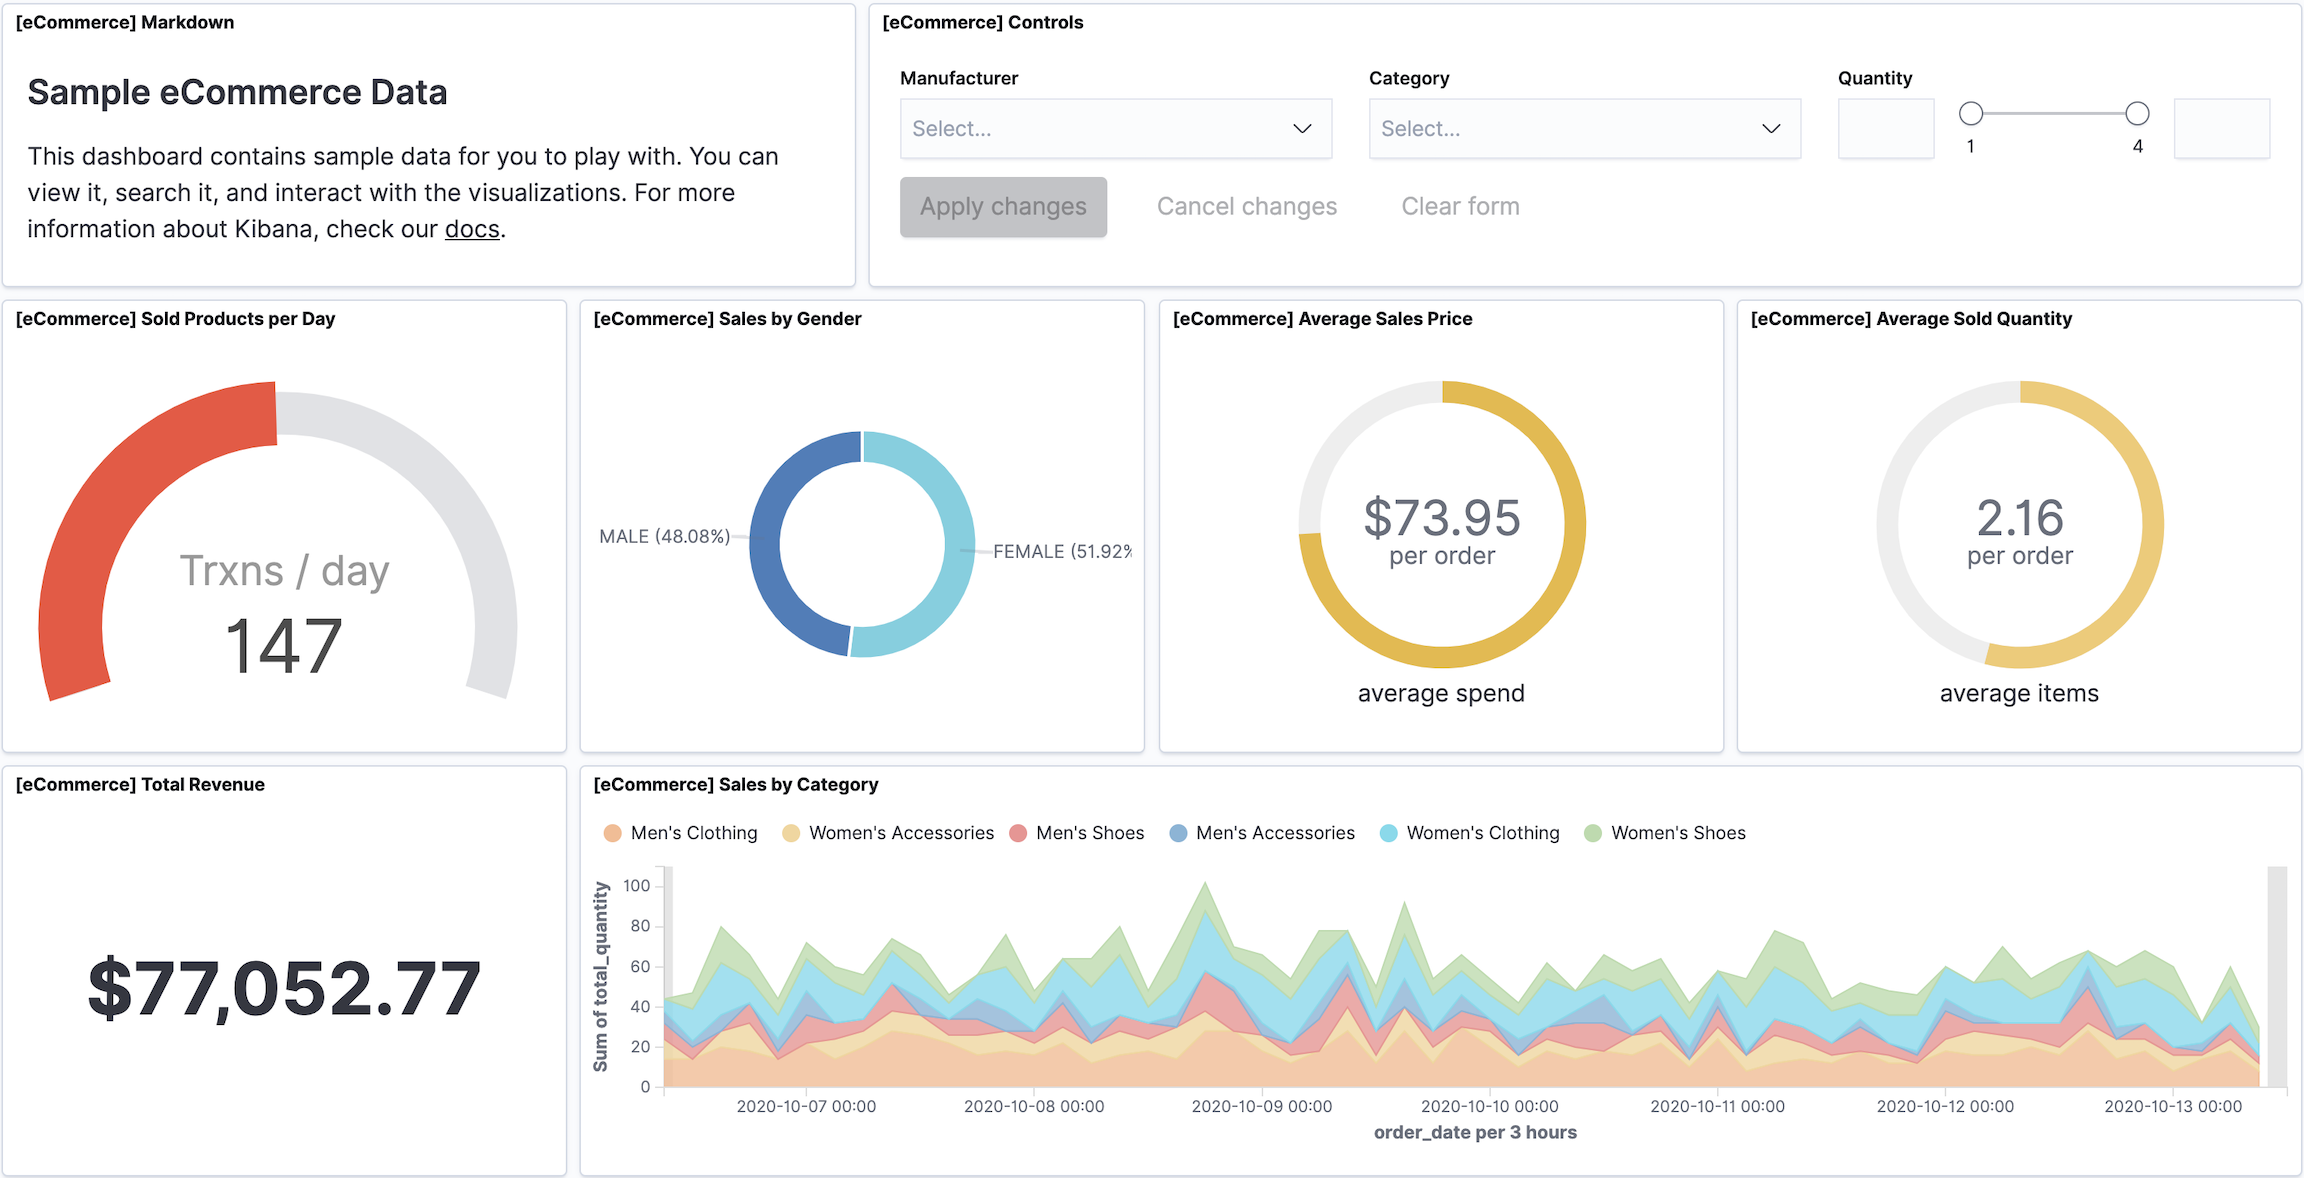
View and analyze the data
editA dashboard is a collection of panels that you can use to view and analyze the data. Panels contain visualizations, interactive controls, Markdown, and more.
- Open the main menu, then click Dashboard.
-
Click [eCommerce] Revenue Dashboard.
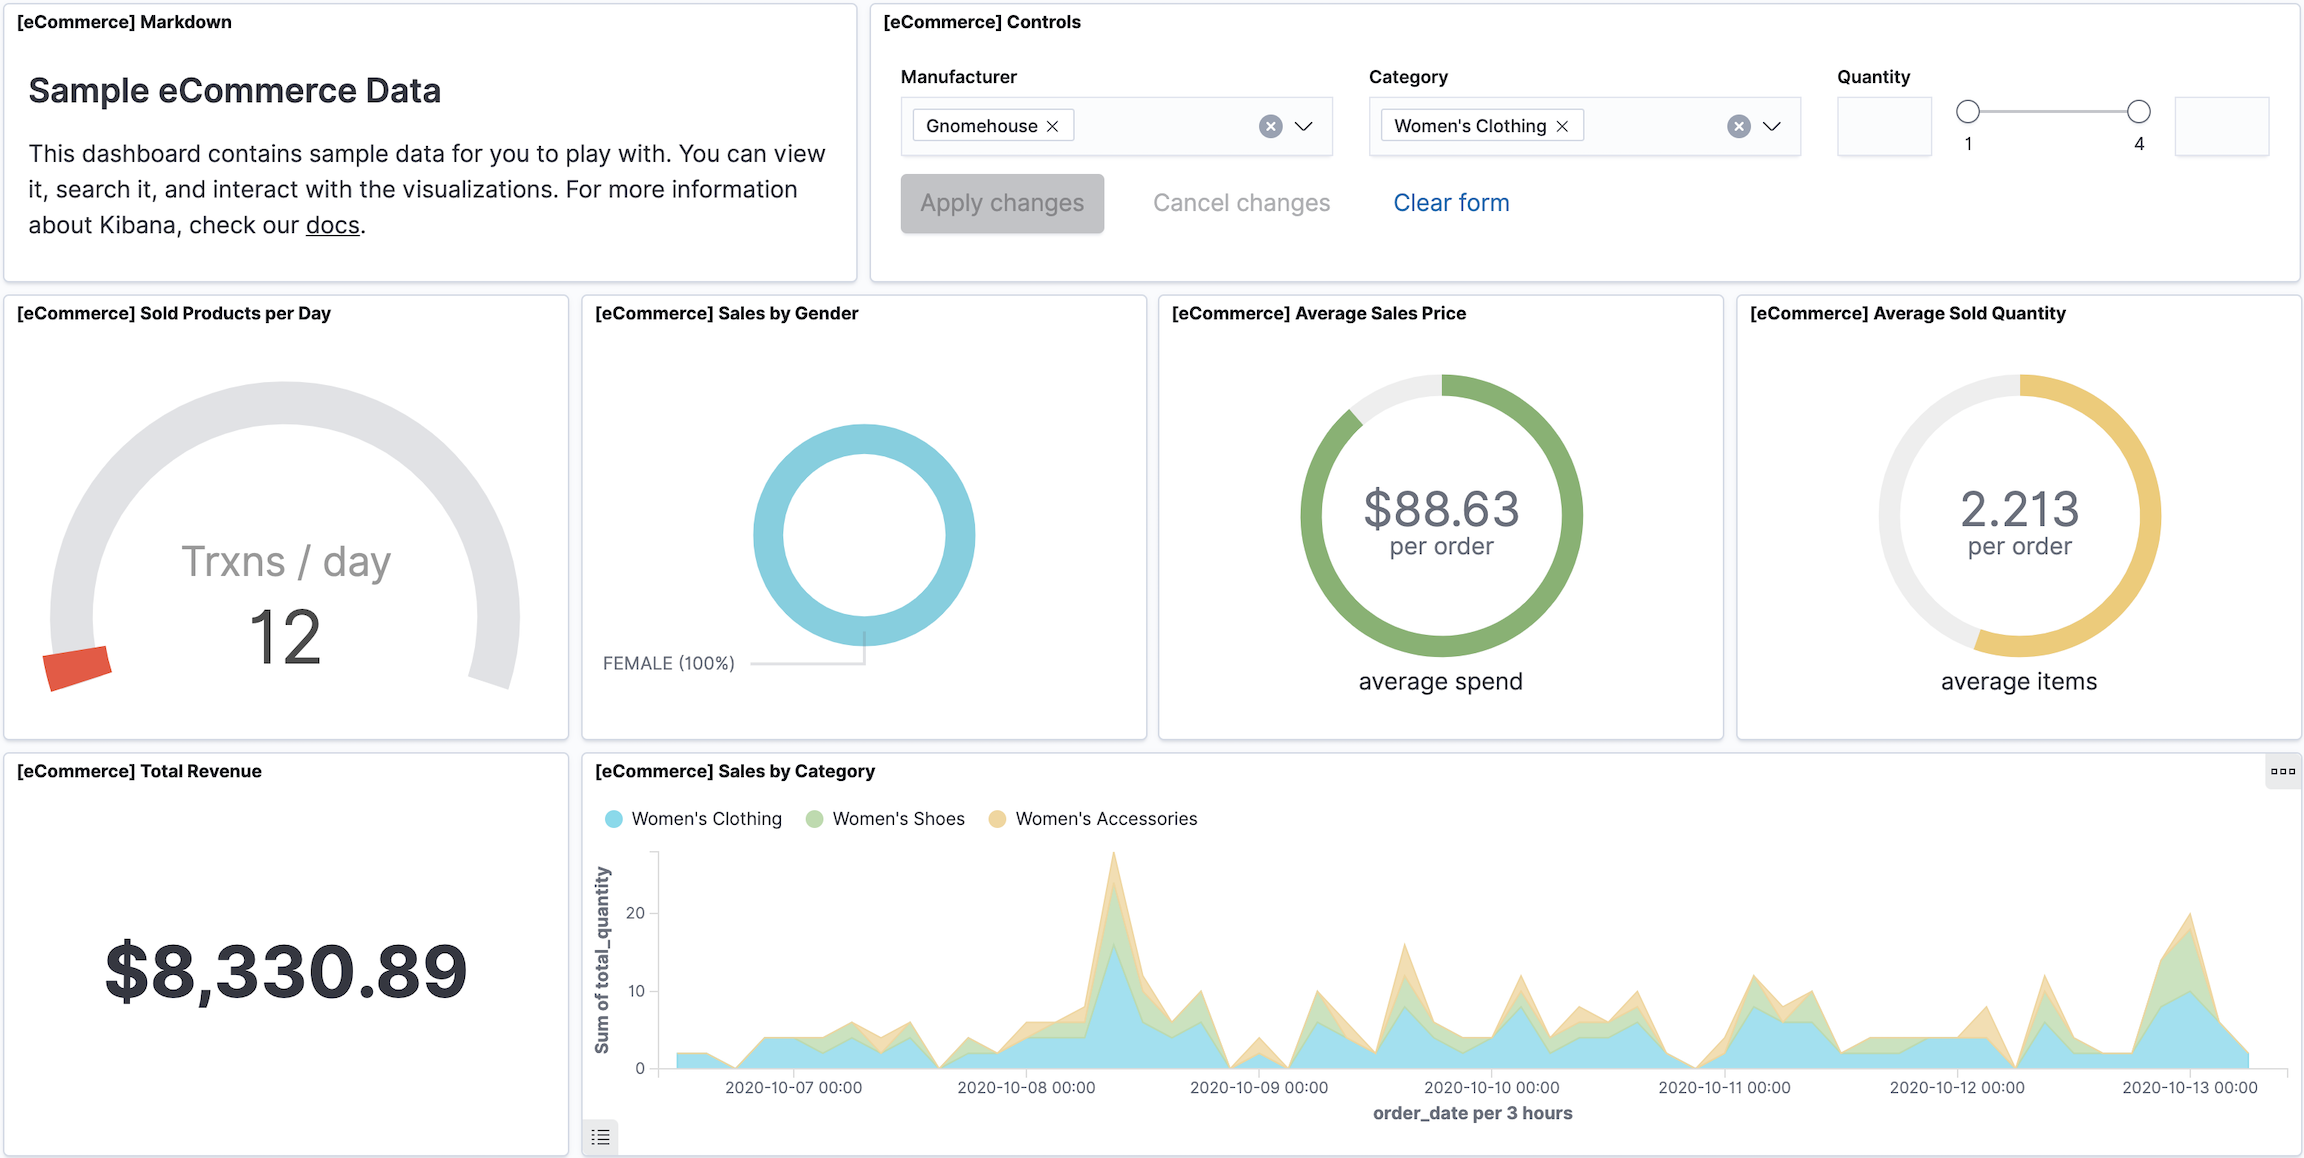
Filter the data
editTo focus in on the data you want to view on the dashboard, use filters.
-
From the [eCommerce] Controls panel, make a selection from the Manufacturer and Category dropdowns, then click Apply changes.
For example, the following dashboard shows the data for women’s clothing from Gnomehouse.
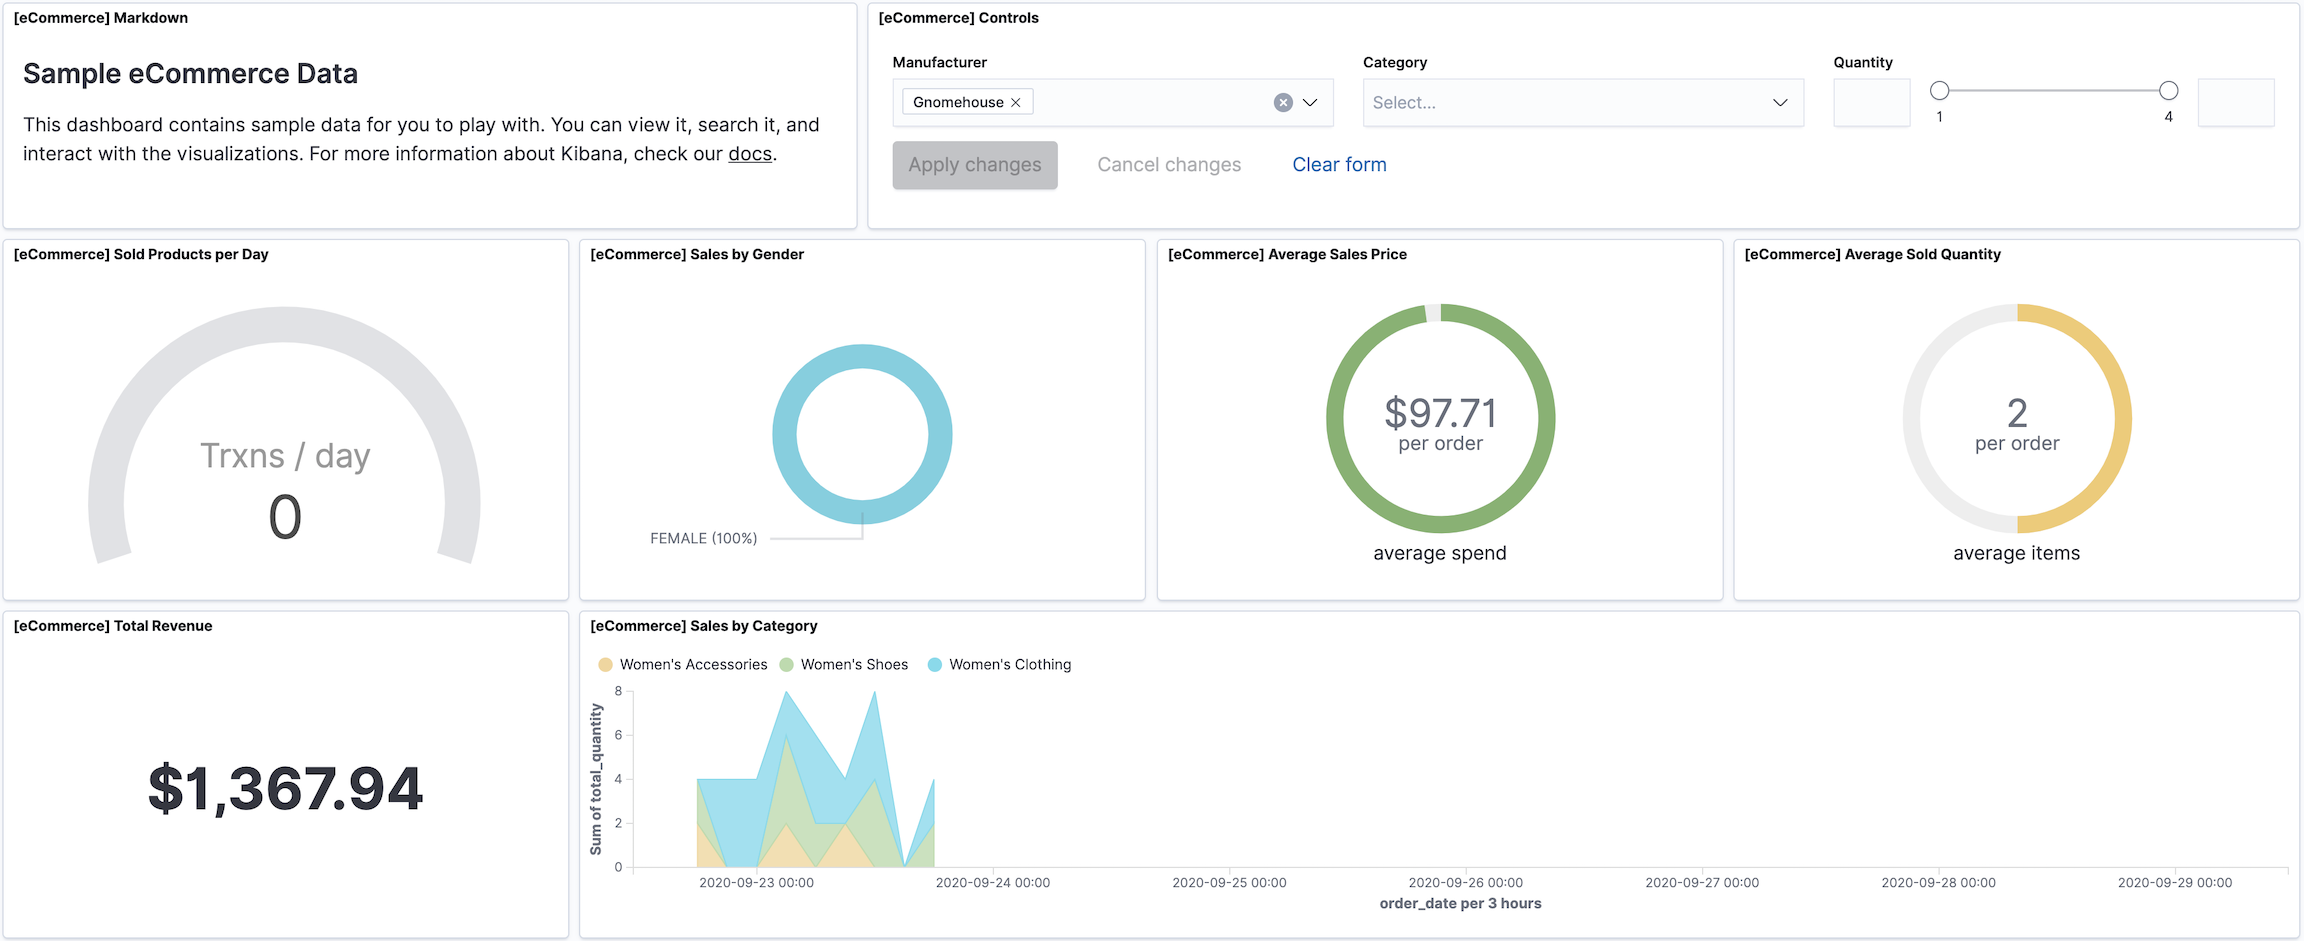
-
To manually add a filter, click Add filter, then specify the options.
For example, to view the orders for Wednesday, select day_of_week from the Field dropdown, select is from the Operator dropdown, then select Wednesday from the Value dropdown.
-
When you are done, remove the filters.
For more information, refer to Dashboard.
Create a visualization panel
editTo create a treemap panel that shows the top regions and manufacturers, use Lens, then add the treemap panel to the dashboard.
- From the toolbar, click Edit, then click Create new.
- On the New Visualization window, click Lens.
-
From the Available fields list, drag and drop the following fields to the visualization builder:
- geoip.city_name
- manufacturer.keyword
-
From the visualization dropdown, select Treemap.
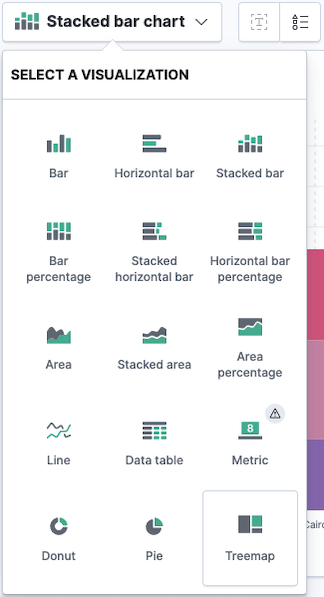
- Click Save.
-
On the Save Lens visualization, enter a title and make sure Add to Dashboard after saving is selected, then click Save and return.
The treemap appears as the last visualization panel on the dashboard.
For more information, refer to Lens.
What’s next?
editIf you are you ready to add your own data, refer to Add data to Kibana.
If you want to ingest your data, refer to Quick start: Get logs and metrics into the Elastic Stack.
If you want to secure access to your data, refer to our guide on securing Kibana