- Observability: other versions:
- Get started
- What is Elastic Observability?
- What’s new in 8.17
- Quickstart: Monitor hosts with Elastic Agent
- Quickstart: Monitor your Kubernetes cluster with Elastic Agent
- Quickstart: Monitor hosts with OpenTelemetry
- Quickstart: Unified Kubernetes Observability with Elastic Distributions of OpenTelemetry (EDOT)
- Quickstart: Collect data with AWS Firehose
- Add data from Splunk
- Applications and services
- Application performance monitoring (APM)
- Get started
- Learn about data types
- Collect application data
- View and analyze data
- Act on data
- Use APM securely
- Manage storage
- Configure APM Server
- Monitor APM Server
- APM APIs
- Troubleshooting
- Upgrade
- Release notes
- Known issues
- Synthetic monitoring
- Get started
- Scripting browser monitors
- Configure lightweight monitors
- Manage monitors
- Work with params and secrets
- Analyze monitor data
- Monitor resources on private networks
- Use the CLI
- Configure projects
- Multi-factor Authentication
- Configure Synthetics settings
- Grant users access to secured resources
- Manage data retention
- Use Synthetics with traffic filters
- Migrate from the Elastic Synthetics integration
- Scale and architect a deployment
- Synthetics support matrix
- Synthetics Encryption and Security
- Troubleshooting
- Real user monitoring
- Uptime monitoring (deprecated)
- Tutorial: Monitor a Java application
- Application performance monitoring (APM)
- CI/CD
- Cloud
- Infrastructure and hosts
- Logs
- Troubleshooting
- Incident management
- Data set quality
- Observability AI Assistant
- Reference
Inventory
editInventory
editInventory provides a single place to observe the status of your entire ecosystem of hosts, containers, and services at a glance, even just from logs. From there, you can monitor and understand the health of your entities, check what needs attention, and start your investigations.
The new Inventory requires the Elastic Entity Model (EEM). To learn more, refer to Elastic Entity Model.
Inventory is currently available for hosts, containers, and services, but it will scale to support all of your entities.
The EEM currently supports the inventory experience (as identified by host.name, service.name, and container.id) located in data identified by the following index patterns:
Hosts
Where host.name is set in metrics-*, logs-*, filebeat-*, and metricbeat-*
Services
Where service.name is set in filebeat*, logs-*, metrics-apm.service_transaction.1m*, and metrics-apm.service_summary.1m*
Containers
Where container.id is set in metrics-*, logs-*, filebeat-*, and metricbeat-*
Inventory allows you to:
- Filter for your entities to provide a high-level view of what you have leveraging your own tags and labels
- Drill down into any host, container, or service to help you understand performance
- Debug resource bottlenecks with your service caused by their containers and the hosts they run on.
- Easily discover all entities related to the host, container or service you are viewing by leveraging your tags and labels
Explore your entities
edit-
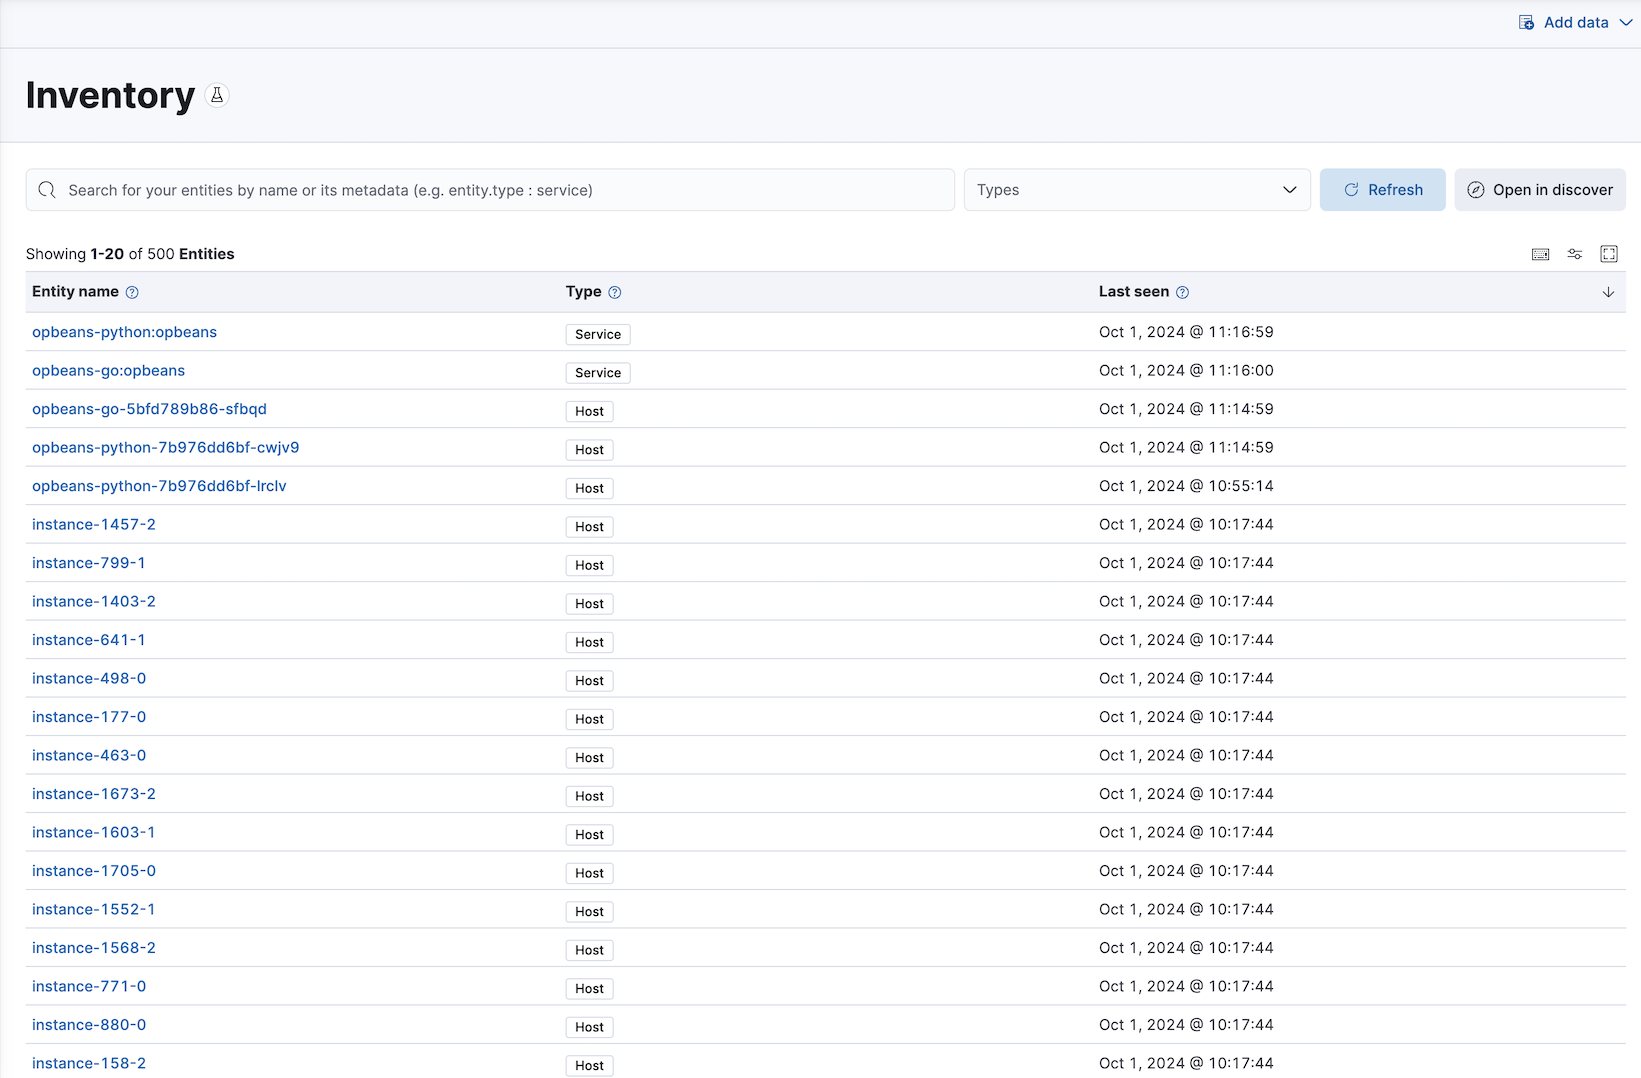
To view all your entities, find Inventory in the main menu or use the global search field.
When you open the Inventory for the first time, you’ll be asked to enable the EEM. Once enabled, the Inventory will be accessible to anyone with the appropriate privileges.
The Inventory feature can be completely disabled using the
observability:entityCentricExperienceflag in Stack Management. -
In the search bar, search for your entities by name or type, for example
entity.type:service.
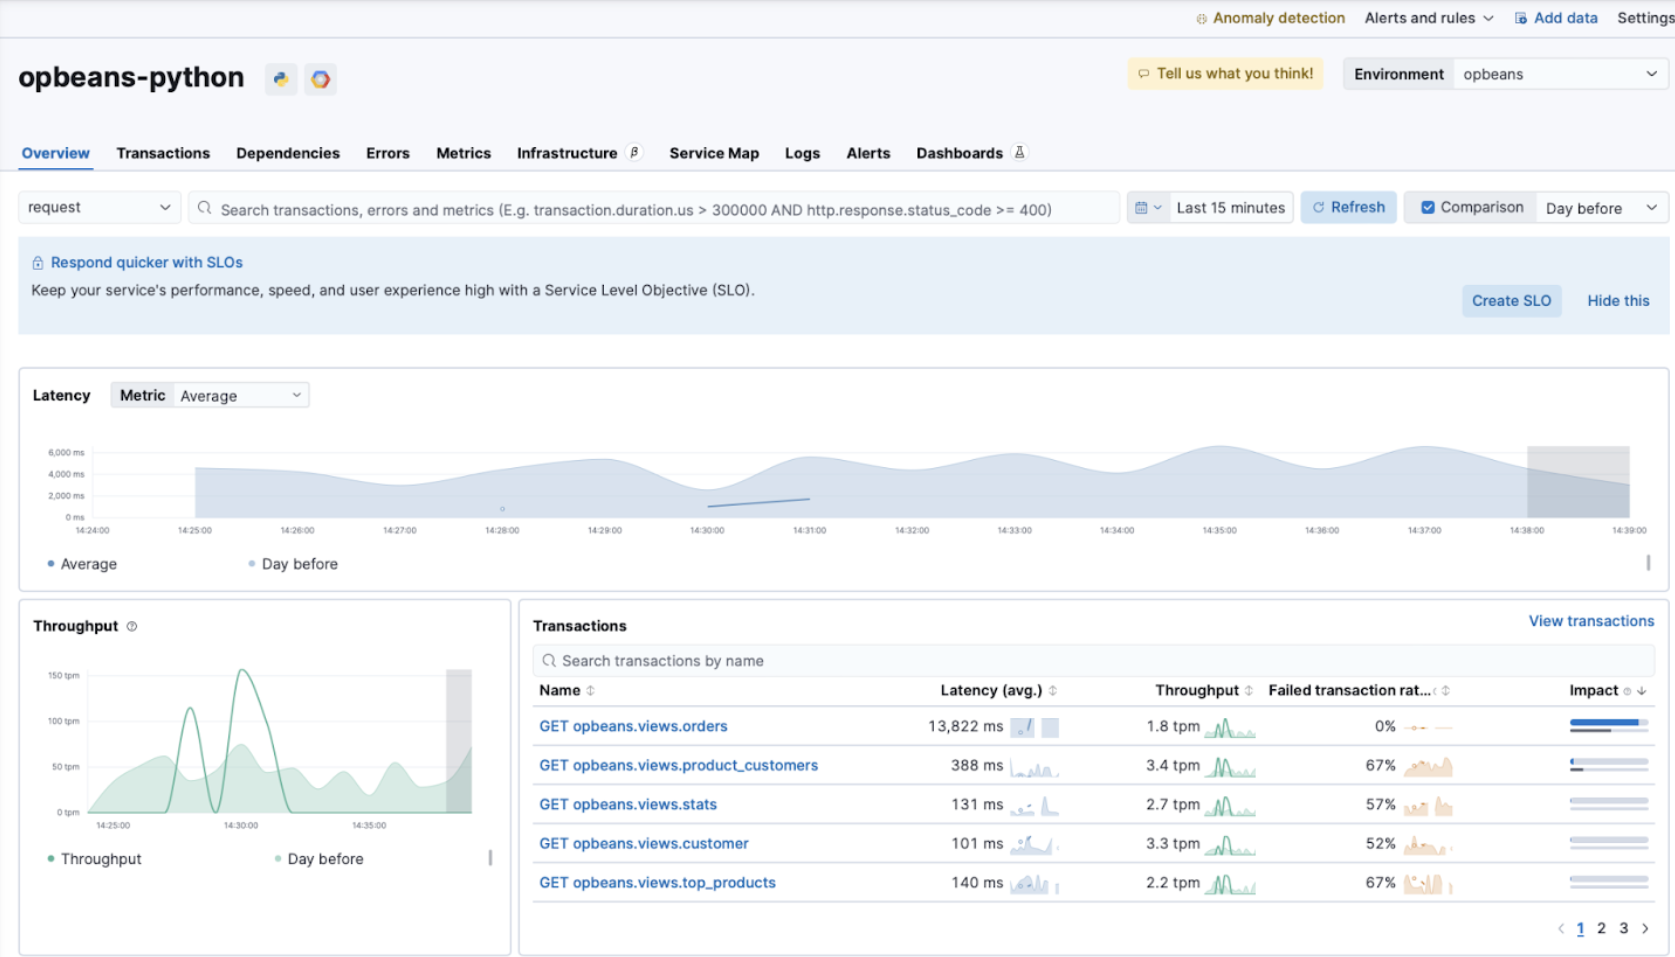
For each entity, you can click the entity name and get a detailed view. For example, for an entity of type service, you get the following details:
- Overview
- Transactions
- Dependencies
- Errors
- Metrics
- Infrastructure
- Service Map
- Logs
- Alerts
- Dashboards
If you open an entity of type host or container that does not have infrastructure data, some of the visualizations will be blank and some features on the page will not be fully populated.
Add entities to the Inventory
editYou can add entities to the Inventory through one of the following approaches: Add data or Associate existing service logs.
Add data
editTo add entities, select Add data and choose one of the following onboarding journeys:
- Host Detects hosts (with metrics and logs)
- Kubernetes Detects hosts, containers, and services
- Application Detects services
- Cloud Ingests telemetry data from the Cloud
Associate existing service logs
editTo learn how, refer to Add a service name to logs.
On this page