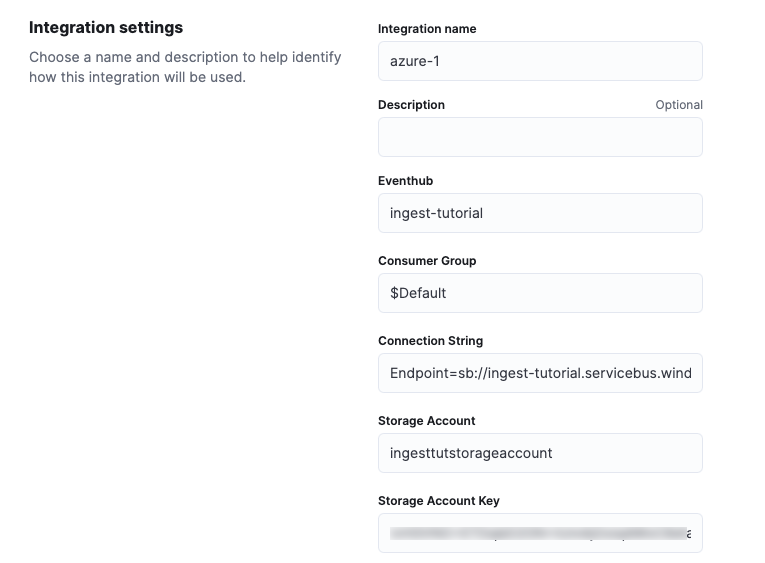
Monitor Microsoft Azure with Elastic Agent
New to Elastic? Follow the steps in our getting started guide instead of the steps described here. Return to this tutorial after you’ve learned the basics.
Using the native Azure integration from the marketplace? Refer to Monitor Microsoft Azure with the Azure Native ISV Service.
In this tutorial, you’ll learn how to deploy Elastic Agent and monitor your Azure infrastructure with Elastic Observability.
You’ll learn how to:
- Create an Azure service principal with permissions to read monitoring data.
- Collect Azure billing metrics.
- Collect Azure activity logs.
- Visualize the logs and infrastructure metrics in Kibana.
In this step, you create an Azure service principal and then grant them access to use the Azure REST API.
The Azure REST API allows you to get insights into your Azure resources using different operations. To access the Azure REST API, you need to use the Azure Resource Manager authentication model. Therefore, you must authenticate all requests with Azure Active Directory (Azure AD). You can create the service principal using the Azure portal or Azure PowerShell. Then, you need to grant access permission, which is detailed here. This tutorial shows how to use the Azure portal.
Go to the Microsoft Azure Portal. Search for and select Azure Active Directory.
In the navigation pane, select App registrations and then click New registration.
Type the name of your application (this tutorial uses
ingest-tutorial-monitor-azure) and click Register (accept the default values for other settings).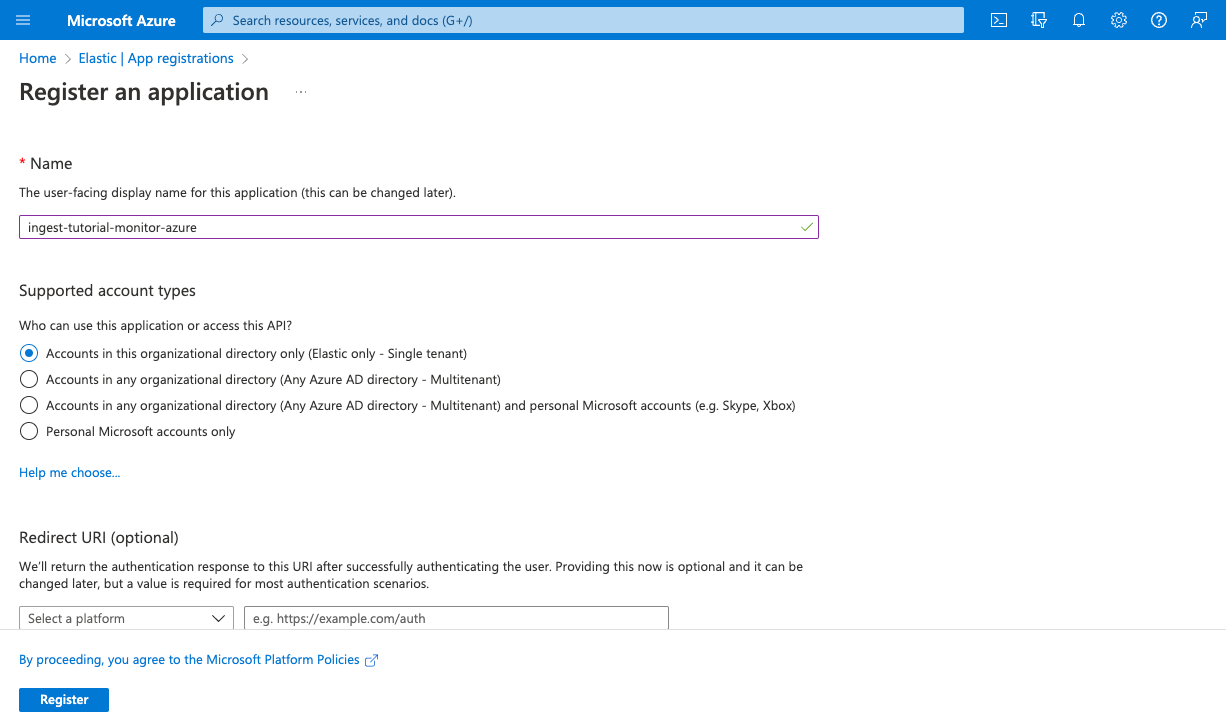
Copy the Application (client) ID and save it for later. This ID is required to configure Elastic Agent to connect to your Azure account.
In the navigation pane, select Certificates & secrets, and then click New client secret to create a new security key.
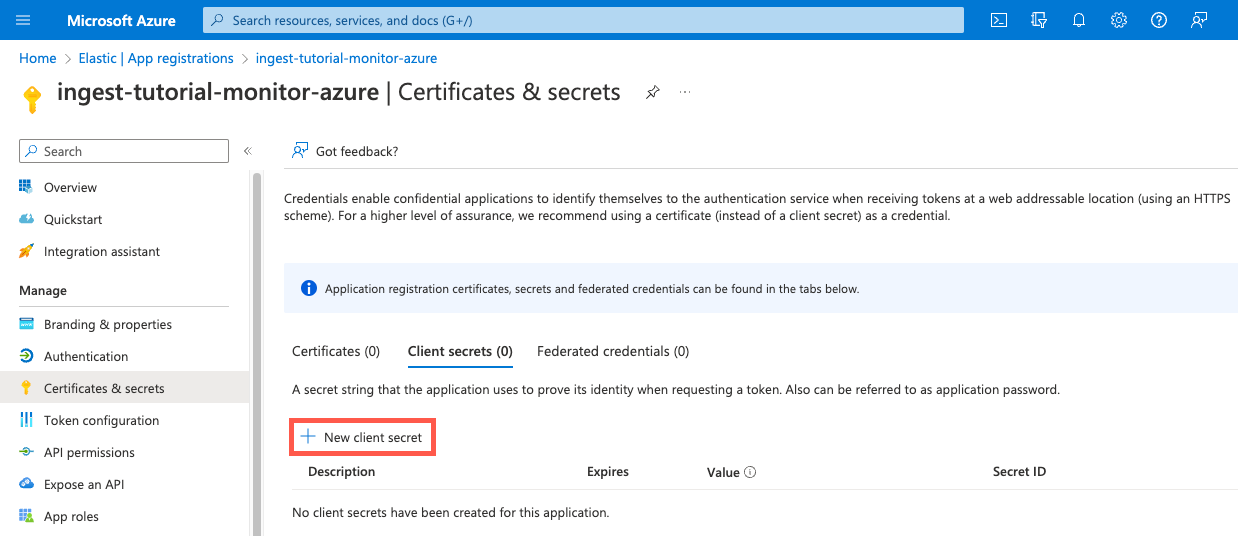
Type a description of the secret and select an expiration. Click Add to create the client secret. Under Value, copy the secret value and save it (along with your client ID) for later.
ImportantThis is your only chance to copy the secret value. You can’t retrieve this value after you leave this page!
After creating the Azure service principal, you need to grant it the correct permissions. You need the Billing Reader role to configure Elastic Agent to collect billing metrics.
In the Azure Portal, search for and select Subscriptions.
In the Subscriptions page, click the name of your subscription.
In the navigation pane, select Access control (IAM).
Click Add and select Add role assignment.
On the Roles tab, select the Billing Reader role, then click Next.
On the Members tab, select the option to assign access to User, group, or service principal.
Click Select members, then search for and select the principal you created earlier.
For the description, enter the name of your service principal.
Click Next to review the role assignment:
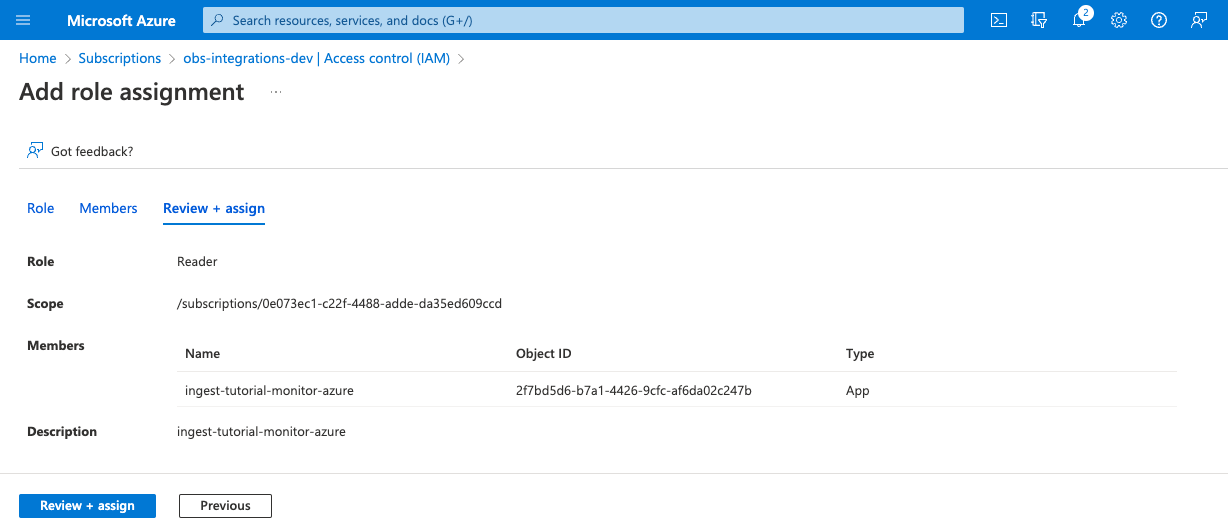
Click Review + assign to grant the service principal access to your subscription.
In this step, you install the Azure Billing Metrics integration in Kibana. This integration contains an input for collecting metrics, such as Azure usage details and forecast information, about your subscription.
To add the integration:
Find Integrations in the main menu or use the global search field.
In the query bar, search for Azure Billing and select the Azure Billing Metrics integration to see more details about it.
Click Add Azure Billing Metrics.
Under Integration settings, configure the integration name and optionally add a description.
TipIf you don’t see options for configuring the integration, you’re probably in a workflow designed for new deployments. Follow the steps, then return to this tutorial when you’re ready to configure the integration.
Specify values for all the required fields. For more information about these settings, refer to the Azure Billing Metrics documentation.
- Client ID
- The Application (client) ID that you copied earlier when you created the service principal.
- Client secret
- The secret value that you copied earlier.
- Tenant ID
- The tenant ID listed on the main Azure Active Directory Page.
- Subscription ID
-
The subscription ID listed on the main Subscriptions page.
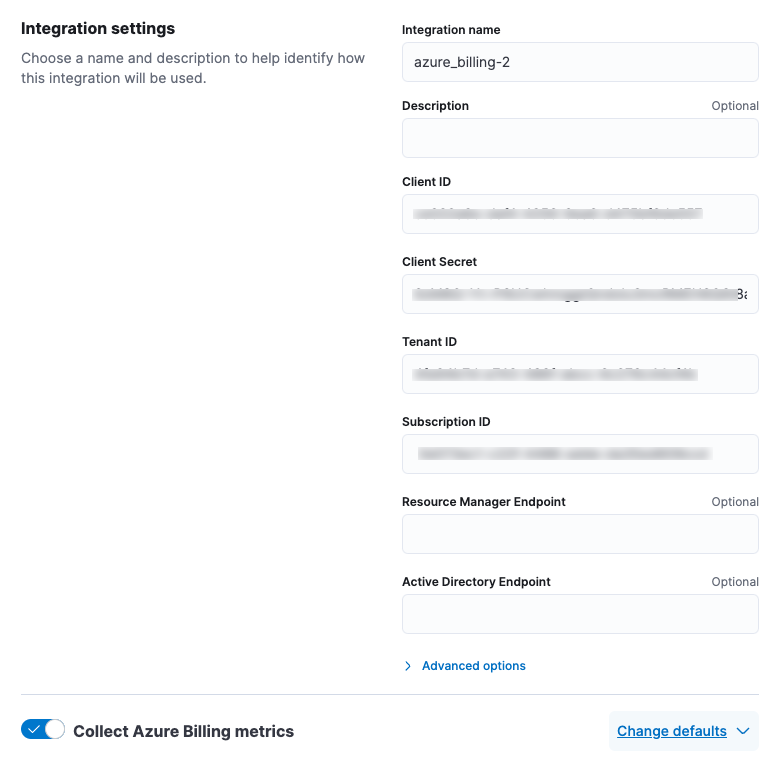
Make sure the Collect Azure Billing metrics selector is turned on.
Accept the defaults to create a new agent policy.
Click Save and continue. This step takes a minute or two to complete. When it’s done, you’ll have an agent policy that contains the Azure configuration you just specified.
A popup should appear that prompts you to Add Elastic Agent to your hosts.
To get support for the latest API changes from Azure, we recommend that you use the latest in-service version of Elastic Agent compatible with your Elastic Stack. Otherwise your integrations may not function as expected.
You can install Elastic Agent on any host that can access the Azure account and forward events to Elasticsearch.
In the popup, click Add Elastic Agent to your hosts to open the Add agent flyout.
TipIf you accidentally closed the popup, go to Fleet → Agents, then click Add agent to access the installation instructions.
The Add agent flyout has two options: Enroll in Fleet and Run standalone. The default is to enroll the agents in Fleet, as this reduces the amount of work on the person managing the hosts by providing a centralized management tool in Kibana.
The enrollment token you need should already be selected.
NoteThe enrollment token is specific to the Elastic Agent policy that you just created. When you run the command to enroll the agent in Fleet, you will pass in the enrollment token.
To download, install, and enroll the Elastic Agent, select your host operating system and copy the installation command shown in the instructions.
Run the command on the host where you want to install Elastic Agent.
It takes a few minutes for Elastic Agent to enroll in Fleet, download the configuration specified in the policy, and start collecting data. You can wait to confirm incoming data, or close the window.
Now that the metrics are streaming to Elasticsearch, you can visualize them in Kibana. Find Dashboards in the main menu or use the global search field. Search for Azure Billing and select the dashboard called [Azure Billing] Billing Overview.
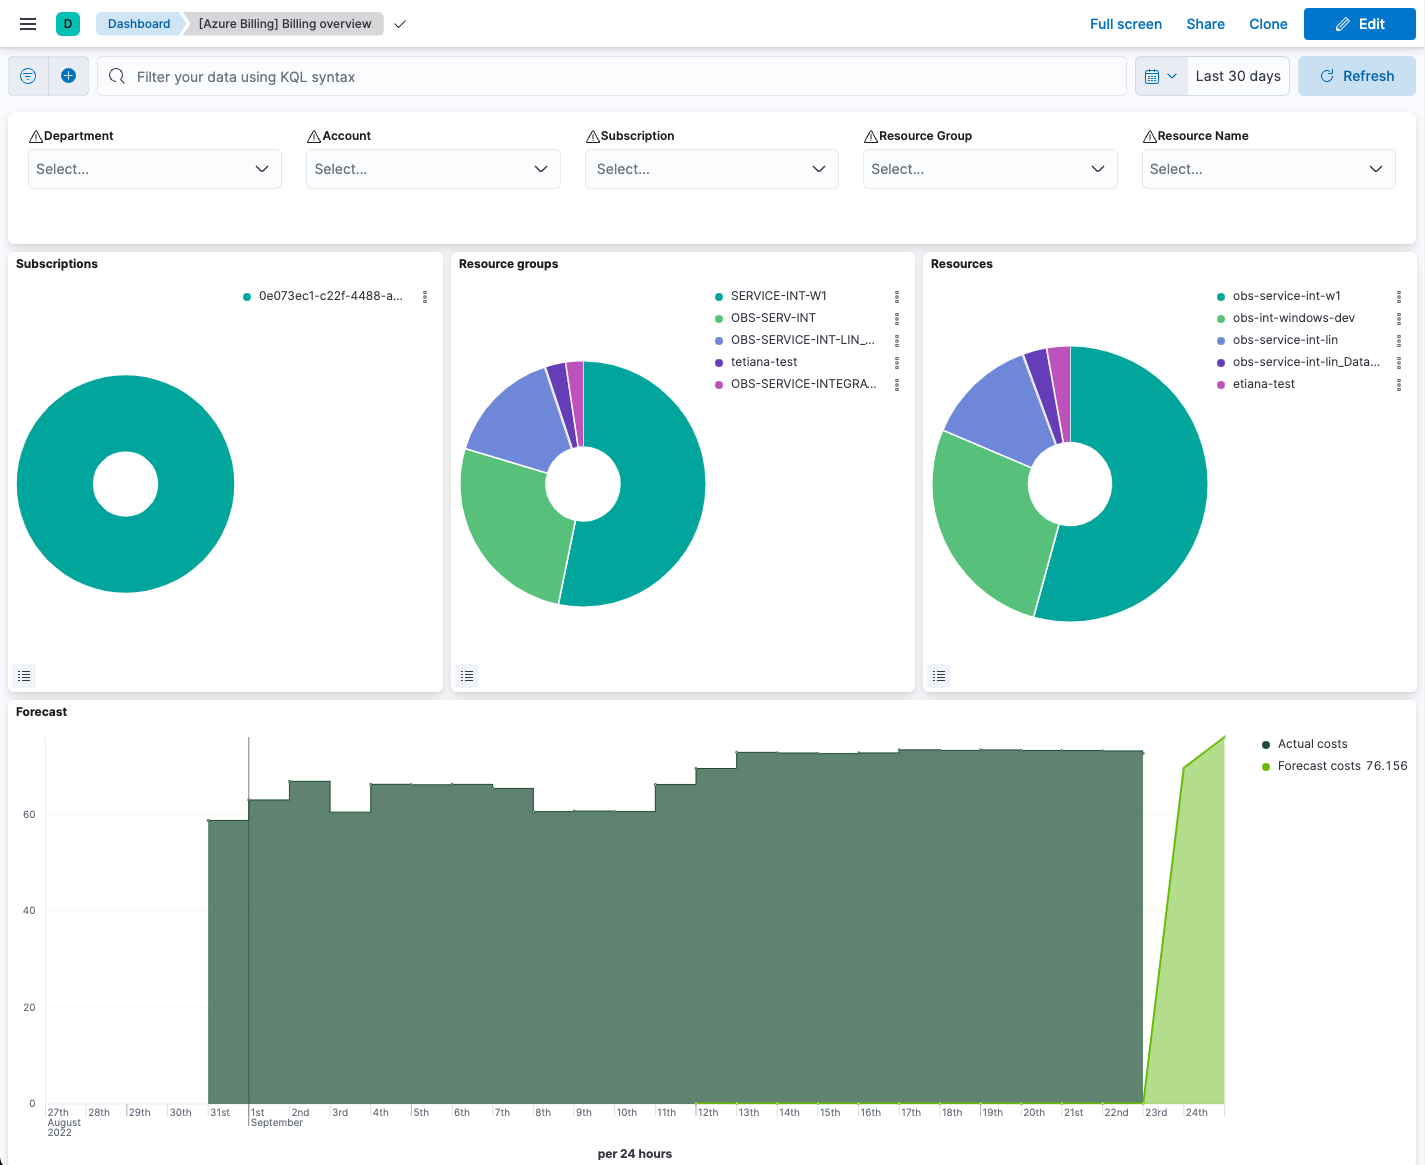
Keep in mind Elastic Agent collects data every 24 hours.
Azure activity logs provide insight into the operations performed on resources in your subscription, such as when and who modified resources, and when virtual machines were started (or failed to start).
In this step, you configure Azure to export activity logs to an Azure event hub, then you configure the Azure Logs integration to read logs from the event hub and send them to Elasticsearch.
Azure Event Hubs is a data streaming platform and event ingestion service that you use to store in-flight Azure logs before sending them to Elasticsearch. For this tutorial, you create a single event hub because you are collecting logs from one service: the Azure Monitor service.
To create an Azure event hub:
Go to the Azure portal.
Search for and select Event Hubs.
Click Create and create a new Event Hubs namespace. You’ll need to create a new resource group, or choose an existing one.
Enter the required settings for the namespace and click Review + create.
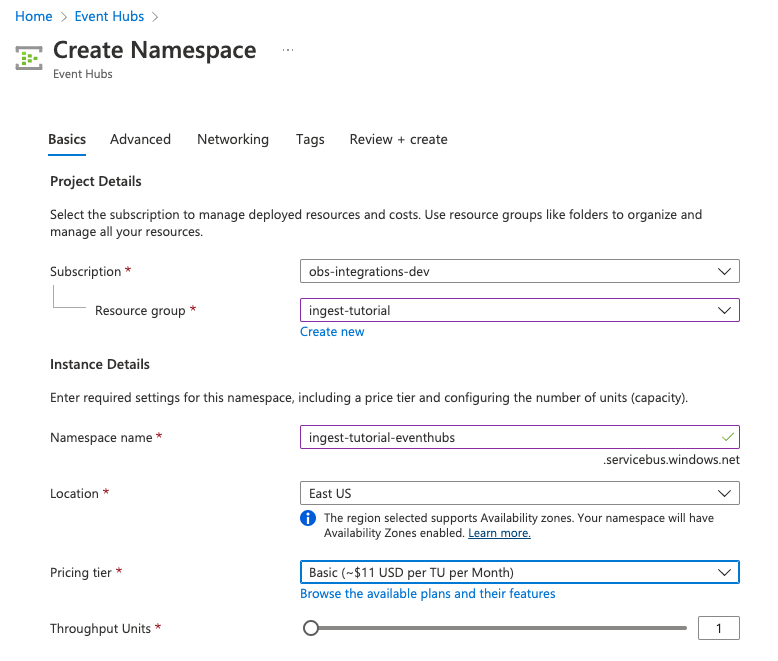
Click Create to deploy the resource.
In the new namespace, click + Event Hub and enter a name for the event hub.
Click Review + create, and then click Create to deploy the resource.
Make a note of the namespace and event hub name because you will need them later.
When do I need more than one event hub?
Typically you create an event hub for each service you want to monitor. For example, imagine that you want to collect activity logs from the Azure Monitor service plus signin and audit logs from the Active Directory service. Rather than sending all logs to a single event hub, you create an event hub for each service:

This setup is more efficient than using a single event hub for all logs because it:
- Ensures that you publish only the logs expected by the downstream integration.
- Saves bandwidth and compute resources because inputs only need to process relevant logs, rather than processing all the logs for all your monitored services, then discarding unneeded logs.
- Avoids duplicates that might result from multiple inputs inadvertently reading and processing the same logs.
For high-volume deployments, you might even want to have a dedicated event hub for each data stream.
Every Azure service that creates logs has diagnostic settings that allow you to export logs and metrics to an external destination. In this step, you configure the Azure Monitor service to export activity logs to the event hub you created earlier.
To configure diagnostic settings for the Azure Monitor service:
Go to the Azure portal and go to Home → Monitor.
In the navigation page, select Activity log, and then click Export Activity Logs.
Select your subscription and click Add diagnostic setting.
Enter a name for the diagnostic setting.
In the list of log categories, select the logs you want to export.
Under Destination details, select Stream to an event hub and select the namespace and event hub you created earlier. For example:
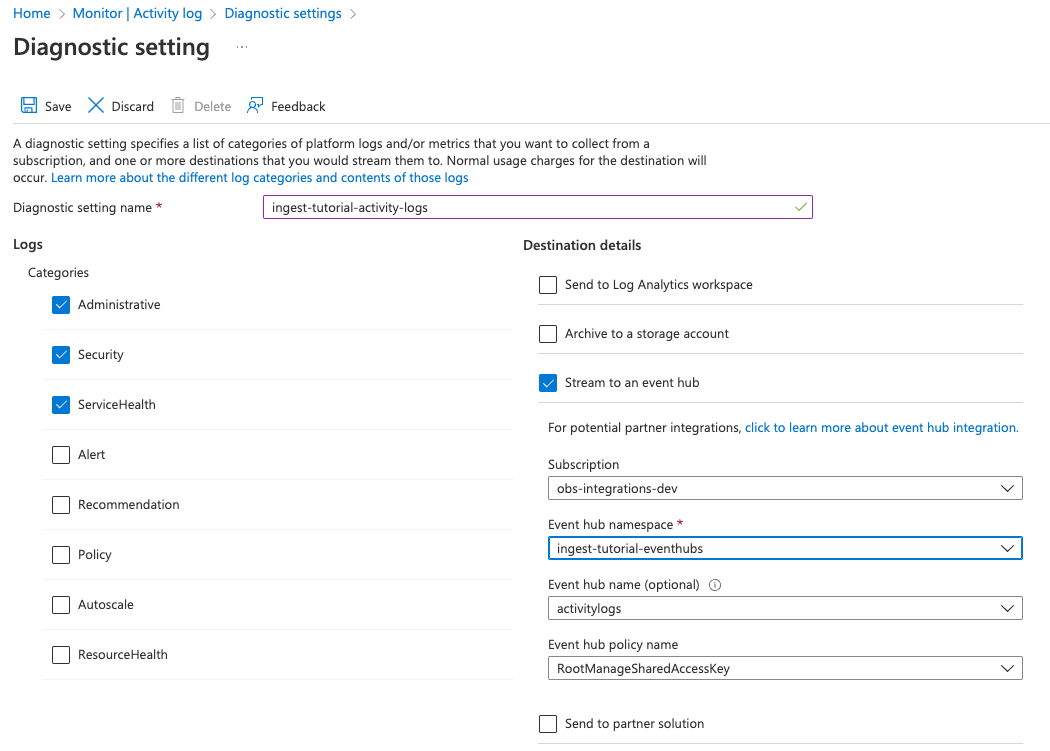
Save the diagnostic settings.
Now that activity logs are streaming into the event hub, you can configure the Azure activity log integration to ingest the logs.
To add the integration:
Find Integrations in the main menu or use the global search field.
In the query bar, search for Azure activity logs and select the Azure activity logs integration to see more details about it.
Click Add Azure activity logs.
Under Integration settings, configure the integration name and optionally add a description.
Specify values for all the required fields. For more information about these settings, refer to the Azure activity logs documentation.
- Eventhub
- The name of the event hub you created earlier.
- Connection String
-
The connection string primary key of the event hub namespace. To learn how to get the connection string, refer to Get an Event Hubs connection string in the Azure documentation.
TipInstead of copying the connection string from the RootManageSharedAccessKey policy, you should create a new shared access policy (with permission to listen) and copy the connection string from the new policy.
Make sure the Collect Azure activity logs from Event Hub selector is turned on.
Under Existing hosts, select the agent policy that created earlier.
Save and deploy the integration.
This step takes a minute or two to complete. When it’s done, you’ll have an agent policy that contains the Azure activity logs configuration plus the billing metrics configuration. The deployed Elastic Agent will pick up the policy change and start sending Azure activity logs to Elasticsearch.
Now that logs are streaming into Elasticsearch, you can visualize them in Kibana. To see the raw logs, find Discover in the main menu or use the global search field. Notice that you can filter on a specific data stream. For example, you can use data_stream.dataset : "azure.activitylogs" to show Azure activity logs.
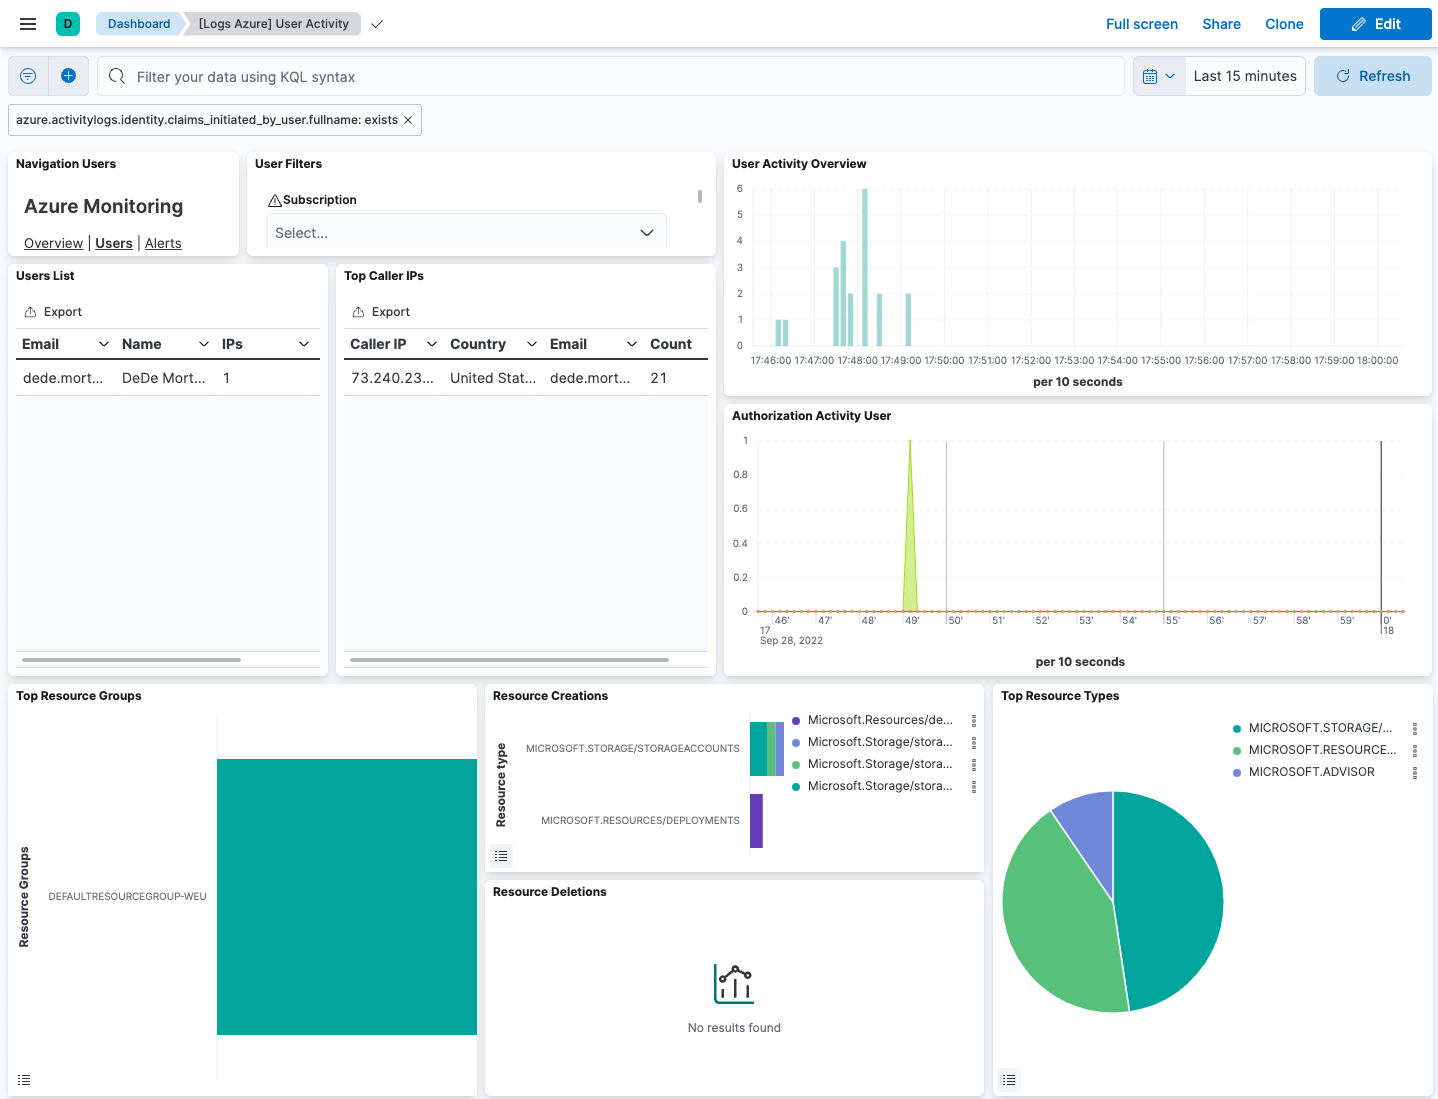
The Azure activity logs integration also comes with pre-built dashboards that you can use to visualize the data. In Kibana, open the main menu and click Dashboard. Search for Azure activity and select the dashboard called [Logs Azure] User Activity:
Congratulations! You have completed the tutorial.
