Monitor CloudWatch logs
In this section, you’ll learn how to export log events from CloudWatch logs to an Elastic cluster by using Amazon Data Firehose.
You’ll go through the following steps:
- Install AWS integration in Kibana
- Select a CloudWatch log group to monitor
- Create a delivery stream in Amazon Data Firehose
- Set up a subscription filter to forward the logs using the Firehose stream
- Visualize your logs in Kibana
We assume that you already have:
- An AWS account with permissions to pull the necessary data from AWS.
- An Elastic Cloud Hosted deployment. The deployment includes an Elasticsearch cluster for storing and searching your data, and Kibana for visualizing and managing your data. AWS Data Firehose works with Elastic Stack version 7.17 or greater, running on Elastic Cloud only.
AWS PrivateLink is not supported. Make sure the deployment is on AWS, because the Amazon Data Firehose delivery stream connects specifically to an endpoint that needs to be on AWS.
- Find Integrations in the main menu or use the global search field.
- Browse the catalog to find the AWS integration.
- Navigate to the Settings tab and click Install AWS assets.

In this tutorial, you are going to collect application logs from an AWS Lambda-based app and forward them to Elastic.
Create a Lambda function
You can skip this section if you already have a Lambda function, or any other service or application that sends logs to a CloudWatch log group. Take note of the log group from which you want to collect log events and move to the next section.
Like many other services and platforms in AWS, Lambda functions natively log directly to CloudWatch out of the box.
Go to the AWS console and open the AWS Lambda page.
Click Create function and select the option to create a function from scratch.
Select a Function name.
As a Runtime, select a recent version of Python. For example, Python 3.11.
Select your Architecture of choice between
arm64andx86_64.Confirm and create the Lambda function.
When AWS finishes creating the function, go to the Code source section and paste the following Python code as function source code:
import json

def lambda_handler(event, context):
    print("Received event: " + json.dumps(event))
Click Deploy to deploy the changes to the source code.
Generate some sample logs
With the function ready to go, you can invoke it a few times to generate sample logs. On the function page, follow these steps:
- Select Test.
- Select the option to create a new test event.
- Name the test event and Save the changes.
- Click the Test button to execute the function.
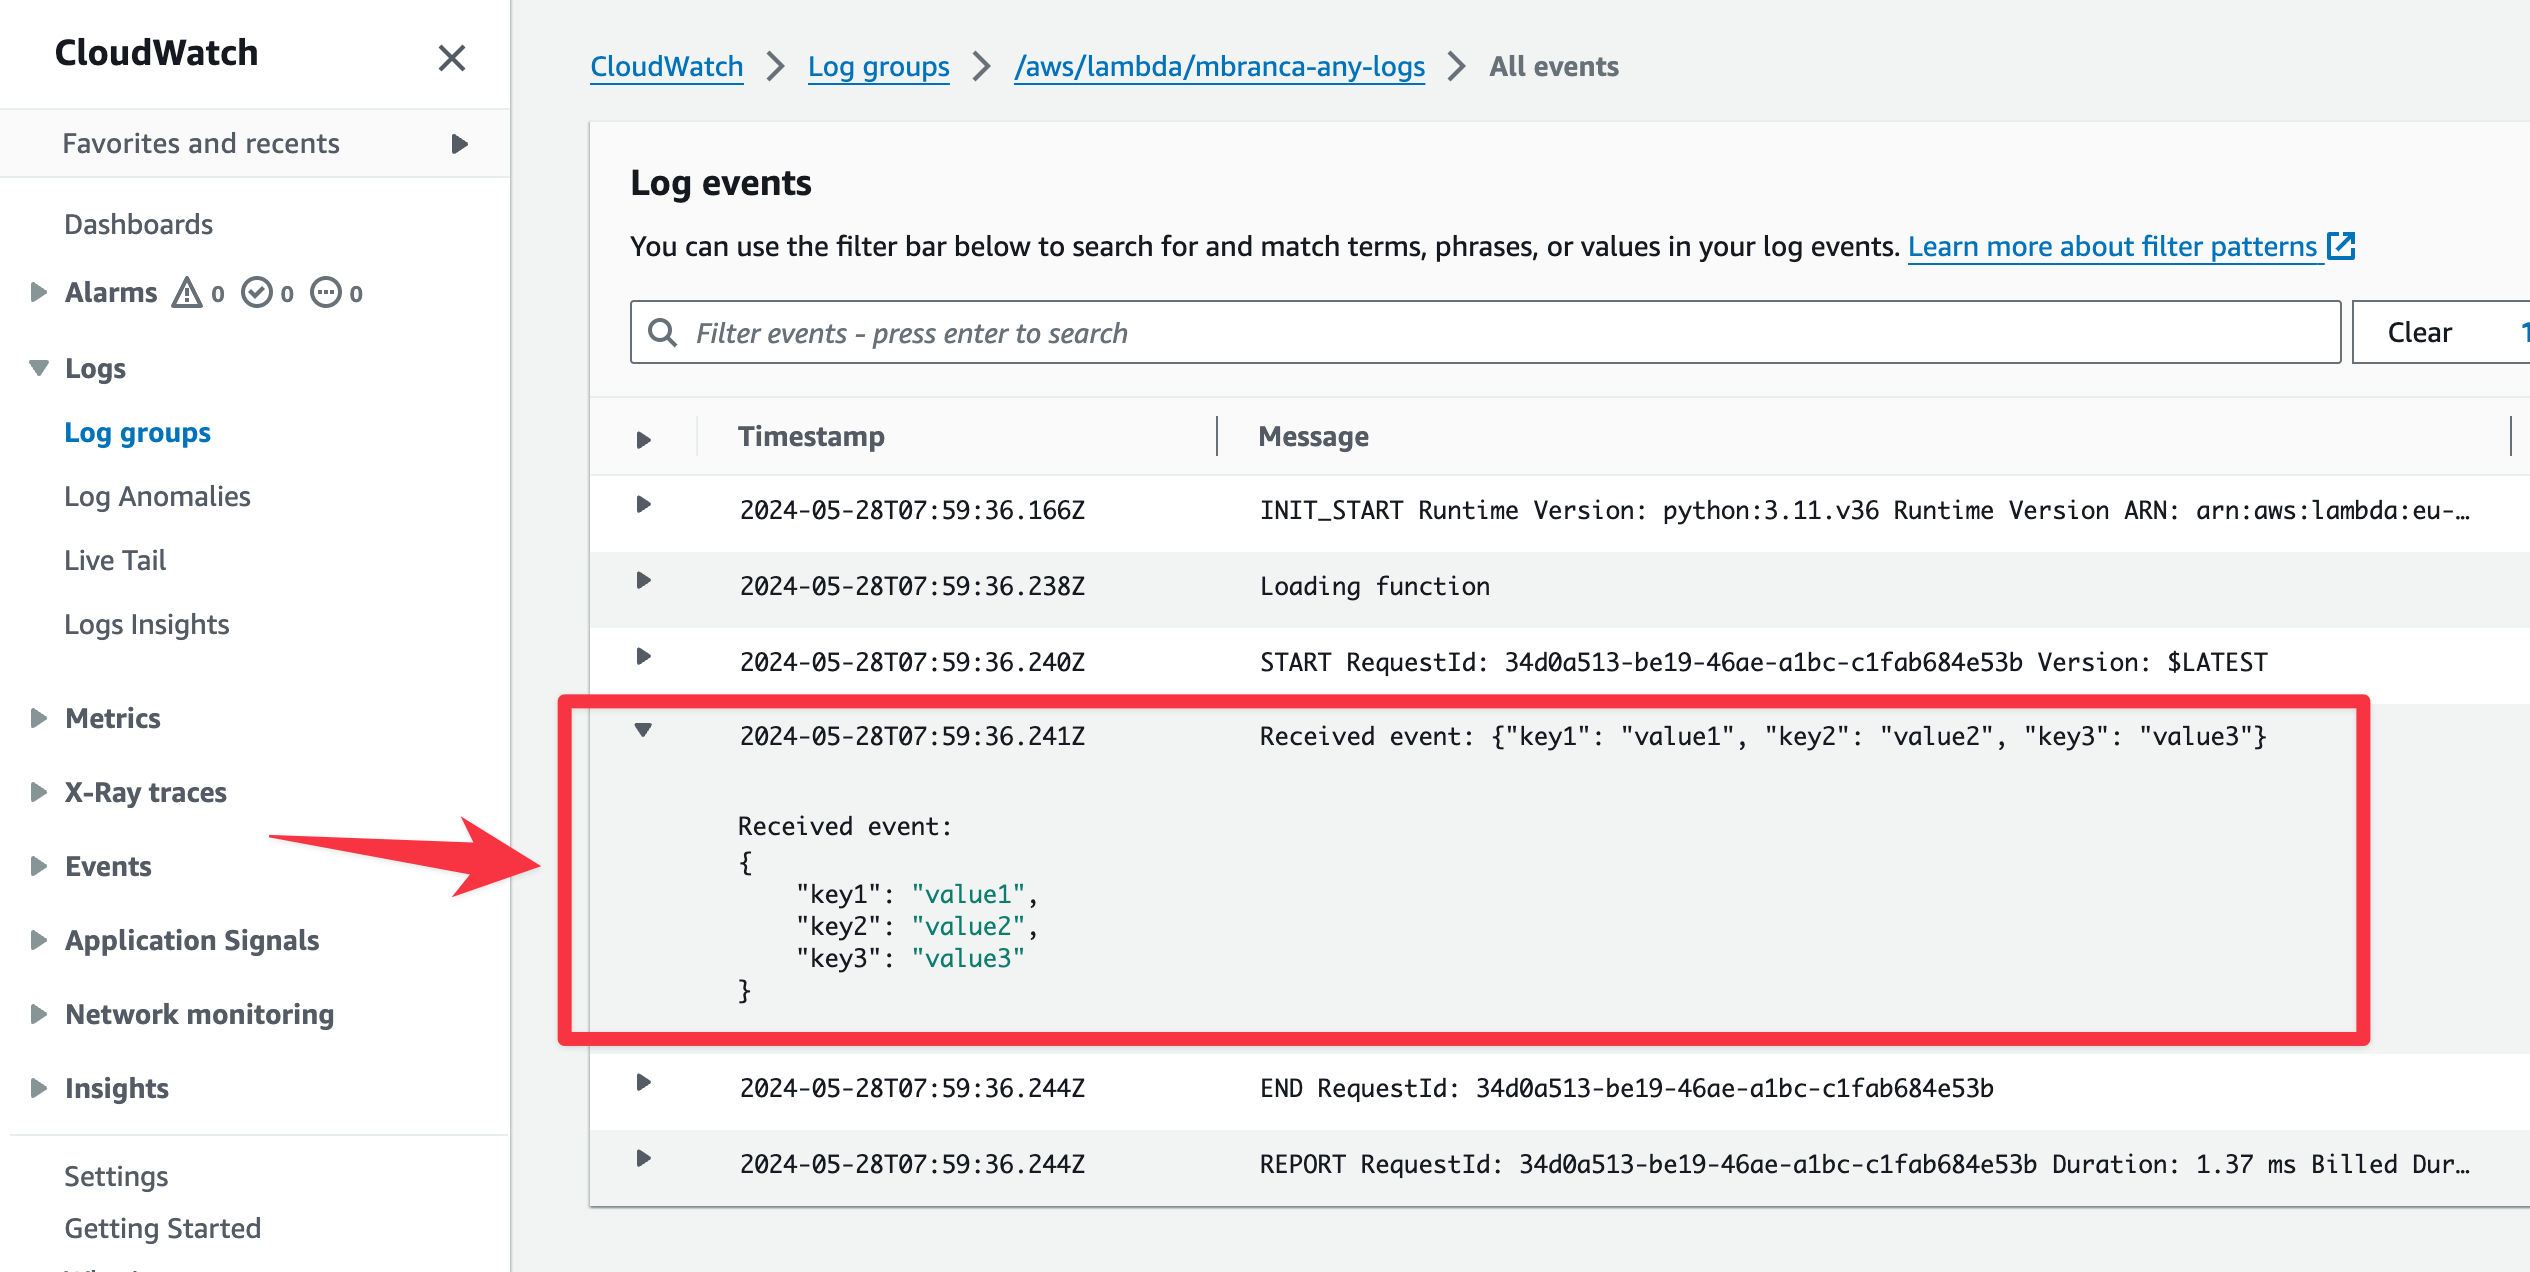
Visit the function’s log group. Usually, the AWS console offers a handy link to jump straight to the log group it created for this function’s logs. You should get something similar to the following:

Take note of the log group name for this Lambda function, as you will need it in the next steps.

Go to the AWS console and navigate to Amazon Data Firehose.
Click Create Firehose stream and choose the source and destination of your Firehose stream. Unless you are streaming data from Kinesis Data Streams, set source to
Direct PUTand destination toElastic.Provide a meaningful Firehose stream name that will allow you to identify this delivery stream later.
NoteFor advanced use cases, source records can be transformed by invoking a custom Lambda function. When using Elastic integrations, this should not be required.
From the Destination settings panel, specify the following settings:
To find the Elasticsearch endpoint URL:
- Go to the Elastic Cloud console
- Find your deployment in the Hosted deployments card and select Manage.
- Under Applications click Copy endpoint next to Elasticsearch.
- Make sure the endpoint is in the following format:
https://<deployment_name>.es.<region>.<csp>.elastic-cloud.com.
To create the API key:
- Go to the Elastic Cloud console
- Select Open Kibana.
- Open the API keys management page in the navigation menu or using the global search field, then click Create API key.If you are using an API key with Restrict privileges, make sure to review the Indices privileges to provide at least
auto_configureandwritepermissions for the indices you will be using with this delivery stream.
Content encoding: To reduce the data transfer costs, use GZIP encoding.
Retry duration: Determines how long Firehose continues retrying the request in the event of an error. A duration between 60 and 300 seconds should be suitable for most use cases.
It is recommended to configure S3 backup for failed records from the Backup settings panel. These backups can be used to restore data losses caused by unforeseen service outages.
The Firehose stream is now ready to send logs to your Elastic Cloud deployment.

To send log events from CloudWatch to Firehose, open the log group where the Lambda service is logging and create a subscription filter.
Create a subscription filter for Amazon Data Firehose
The subscription filter allows you to pick log events from the log group and forward them to other services, such as an Amazon Kinesis stream, an Amazon Data Firehose stream, or AWS Lambda.
- On the log group page, select Subscription filters and click the Create Amazon Data Firehose subscription filter button.
From here, follow these steps:
Choose a destination. Select the Firehose stream you created in the previous step.
Grant the CloudWatch service permission to send log events to the stream in Firehose:
- Create a new role with a trust policy that allows CloudWatch service to assume the role.
- Assign a policy to the role that permits "putting records" into a Firehose stream.
Create a new IAM role and use the following JSON as the trust policy:
{
    "Version": "2012-10-17",
    "Statement": [
        {
            "Effect": "Allow",
            "Principal": {
                "Service": "logs.<REGION>.amazonaws.com"
            },
            "Action": "sts:AssumeRole",
            "Condition": {
                "StringLike": {
                    "aws:SourceArn": "arn:aws:logs:<REGION>:<ACCOUNT_ID>:*"
                }
            }
        }
    ]
}
Assign a policy to the IAM role by using the following JSON file:
{
    "Version": "2012-10-17",
    "Statement": [
        {
            "Effect": "Allow",
            "Action": "firehose:PutRecord",
            "Resource": "arn:aws:firehose:<REGION>:<ACCOUNT_ID>:deliverystream/<YOUR_FIREHOSE_STREAM>"
        }
    ]
}
When the new role is ready, you can select it in the subscription filter.
Configure log format and filters. Select the "Other" in the Log format option.
Set log format and filters
If you want to forward all log events, you can empty the filter pattern. You can use the Subscription filter pattern to forward only the log events that match the pattern. The Test pattern tool on the same page allows you to test filter patterns before creating the subscription filter.
Generate additional logs.
Open the AWS Lambda page again, select the function you created, and execute it a few times to generate new log events.
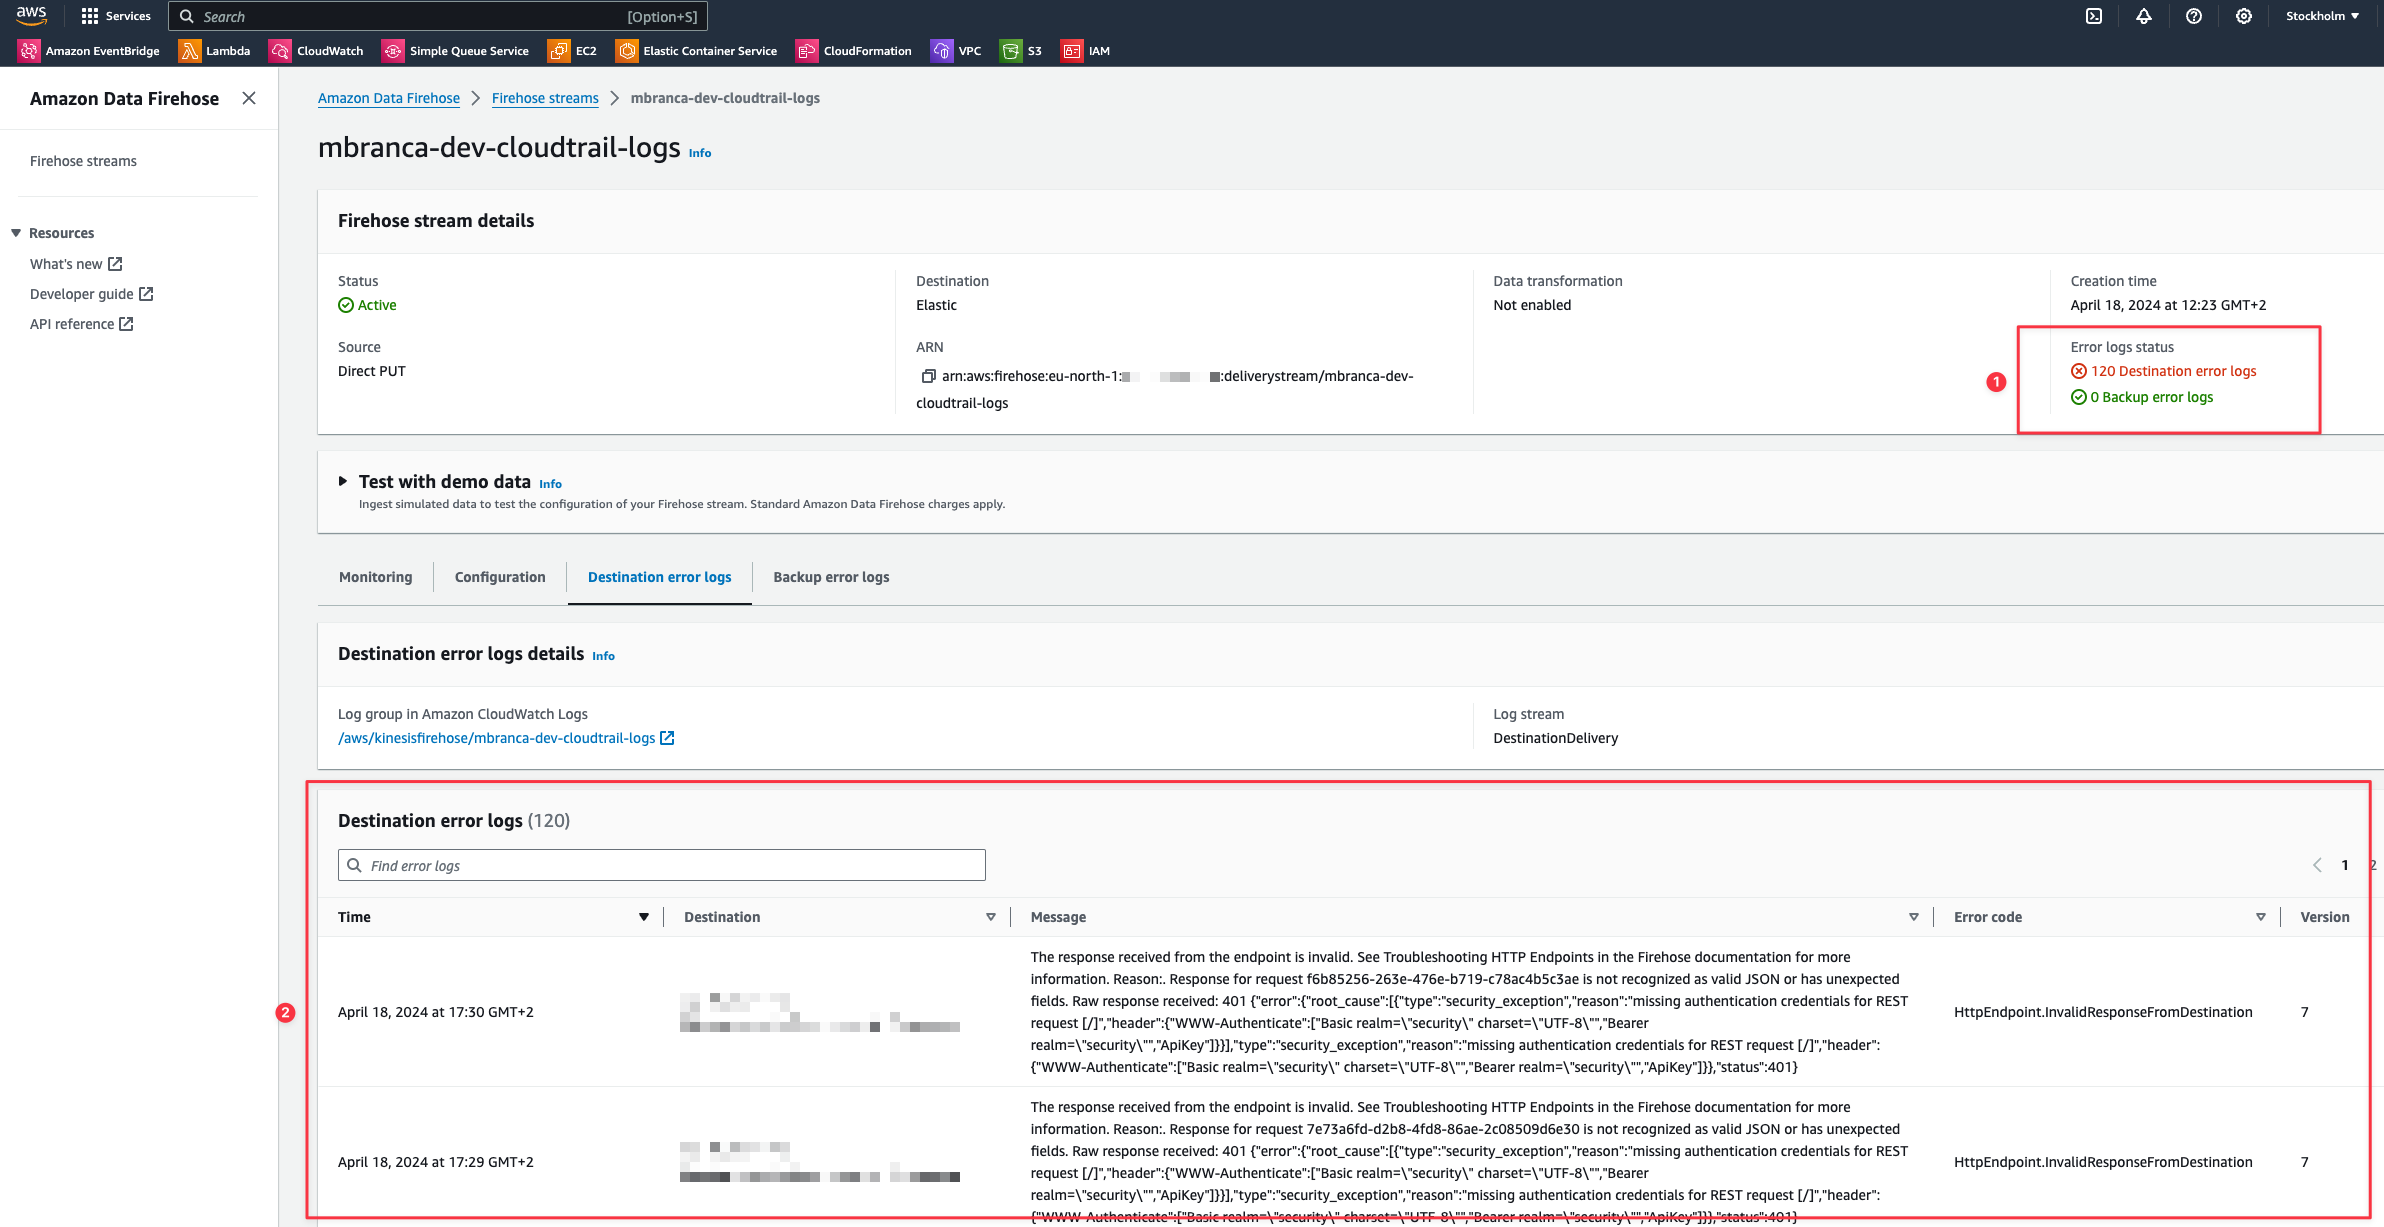
Check if there are destination error logs
On the AWS console, navigate to your Firehose stream and check for entries in the Destination error logs section.
If everything is running smoothly, this list is empty. If there’s an error, you can check the details. The following example shows a delivery stream that fails to send records to the Elastic stack due to bad authentication settings:

The Firehose delivery stream reports:
- The number of failed deliveries.
- The failure detail.

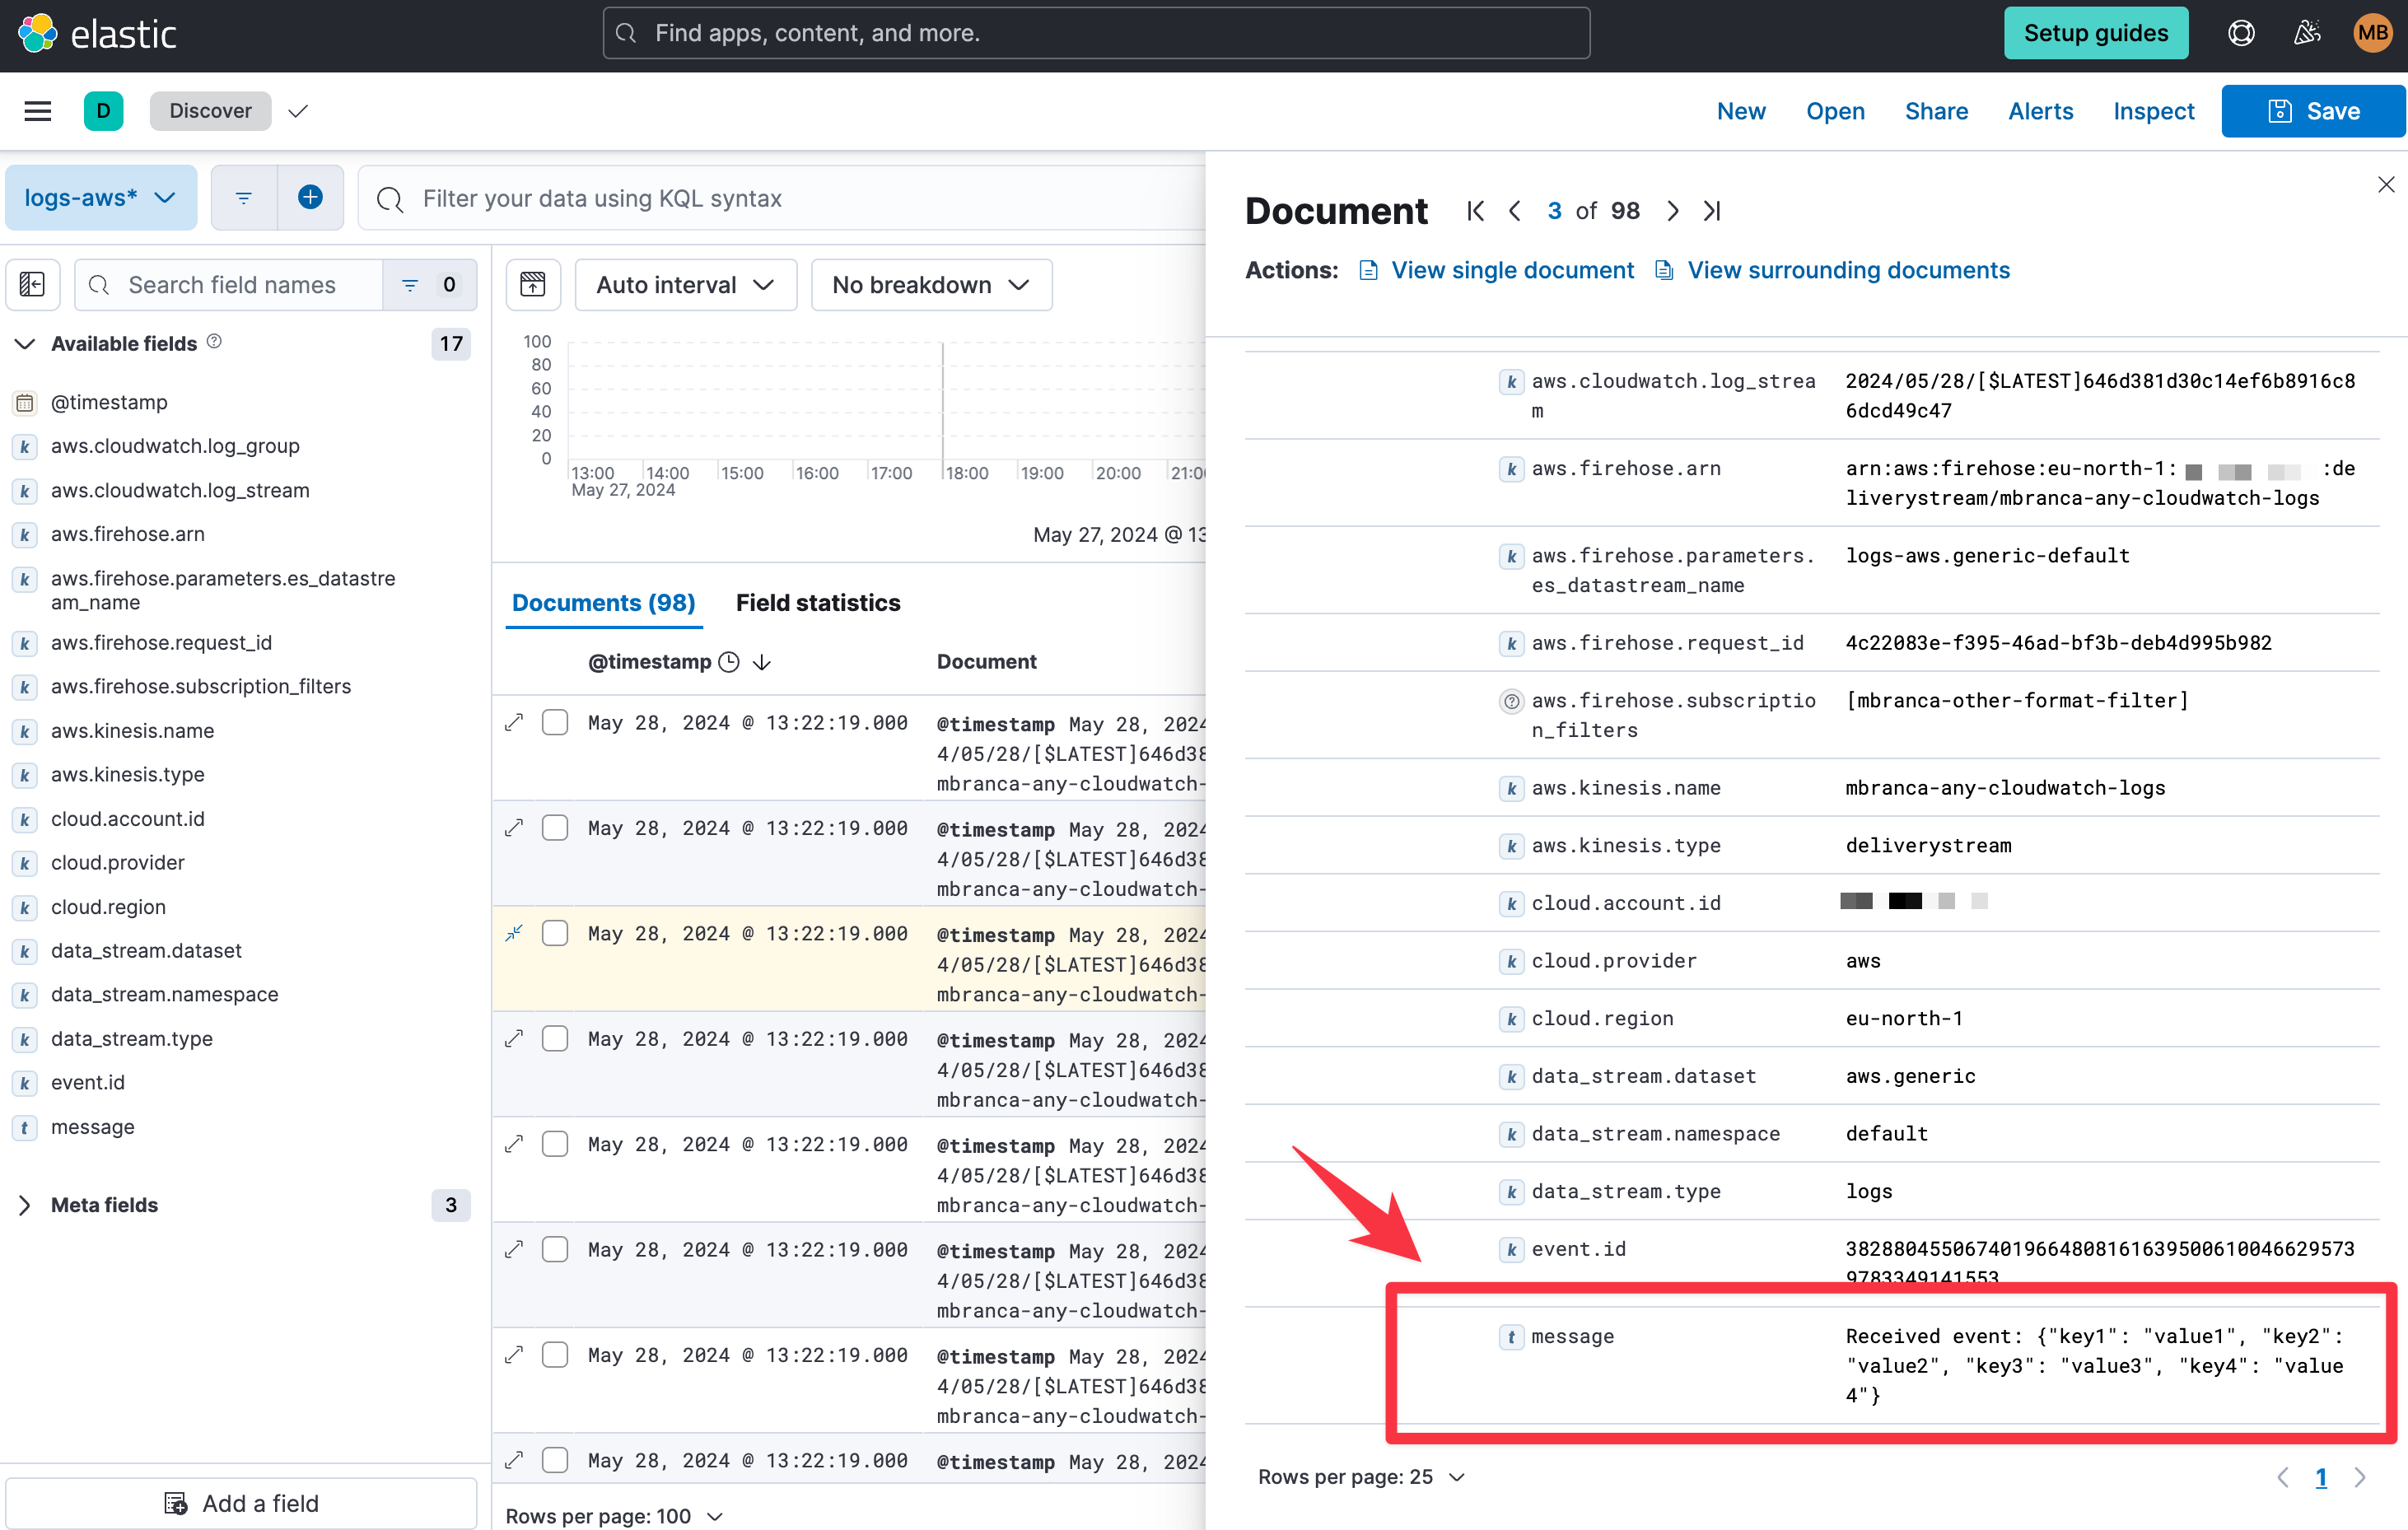
With the logs streaming to the Elastic stack, you can now visualize them in Kibana.
In Kibana, navigate to the Discover page and select the index pattern that matches the Firehose stream name. Here is a sample of logs from the Lambda function you forwarded to the logs-aws.generic-default data stream:
