Domain Generation Algorithm Detection
| Version | 2.3.5 (View all) |
| Subscription level What's this? |
Platinum |
| Developed by What's this? |
Elastic |
| Minimum Kibana version(s) | 9.0.0 8.9.0 |
The Domain Generation Algorithm (DGA) Detection package contains assets to detect DGA activity in your network data. This package requires a Platinum subscription. Please ensure that you have a Trial or Platinum level subscription installed on your cluster before proceeding. This package is licensed under Elastic License 2.0.
This package leverages event logs on Linux, macOS, and Windows. Prior to using this integration, you must have Elastic Endpoint via Elastic Defend, or have equivalent tools/endpoints set up. If using Elastic Defend, Elastic Defend should be installed through Elastic Agent and collecting data from hosts. See Configure endpoint protection with Elastic Defend for more information.
In versions 2.0.1 and later, this package ignores data in cold and frozen data tiers to reduce heap memory usage, avoid running on outdated data, and to follow best practices.
For more detailed information refer to the following blogs:
- Detect domain generation algorithm (DGA) activity with new Kibana integration
- Combining supervised and unsupervised machine learning for DGA detection
- Upgrading: If upgrading from a version below v2.0.0, see the section v2.0.0 and beyond.
- Add the Integration Package: Install the package via Management > Integrations > Add Domain Generation Algorithm Detection. Configure the integration name and agent policy. Click Save and Continue. (Note that this integration does not rely on an agent, and can be assigned to a policy without an agent.)
- Install assets: Install the assets by clicking Settings > Install Domain Generation Algorithm Detection assets.
- Configure the pipeline: To configure the pipeline you can use one of the following steps:
- If using Elastic Defend, add a custom pipeline to the data stream. Go to Stack Management > Ingest Pipelines, and check if the pipeline
logs-endpoint.events.network@customexists.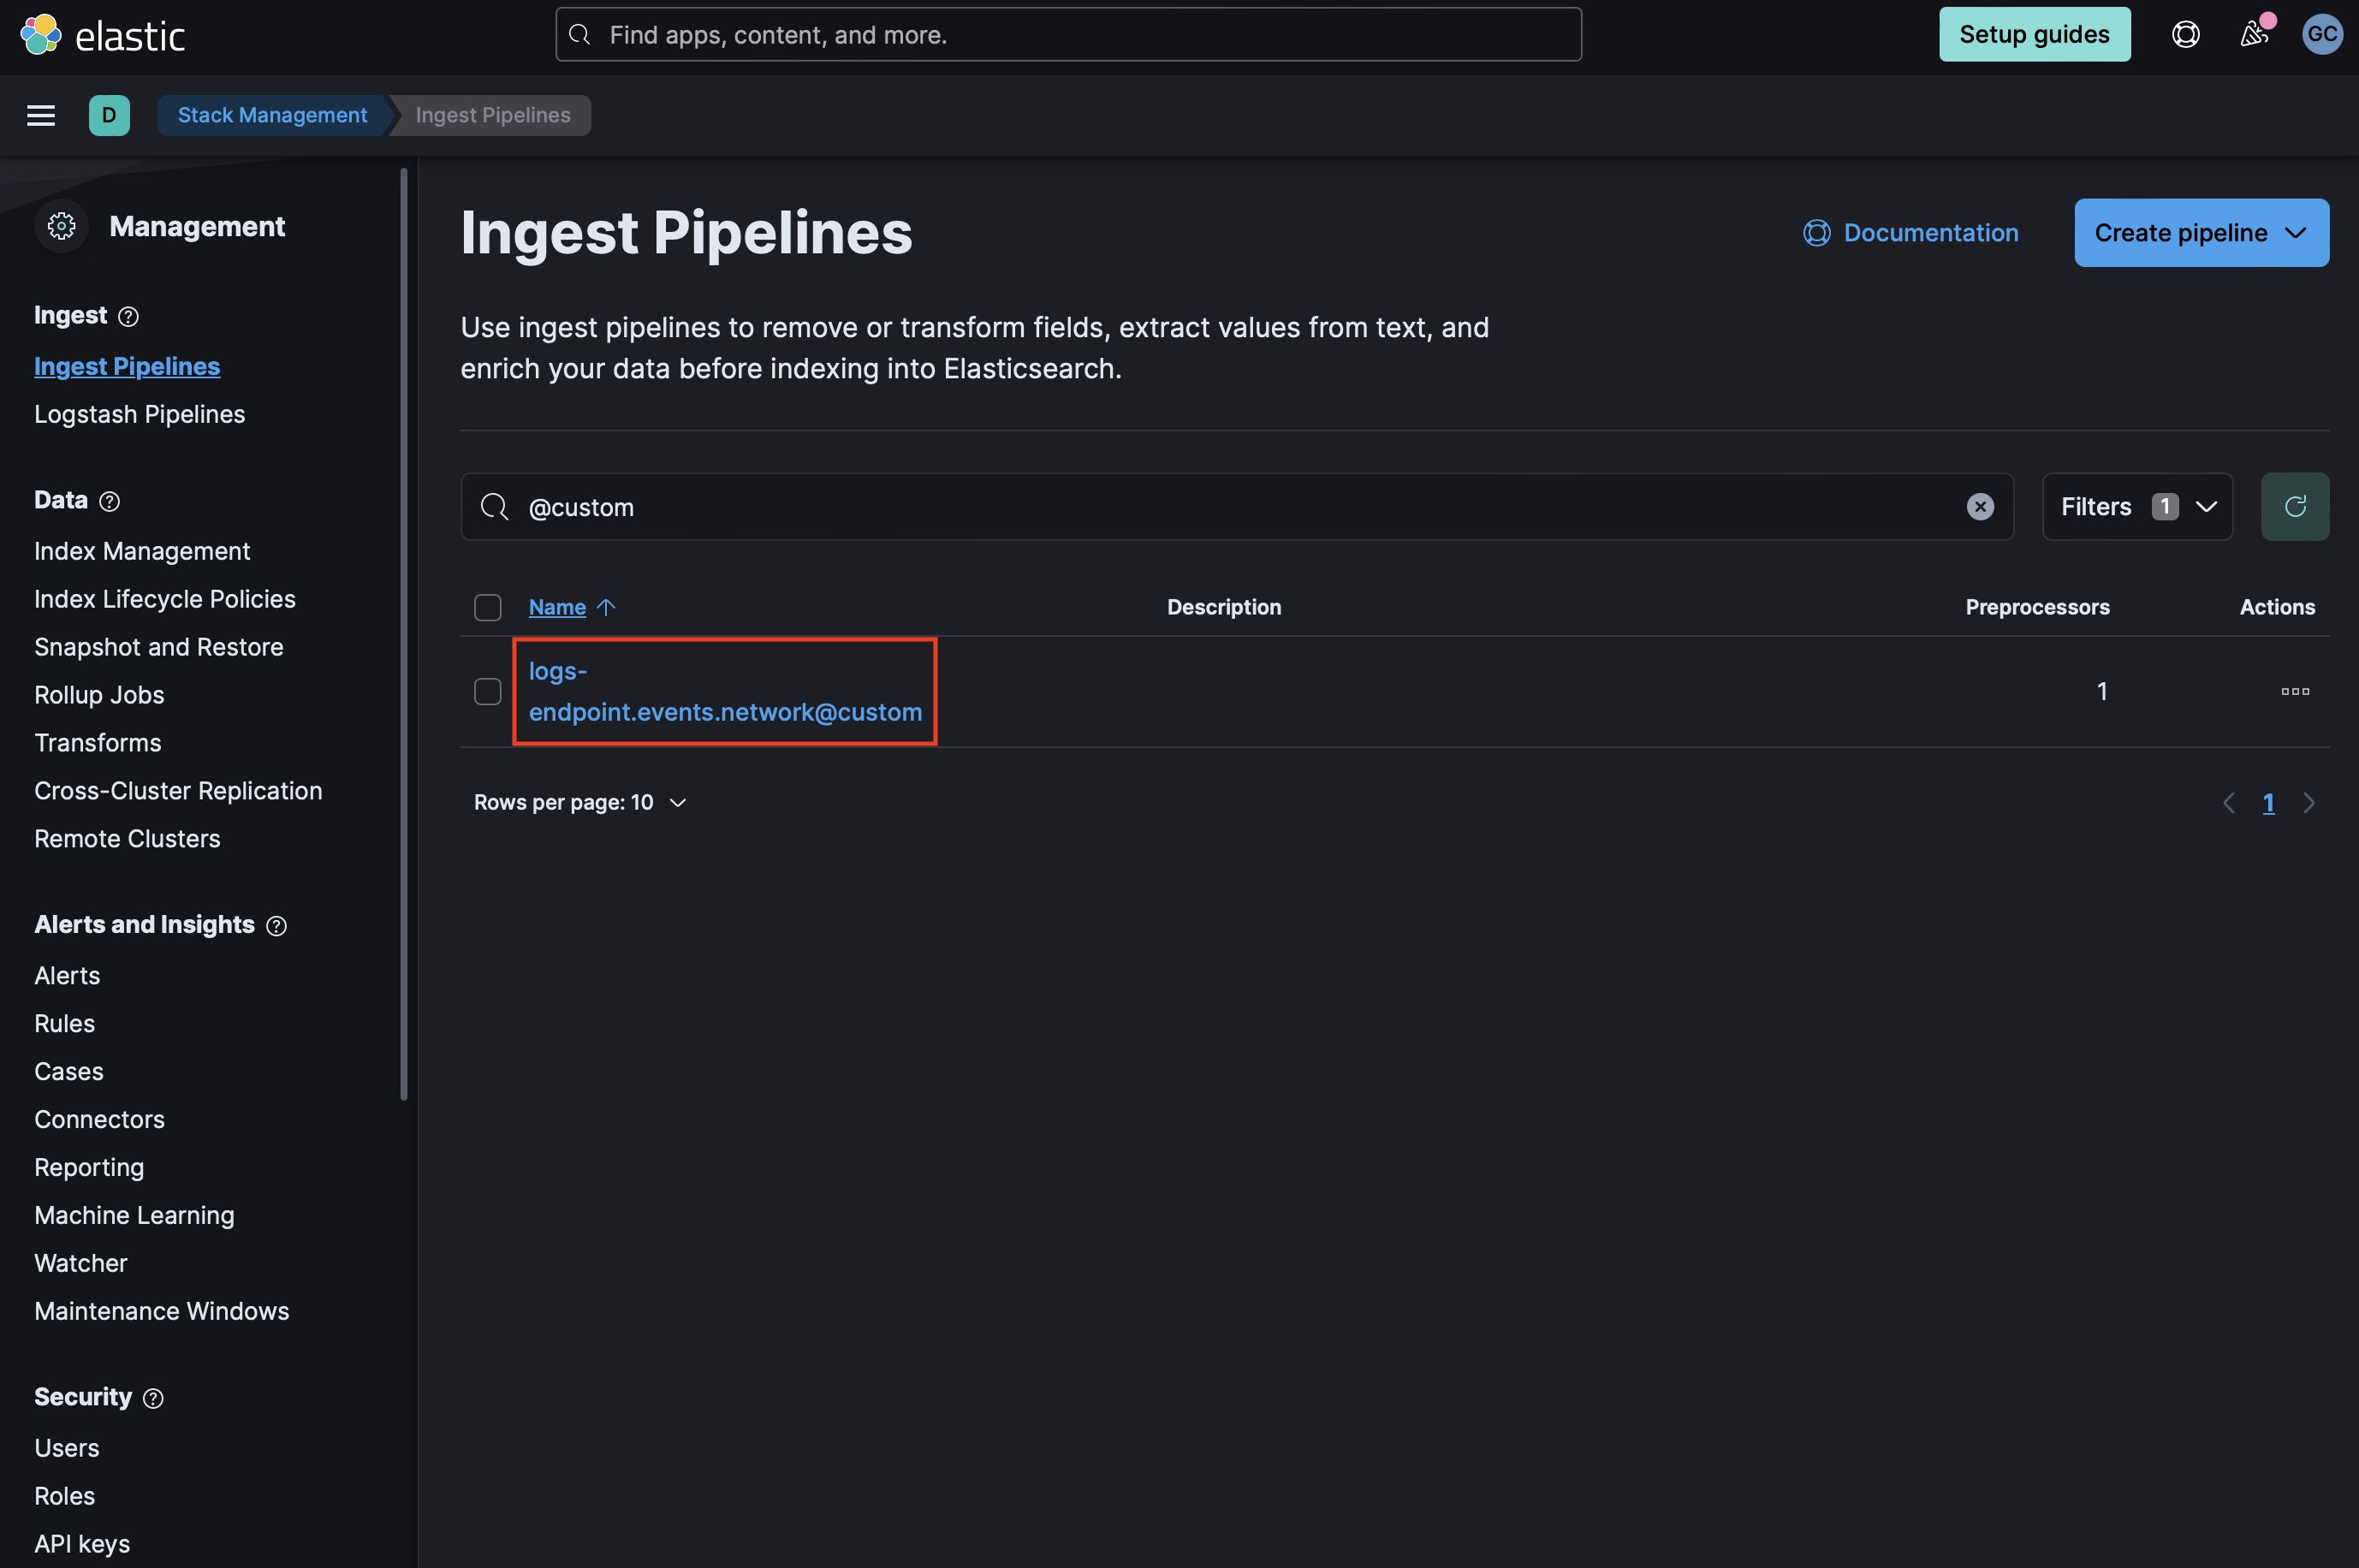 If it does not exist, you can create it by running the following command in the Dev Console. Be sure to replace
 <VERSION>with the current package version.PUT _ingest/pipeline/logs-endpoint.events.network@custom { "processors": [ { "pipeline": { "name": "<VERSION>-ml_dga_ingest_pipeline", "ignore_missing_pipeline": true, "ignore_failure": true } } ] } - If
logs-endpoint.events.network@customalready exists, select the three dots next to it and choose Edit. Click Add a processor. Select Pipeline for Processor, enter<VERSION>-ml_dga_ingest_pipelinefor name (replacing<VERSION>with the current package version), and check Ignore missing pipeline and Ignore failures for this processor. Select Add Processor. - If using an Elastic Beat such as Packetbeat, add the ingest pipeline to it by adding a simple configuration setting to
packetbeat.ymland skip to the Add preconfigured anomaly detection jobs section in these instructions.
- If using Elastic Defend, add a custom pipeline to the data stream. Go to Stack Management > Ingest Pipelines, and check if the pipeline
- Add the required mappings to the index or component template: Go to Stack Management > Index Management > Component Templates. Templates that can be edited to add custom components will be marked with a
@customsuffix. For instance, the custom component template for Elastic Defend network events islogs-endpoint.events.network@custom. Note: Do not attempt to edit the@packagetemplate.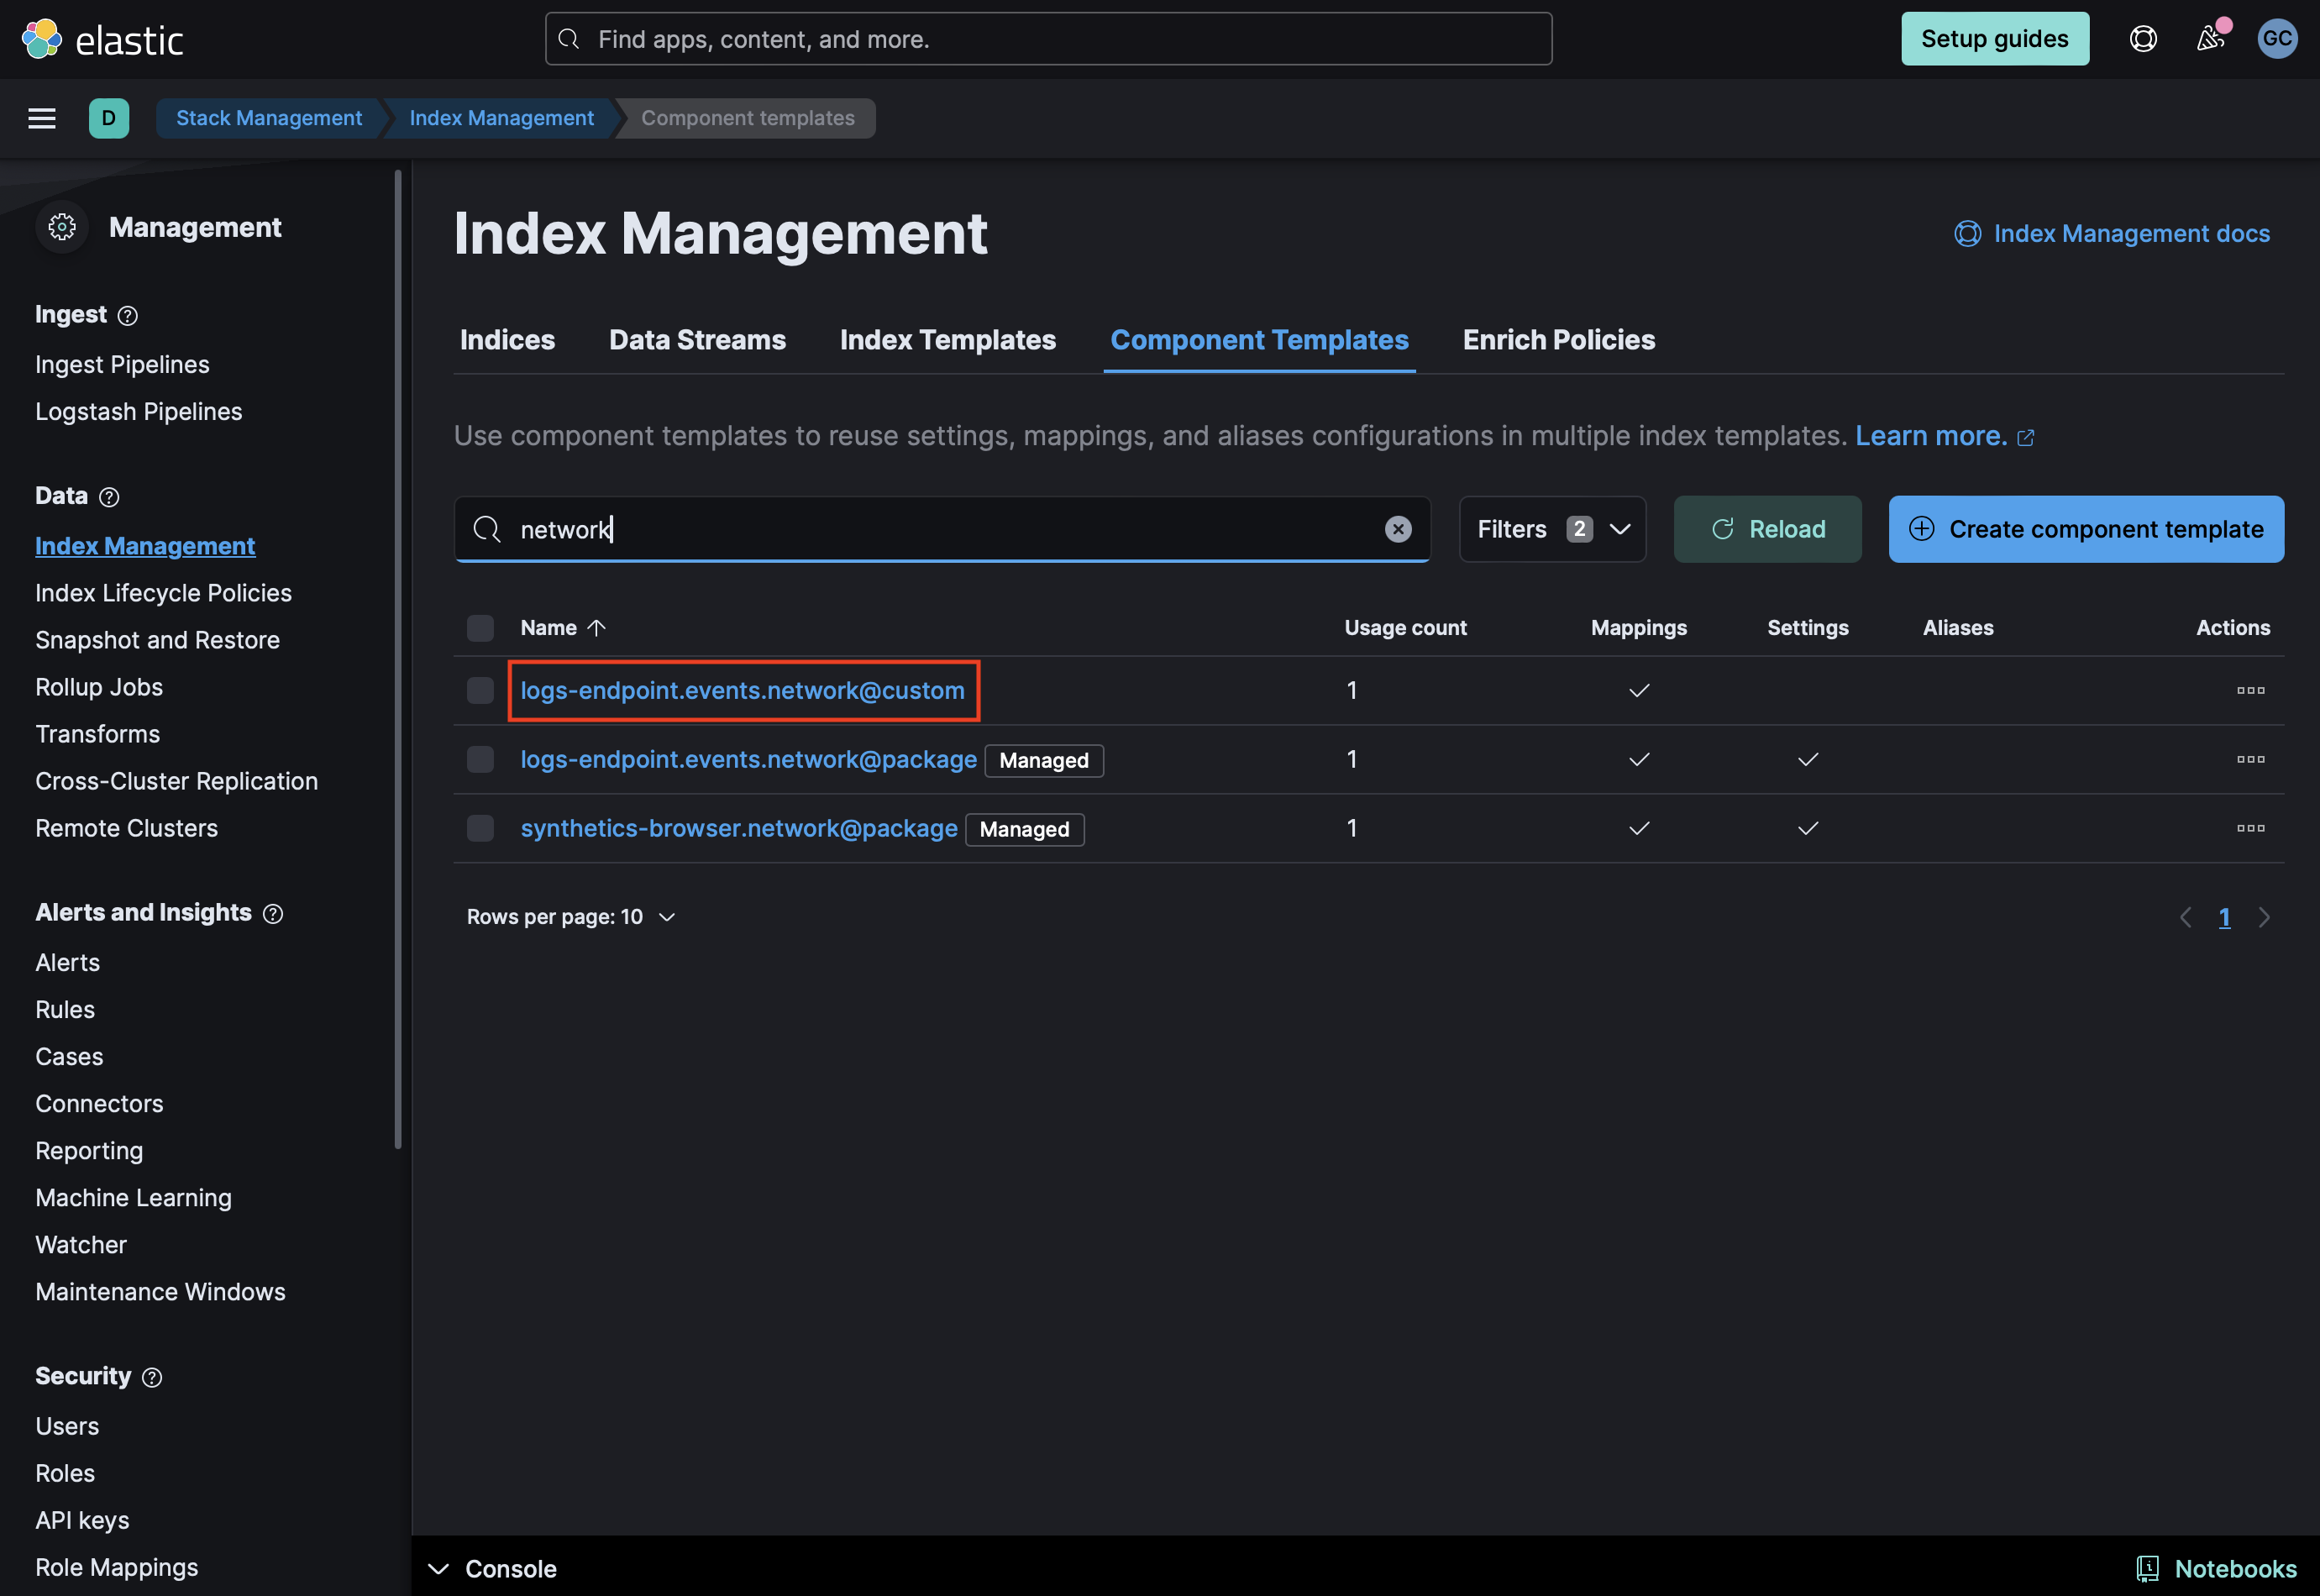
- If the
@customcomponent template does not exist, you can execute the following command in the Dev Console to create it and then continue to the Rollover section in these instructions.PUT _component_template/{COMPONENT_TEMPLATE_NAME}@custom { "template": { "mappings": { "properties": { "ml_is_dga": { "type": "object", "properties": { "malicious_prediction": { "type": "long" }, "malicious_probability": { "type": "float" } } } } } } } - If the
@customcomponent template already exists, you will need to edit it to add mappings for data to be properly enriched. Click the three dots next to it and select Edit.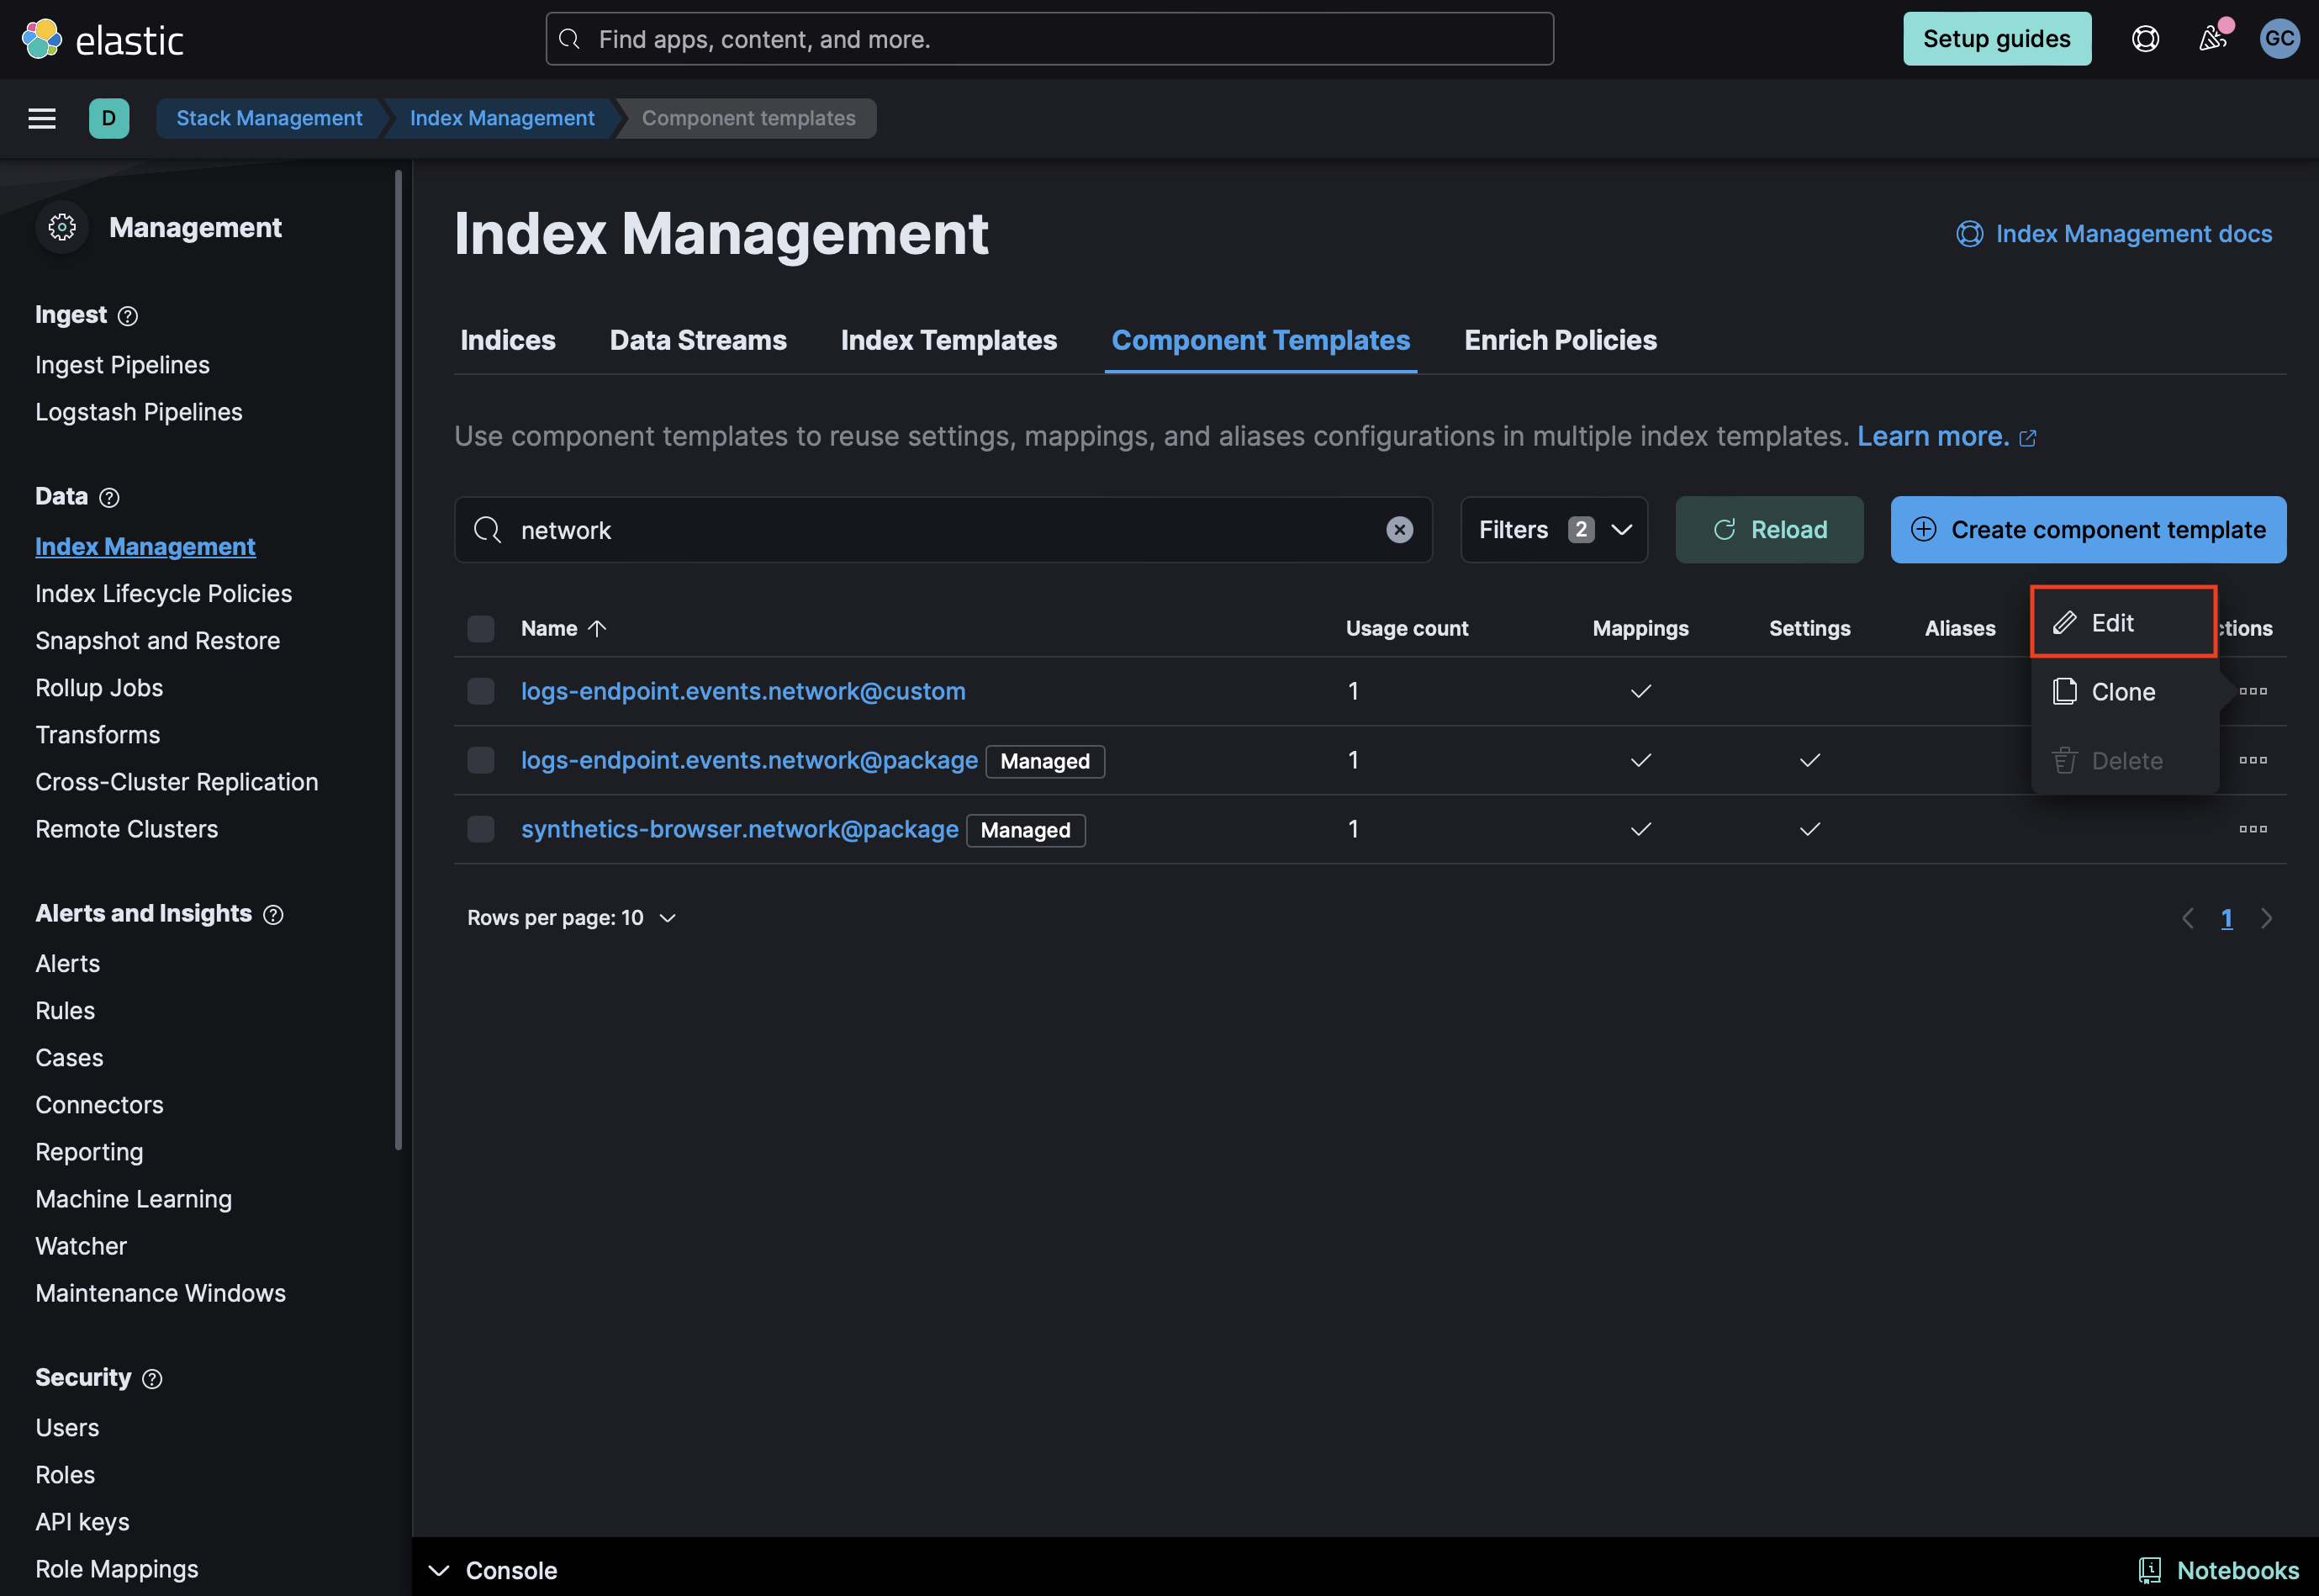
- Proceed to the mappings step in the UI. Click Add Field at the bottom of the page and create an an
Objectfield forml_is_dga.
- Finally create two properties under
ml_is_dga.
- The first for
malicious_predictionof typeLongand then formalicious_probabilityor typeFloat.
- Your component mappings should look like the following:

- Click Review then Save Component Template.
- If the
- Rollover Depending on your environment, you may need to rollover in order for these mappings to get picked up. The deault index pattern for Elastic Defend is
logs-endpoint.events.network-default.POST INDEX_NAME/_rollover - (Optional) Create a data view for your network logs.
- Add preconfigured anomaly detection jobs: In Stack Management -> Anomaly Detection Jobs, you will see Select data view or saved search. Select the data view created in the previous step. Then under
Use preconfigured jobsyou will seeDGA. When you select the card, you will see a pre-configured anomaly detection job that you can create. Note this job is only useful for indices that have been enriched by the ingest pipeline. - Enable detection rules: You can also enable detection rules to alert on DGA activity in your environment, based on anomalies flagged by the above ML jobs. As of version 2.0.0 of this package, these rules are available as part of the Detection Engine in Security > Rules, and can be found using the tag
Use Case: Domain Generated Algorithm Detection. See this documentation for more information on importing and enabling the rules. Warning: if the ingest pipeline hasn't run for some reason, such as no eligible data has come in yet, or the required mapping has not been added, you won't be able to see this card yet. If that is the case, try troubleshooting the ingest pipeline, and if any predictions have been populated yet.
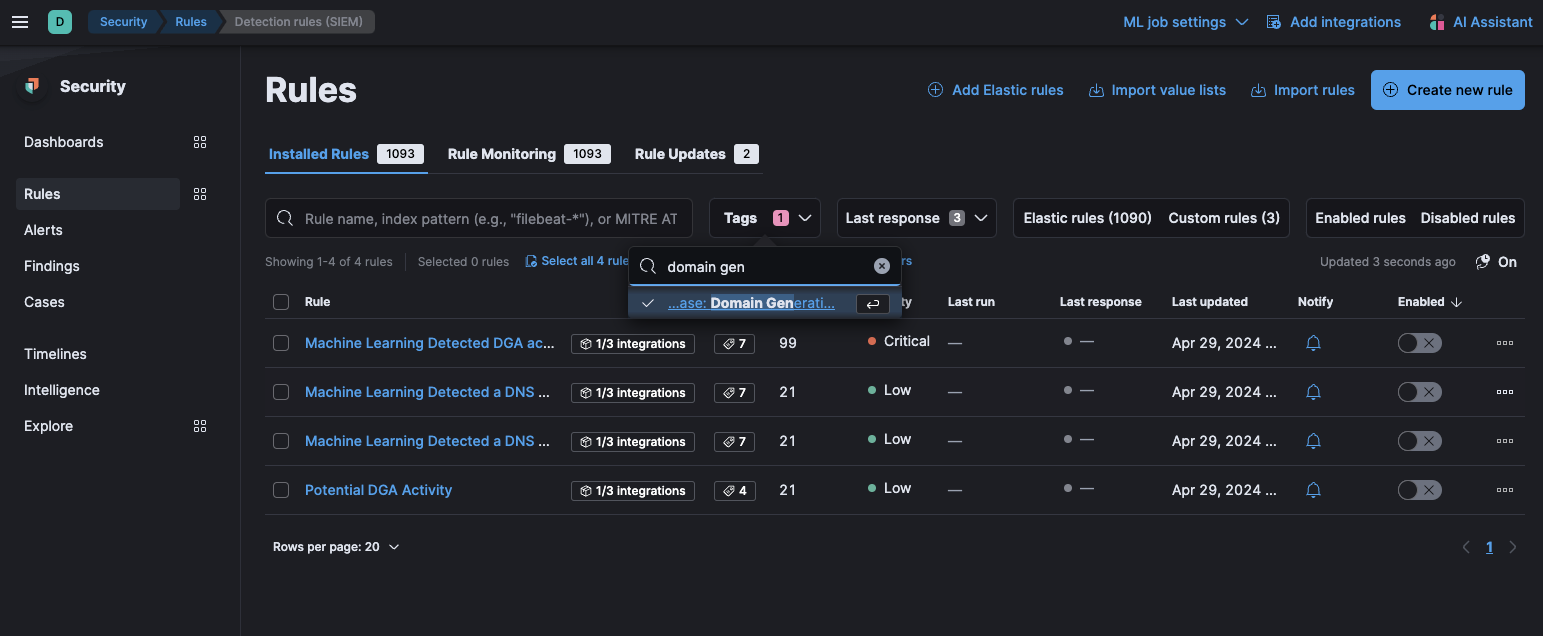 In Security > Rules, filtering with the “Use Case: Domain Generation Algorithm Detection” tag
| Job | Description |
|---|---|
| dga_high_sum_probability | Detects potential DGA (domain generation algorithm) activity that is often used by malware command and control (C2) channels. Looks for a source IP address making DNS requests that have an aggregate high probability of being DGA activity. |
To customize the datafeed query and other settings such as model memory limit, frequency, query delay, bucket span and influencers for the Domain Generation Algorithm Detection ML jobs, follow the steps below.
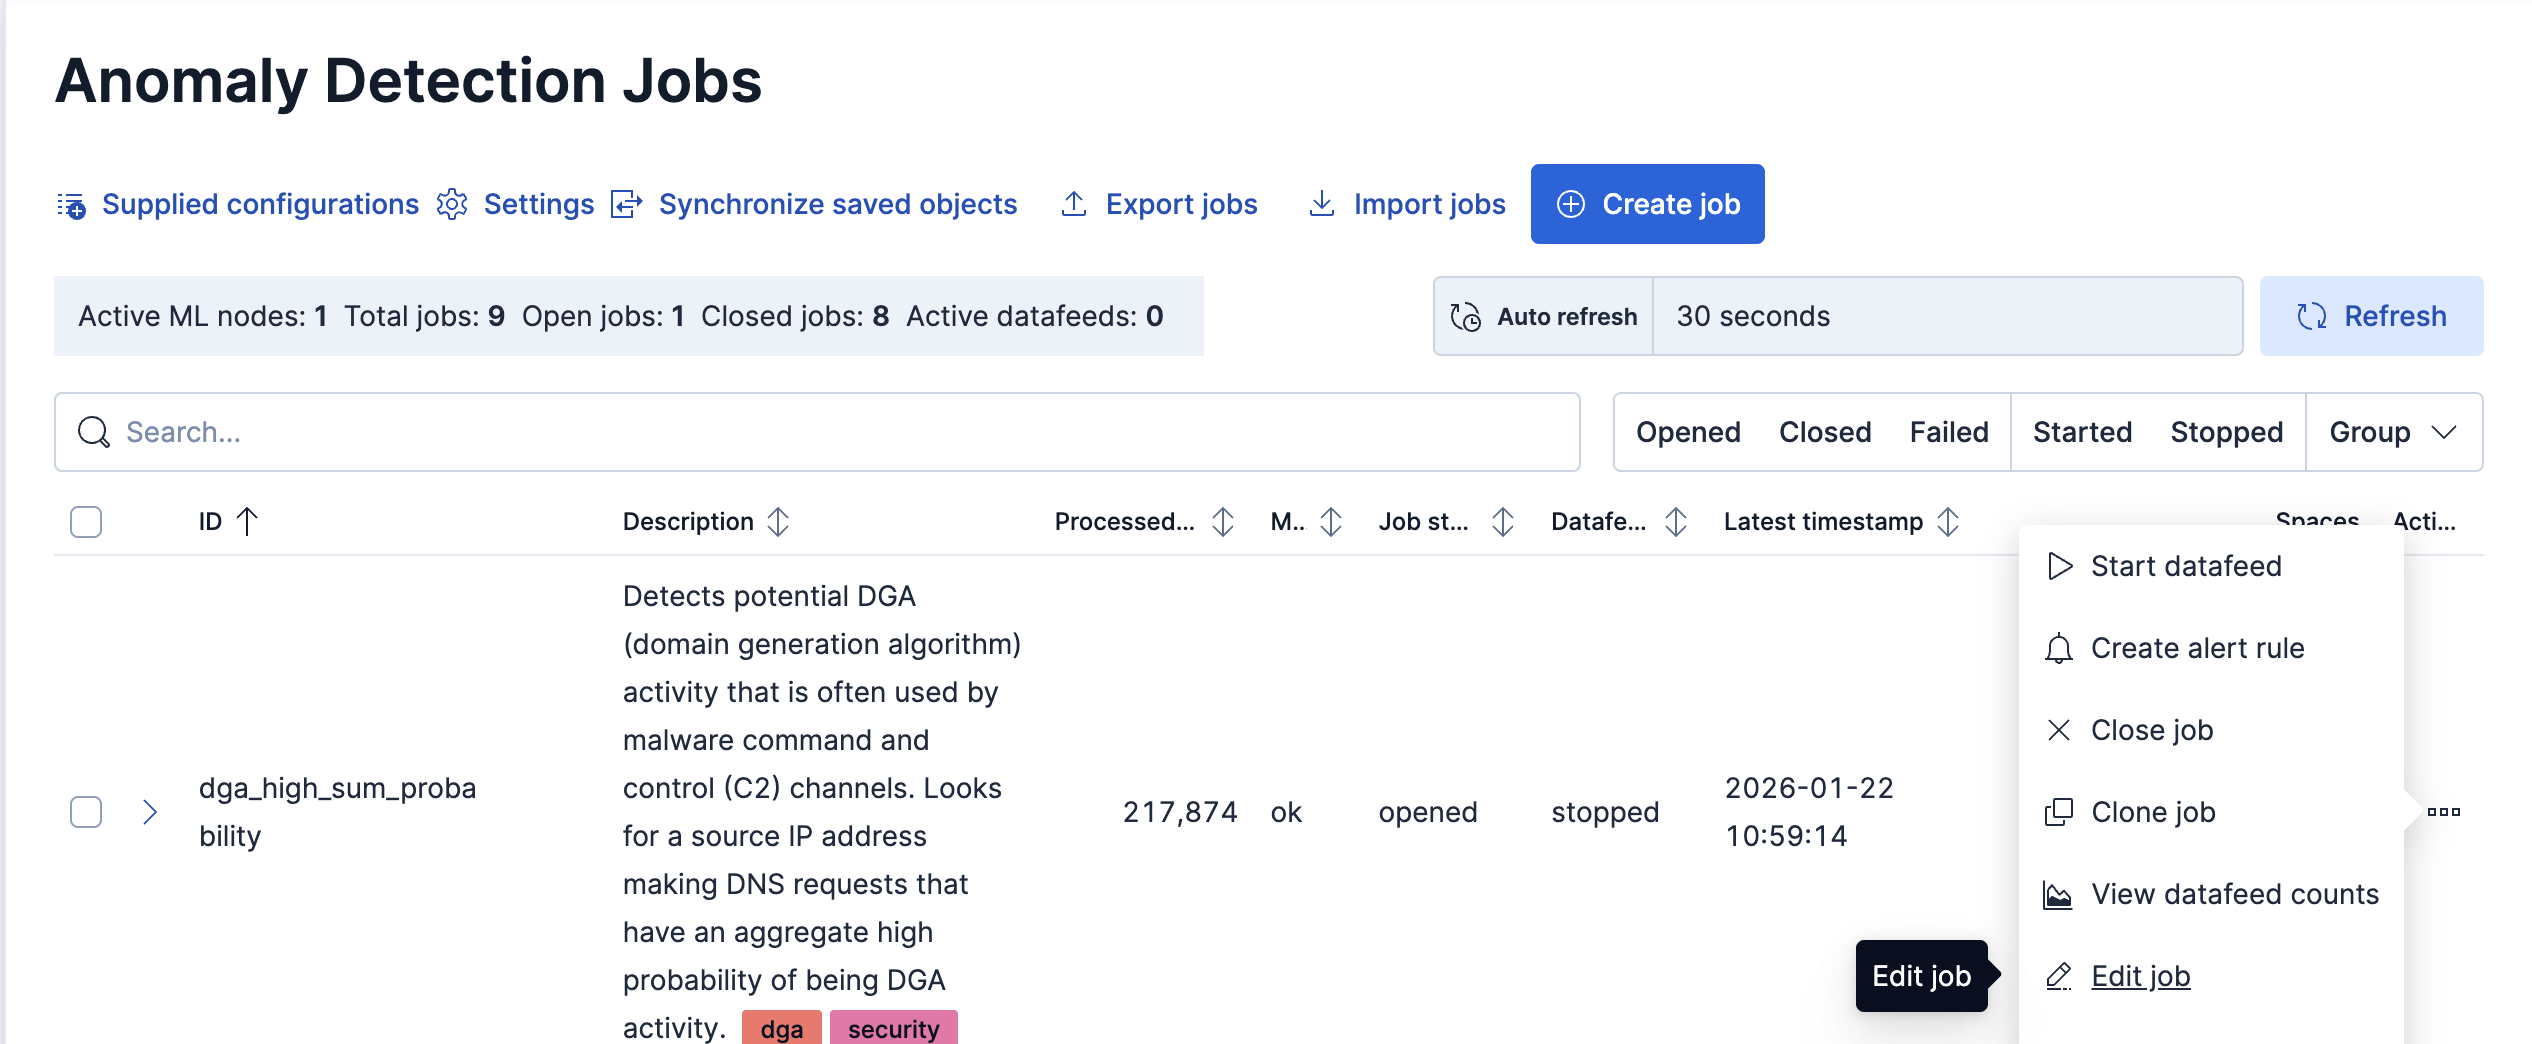
- To update the datafeed query, stop the datafeed and select Edit job from the Actions menu.
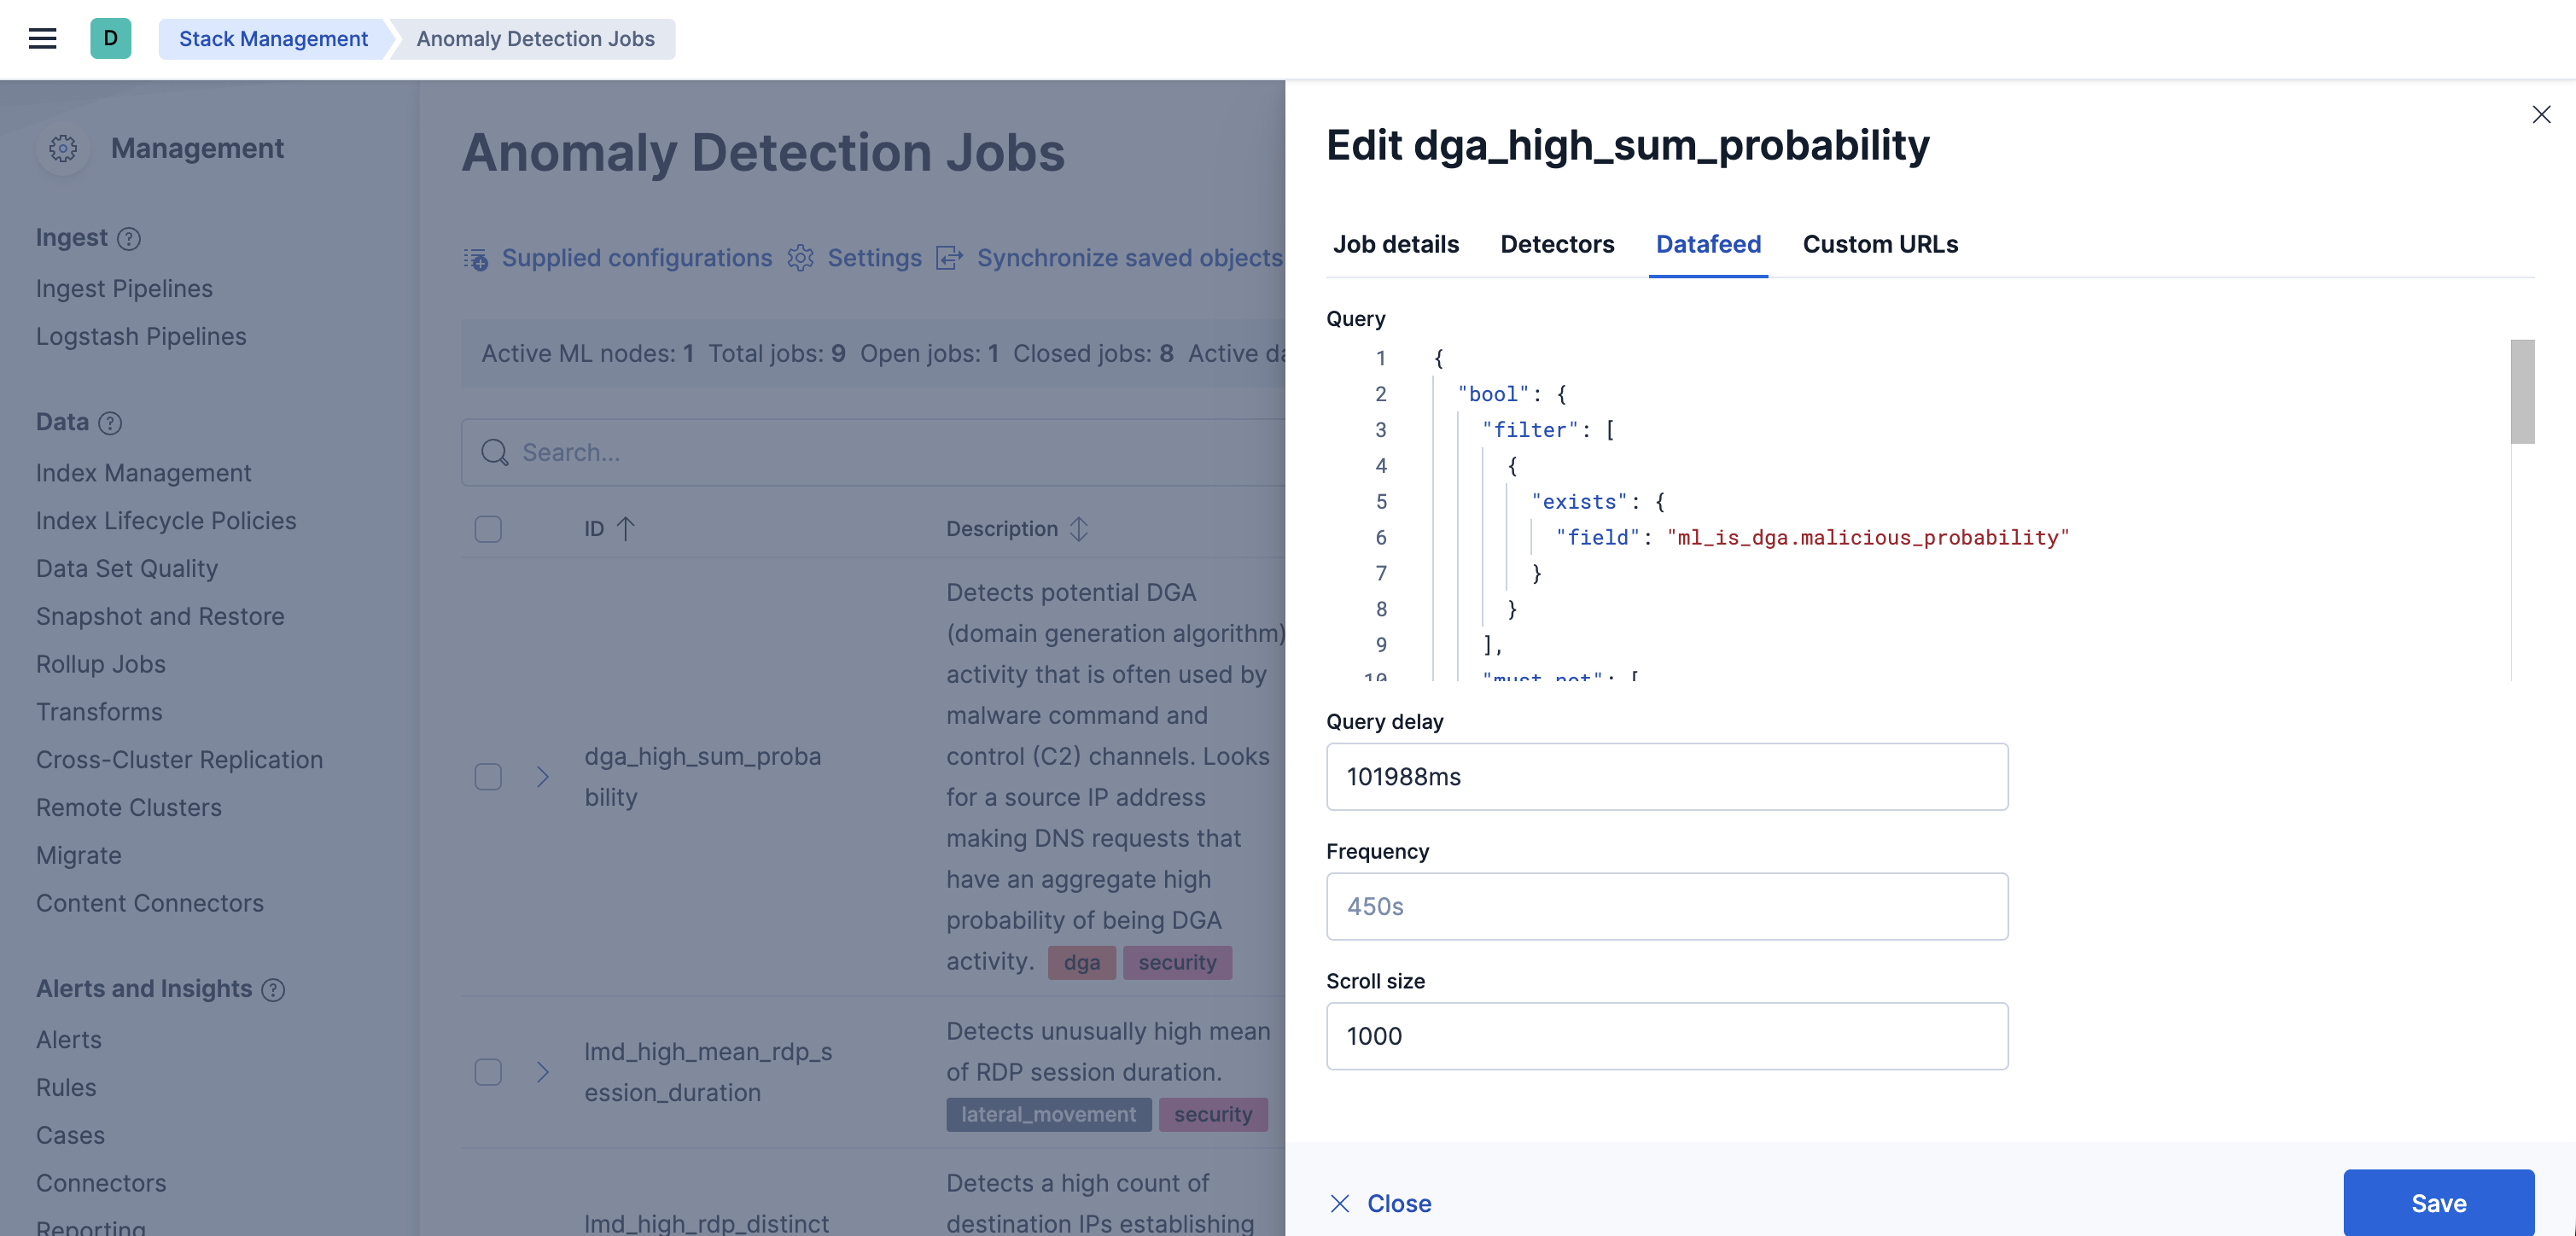
- In the Edit job window, navigate to the Datafeed section and update the query filters. You can add or remove field values to help reduce noise and false positives based on your environment.
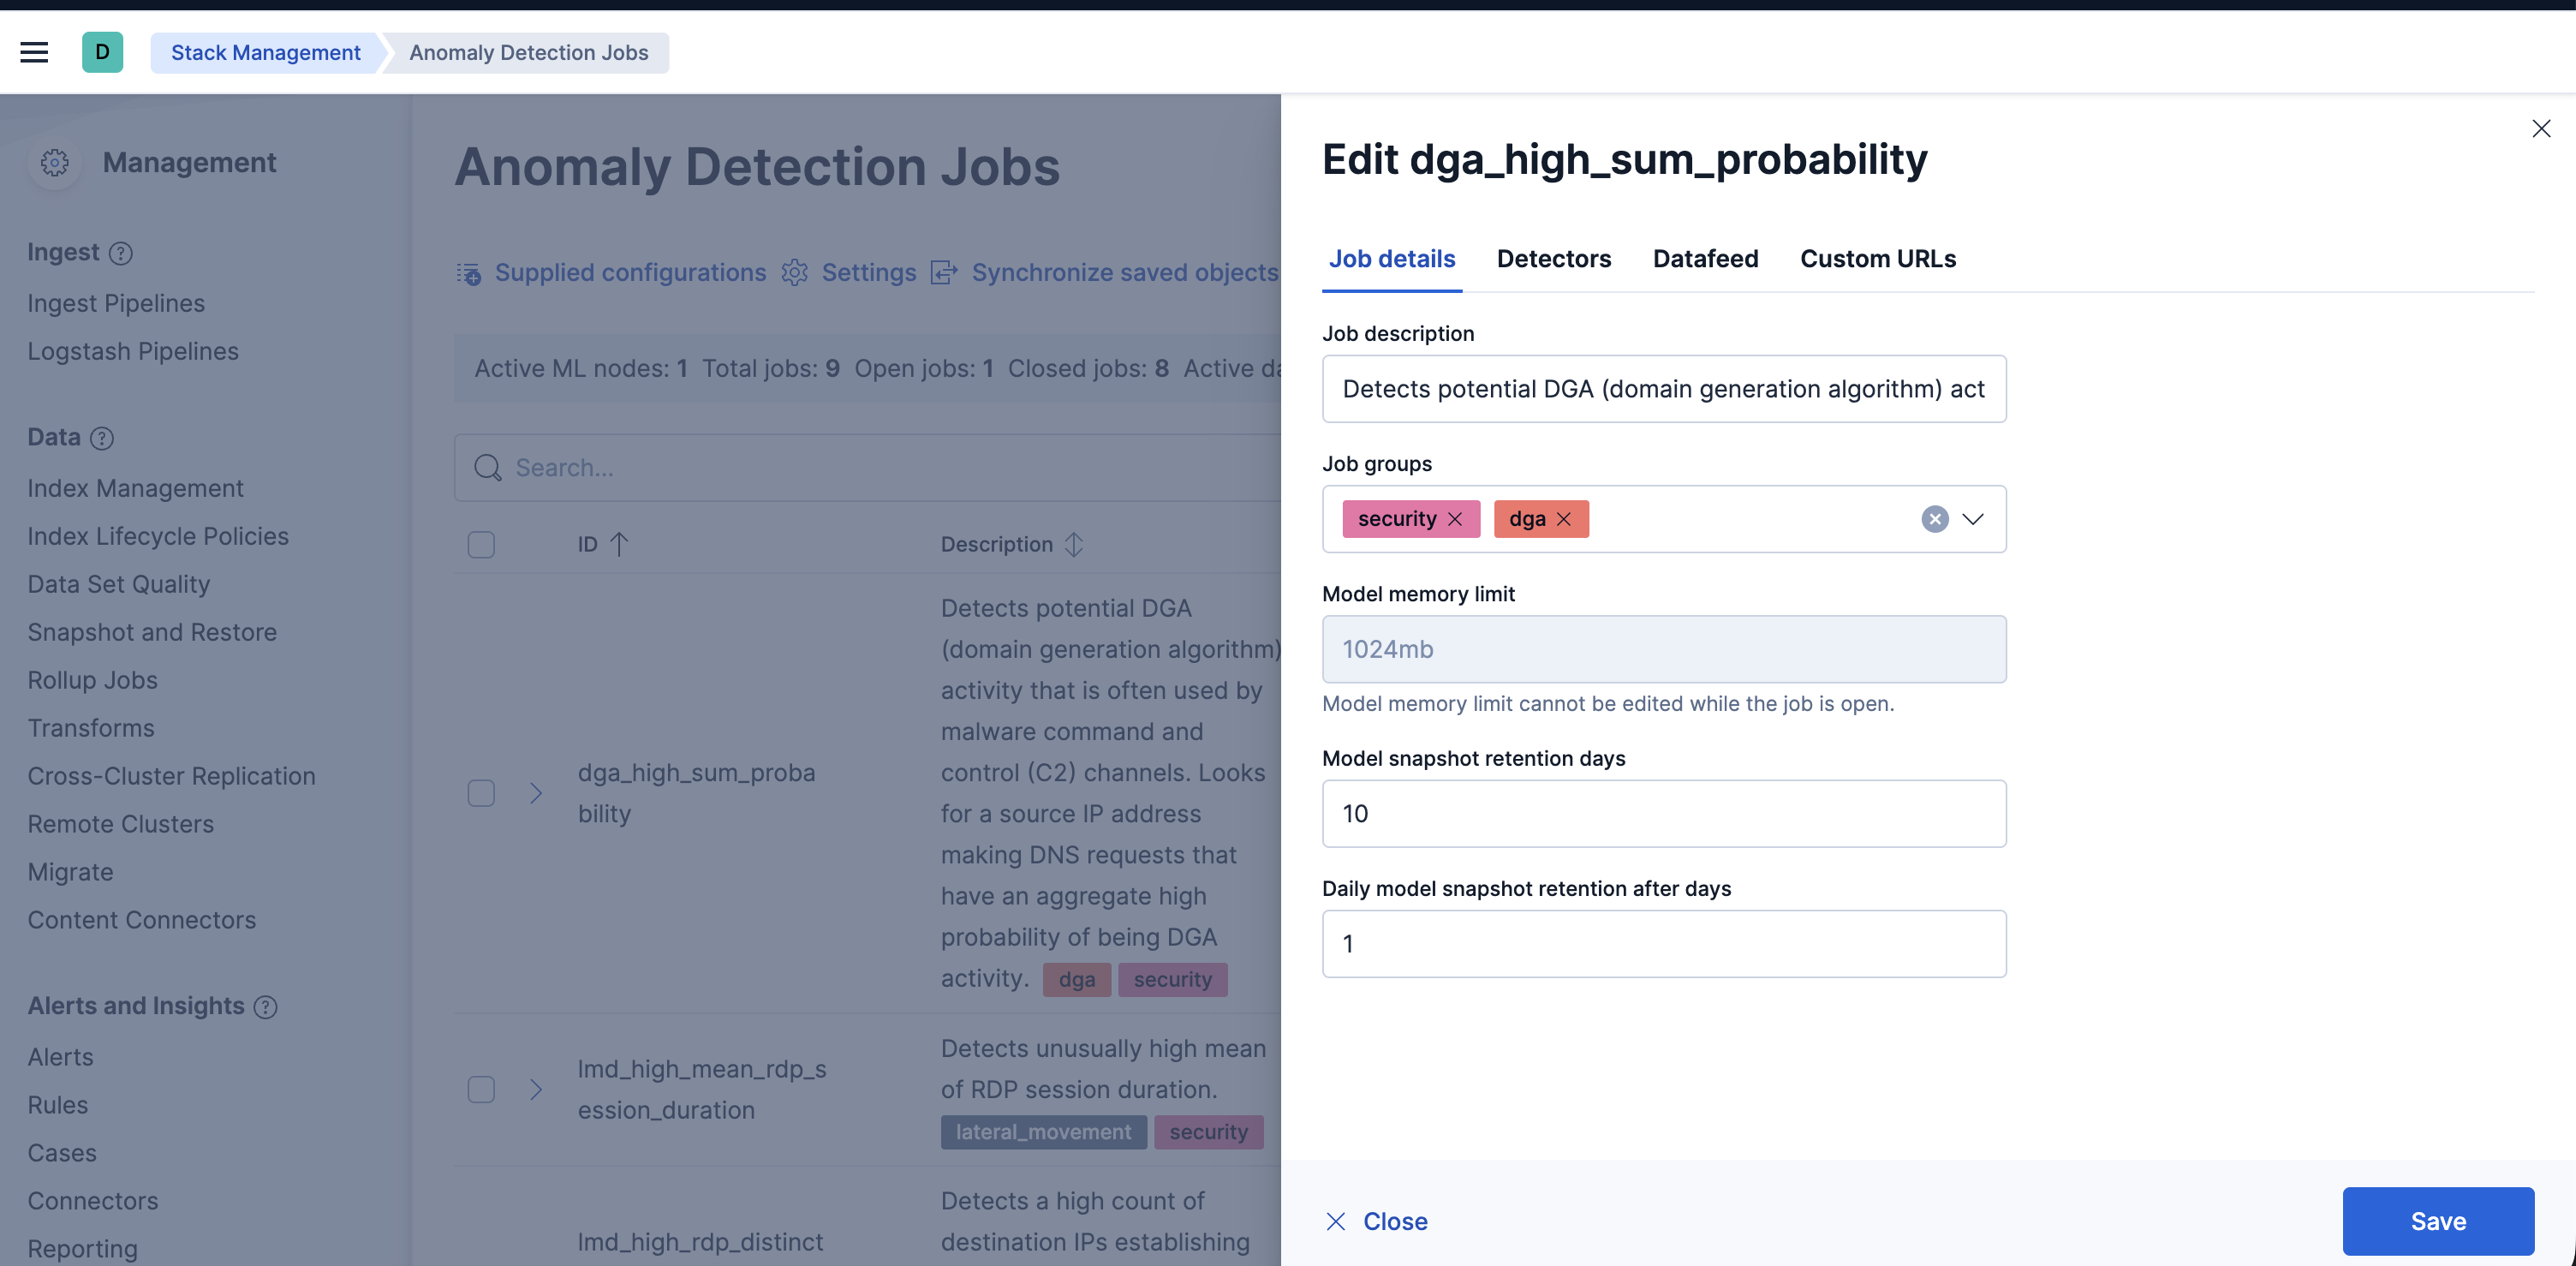
- You may also update the model memory limit if your environment has high data volume or if the job requires additional resources. Go to the Job details section and update the Model memory limit and hit Save. For more information on resizing ML jobs, refer to the documentation.
- In order to do more advanced changes to your job, clone the job by selecting Clone job from the Actions menu.
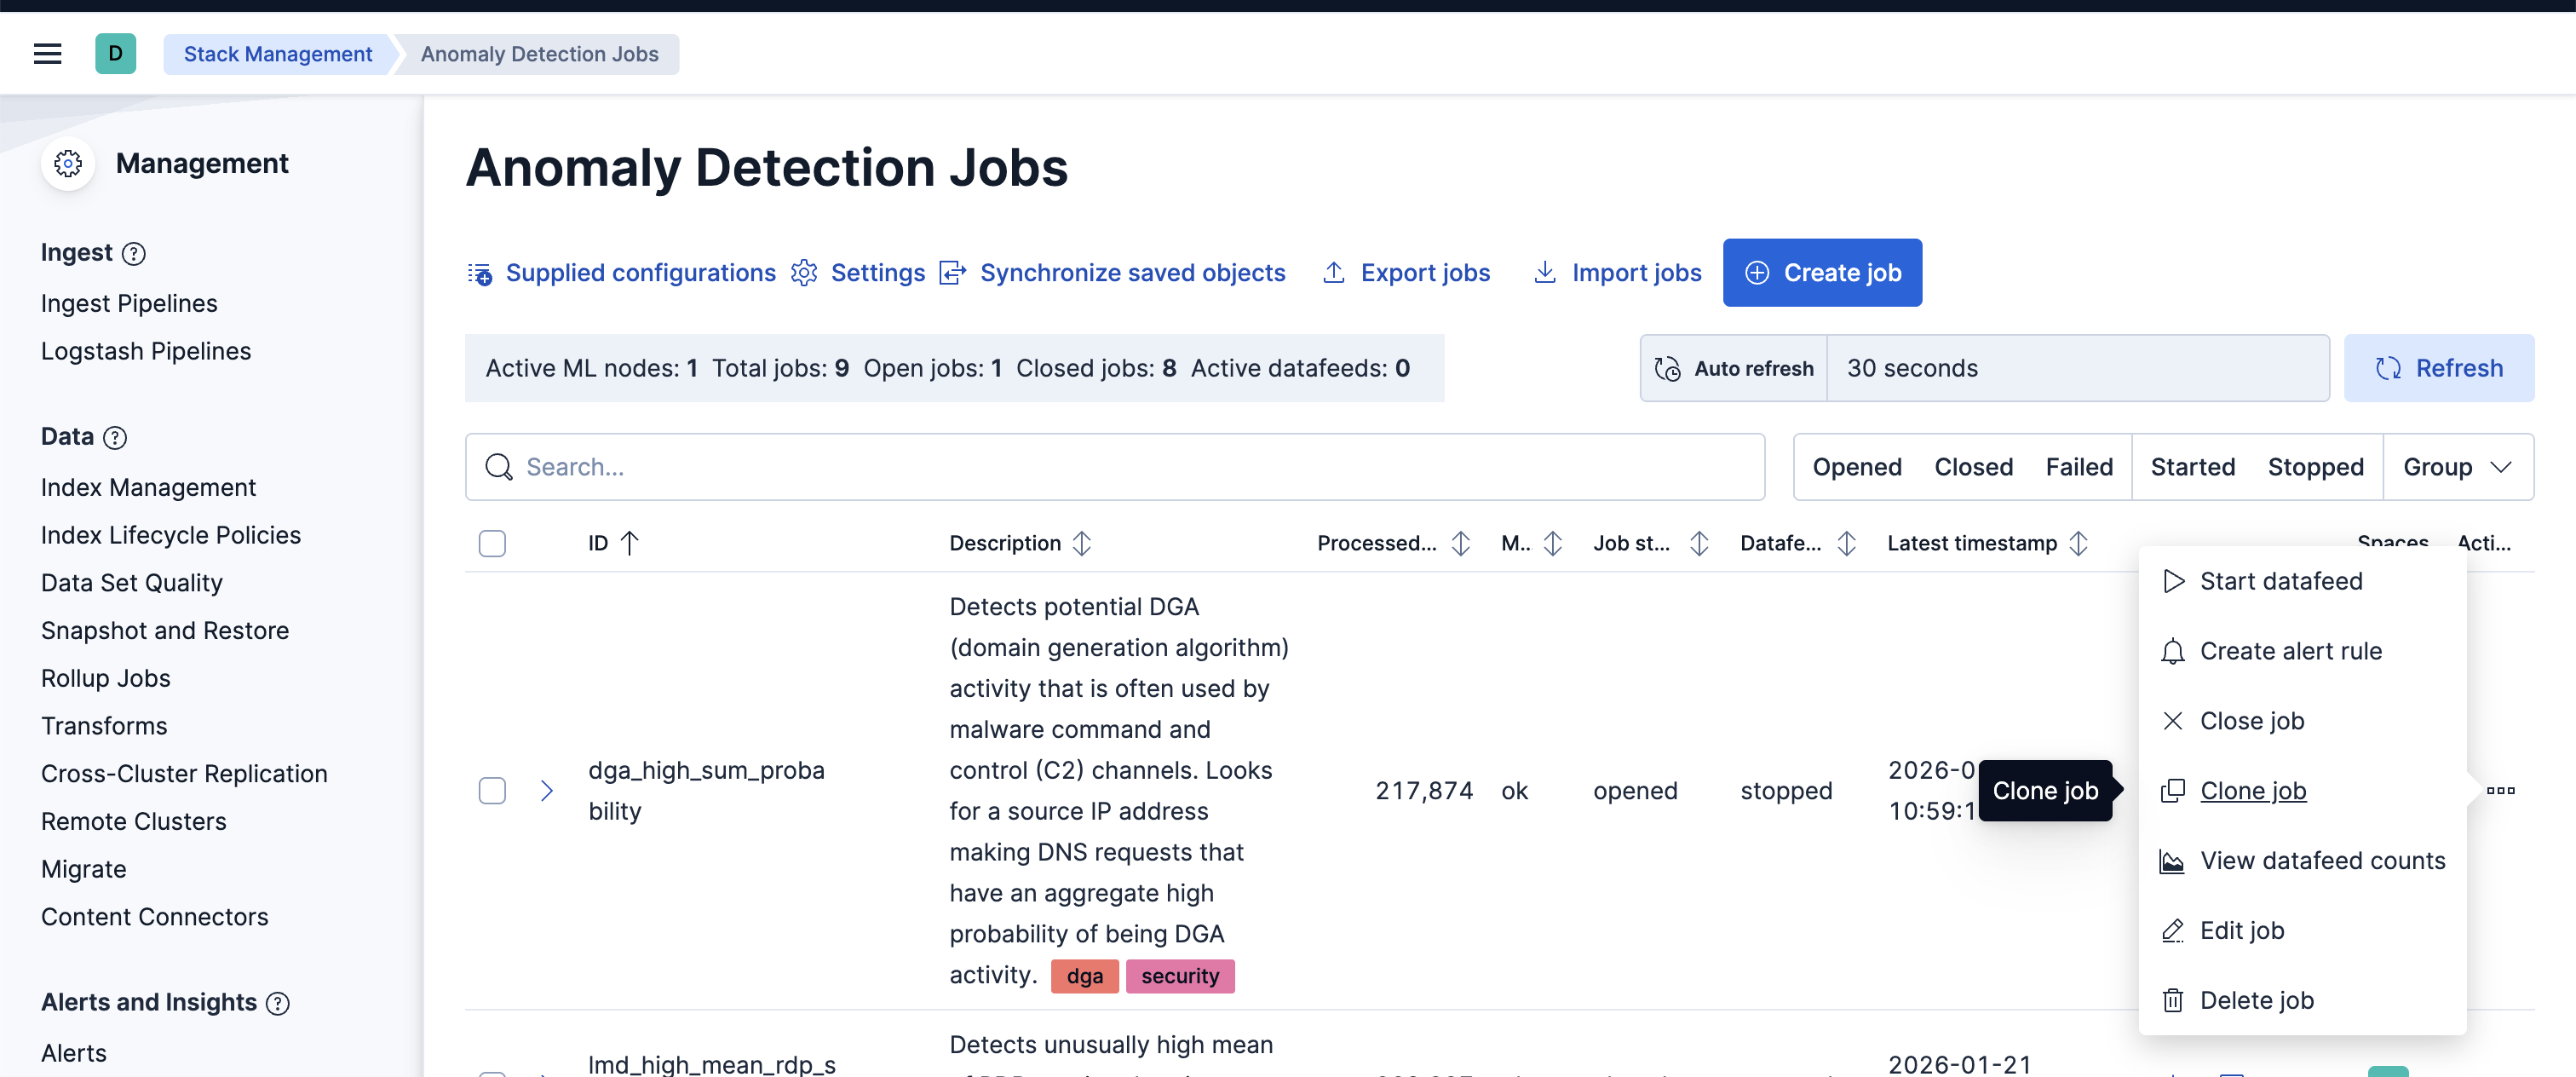
- In the cloned job, you can update datafeed settings such as Frequency and Query delay, which help control how often data is analyzed and account for ingestion delays.
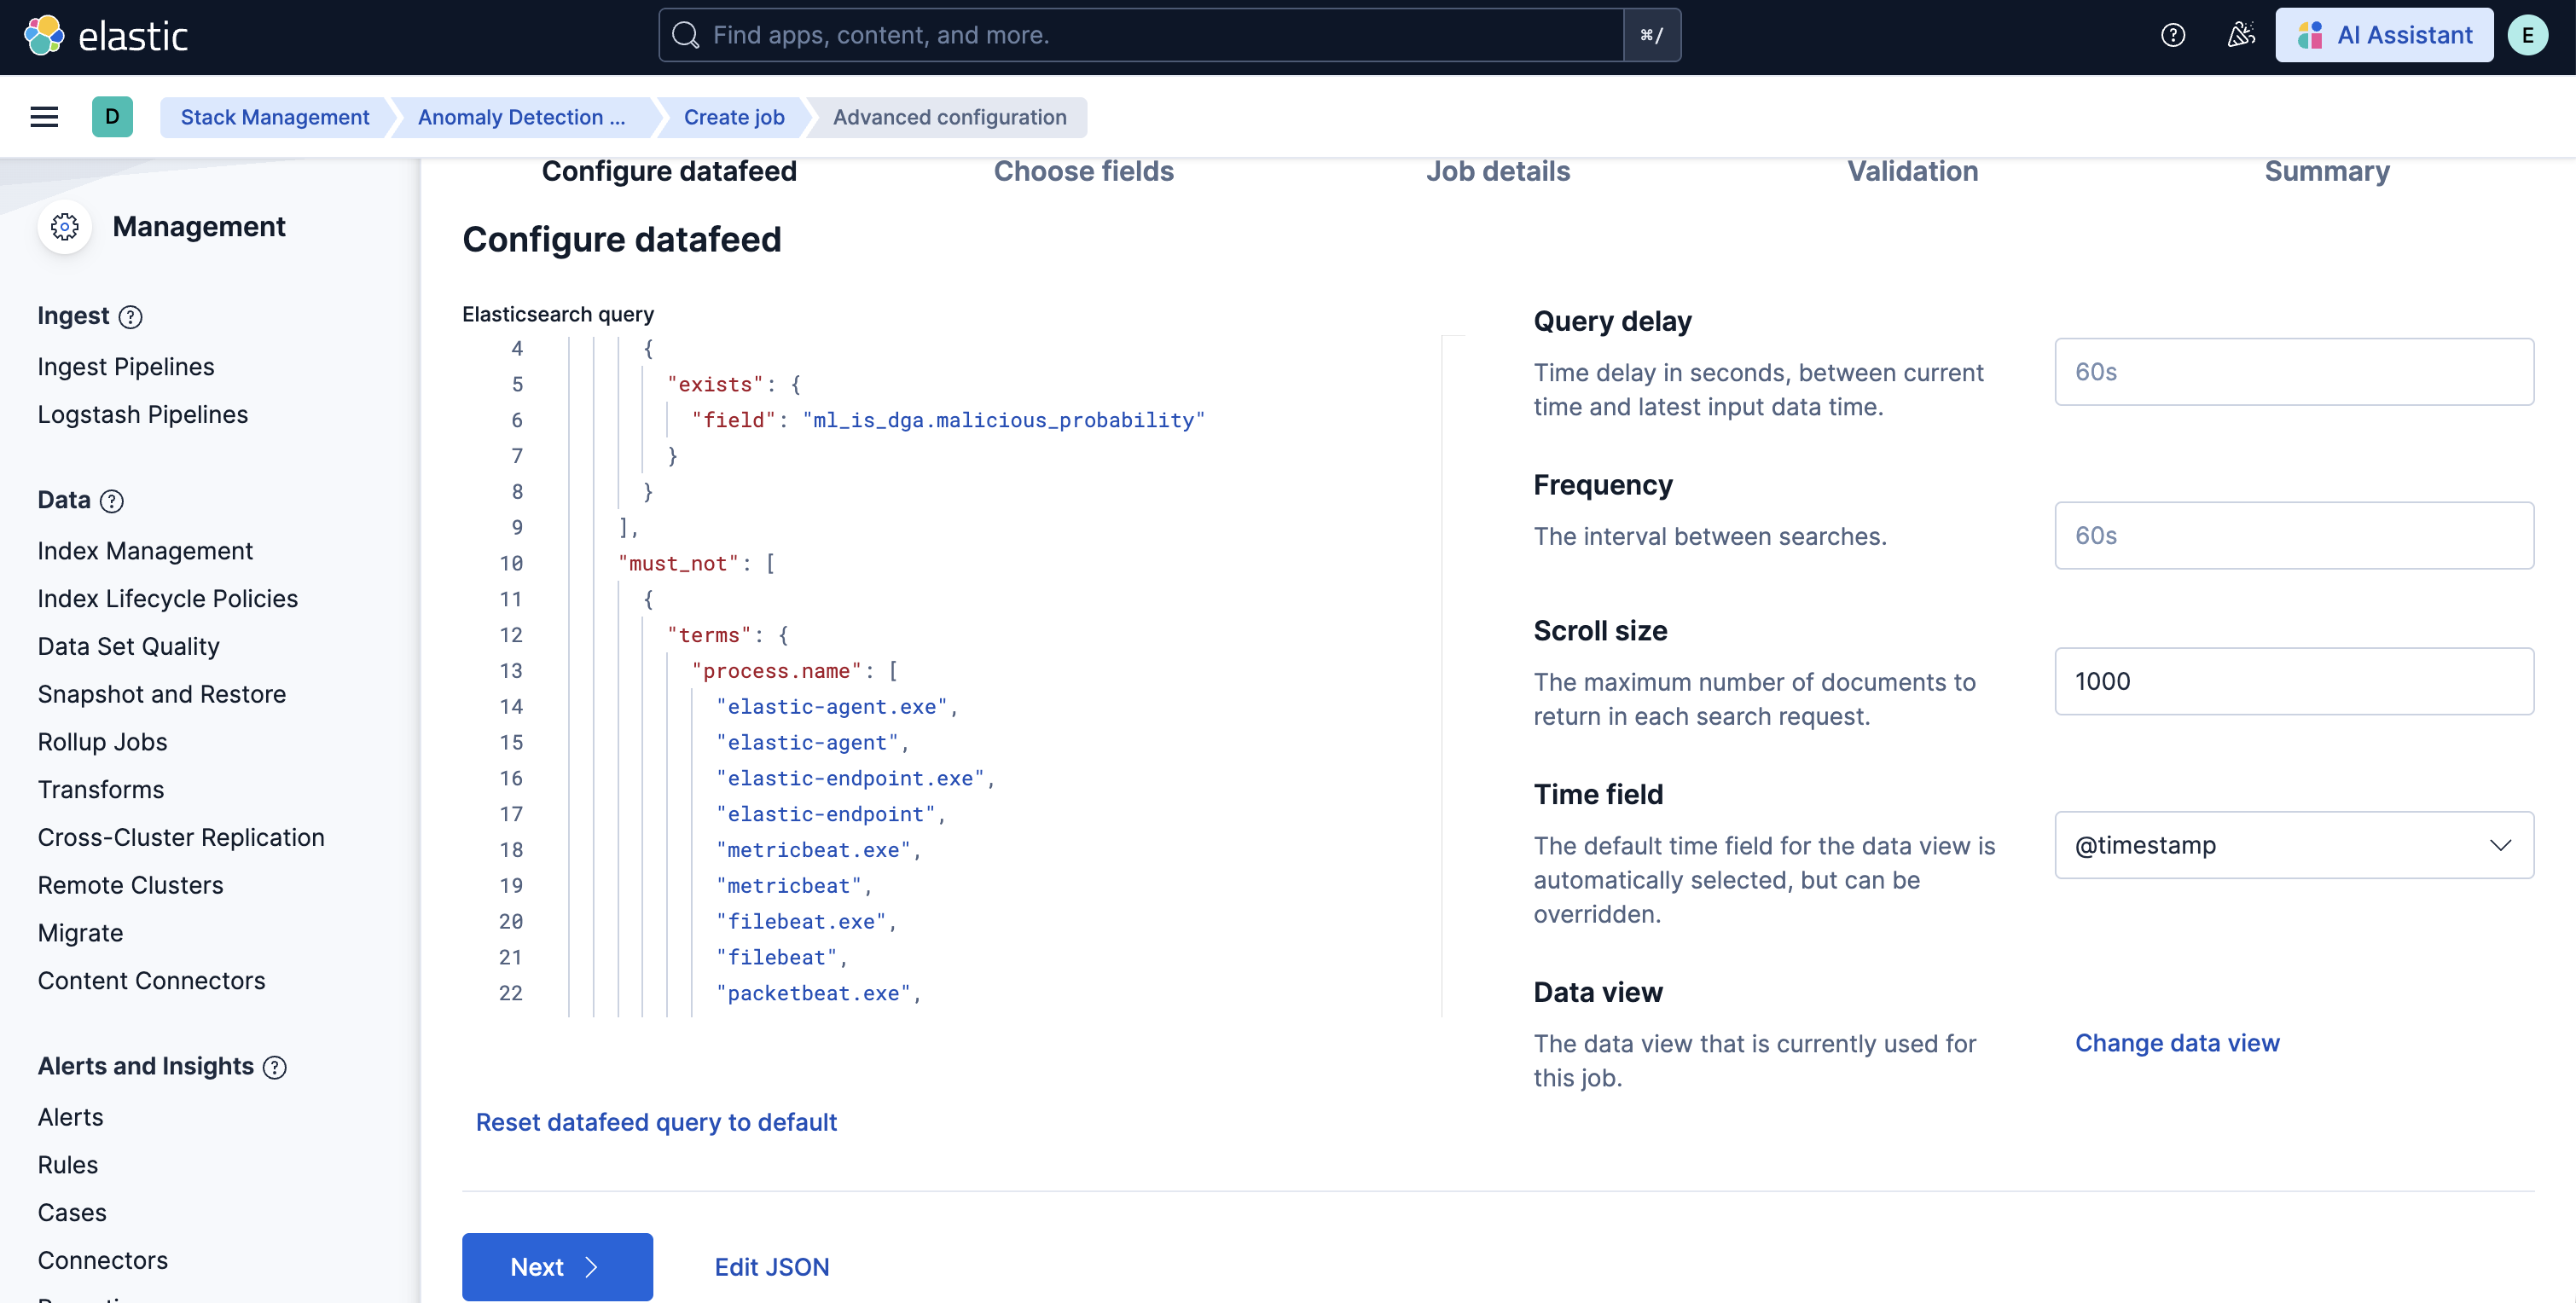
- You can also modify the job configuration by adjusting the Bucket span and by adding or removing Influencers to improve anomaly attribution.
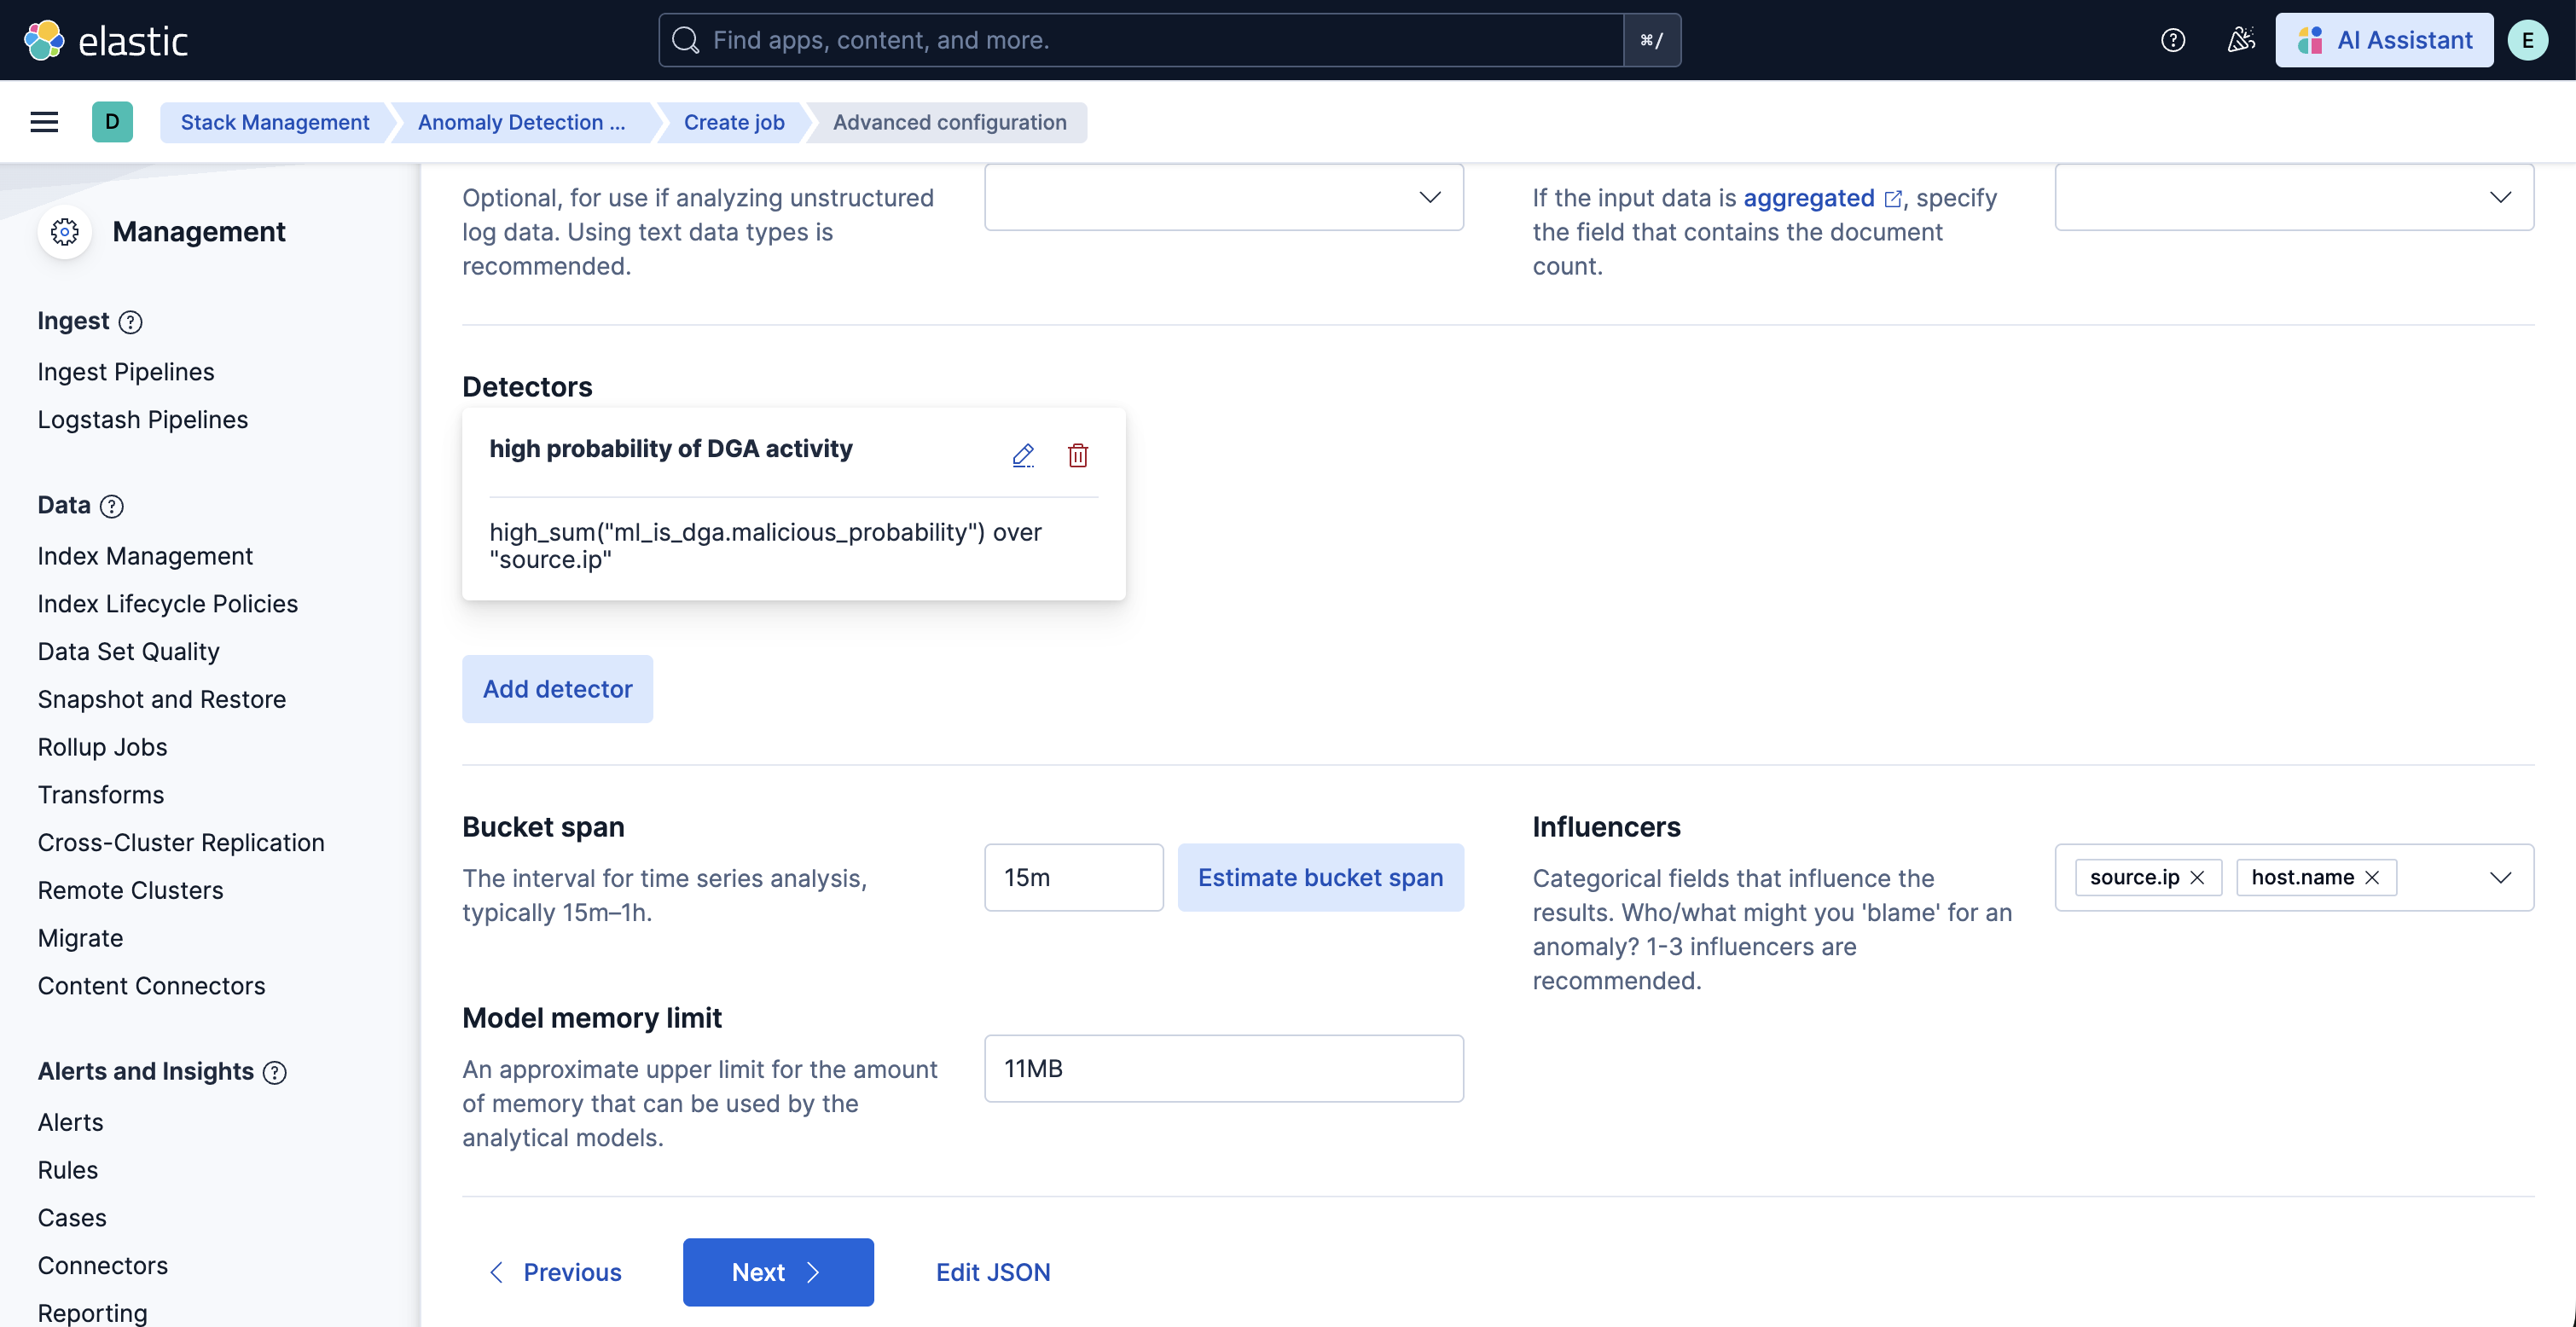
- Finally, assign a new Job ID, and click on Create job, and start the datafeed to apply the updated settings.
v2.0.0 of the package introduces breaking changes, namely deprecating detection rules from the package. To continue receiving updates to DGA Detection, we recommend upgrading to v2.0.0 after doing the following:
- Uninstall existing rules associated with this package: Navigate to Security > Rules and delete the following rules:
- Machine Learning Detected DGA activity using a known SUNBURST DNS domain
- Machine Learning Detected a DNS Request Predicted to be a DGA Domain
- Potential DGA Activity
- Machine Learning Detected a DNS Request With a High DGA Probability Score
Depending on the version of the package you're using, you might also be able to search for the above rules using the tag DGA
- Upgrade the DGA package to v2.0.0 using the steps here
- Install the new rules as described in the Enable detection rules section below
Usage in production requires that you have a license key that permits use of machine learning features.
This integration includes one or more Kibana dashboards that visualizes the data collected by the integration. The screenshots below illustrate how the ingested data is displayed.
Changelog
| Version | Details | Minimum Kibana version |
|---|---|---|
| 2.3.5 | Enhancement (View pull request) Update package docs with customization steps for ML jobs and transforms |
9.0.0 8.9.0 |
| 2.3.4 | Bug fix (View pull request) Add filtering for Elastic endpoint agents |
9.0.0 8.9.0 |
| 2.3.3 | Bug fix (View pull request) Remove instructions to change the default_pipeline for an index |
9.0.0 8.9.0 |
| 2.3.2 | Bug fix (View pull request) Correct typo in Readme |
9.0.0 8.9.0 |
| 2.3.1 | Enhancement (View pull request) Update platform support docs |
9.0.0 8.9.0 |
| 2.3.0 | Enhancement (View pull request) Add exclusions for Elastic endpoint agents |
9.0.0 8.9.0 |
| 2.2.0 | Enhancement (View pull request) Add support for Kibana 9.0.0 |
9.0.0 8.9.0 |
| 2.1.1 | Enhancement (View pull request) Add agent policy documentation |
8.9.0 |
| 2.1.0 | Enhancement (View pull request) Update spec version to 3.0.4 |
8.9.0 |
| 2.0.4 | Bug fix (View pull request) Add fields for integration package testing |
8.9.0 |
| 2.0.3 | Bug fix (View pull request) Add mapping instructions |
8.9.0 |
| 2.0.2 | Enhancement (View pull request) Improve package installation documentation |
8.9.0 |
| 2.0.1 | Enhancement (View pull request) Add query settings to ignore frozen and cold data tiers |
8.9.0 |
| 2.0.0 | Enhancement (View pull request) Removing detection rules from the package, bumped license and format versions, subscription tier |
8.9.0 |
| 1.1.0 | Enhancement (View pull request) Ensure event.kind is correctly set for pipeline errors |
8.0.0 |
| 1.0.1 | Enhancement (View pull request) Add the Advanced Analytics (UEBA) subcategory |
8.0.0 |
| 1.0.0 | Enhancement (View pull request) Update version number to follow GA format and to improve visibility |
8.0.0 |
| 0.0.5 | Enhancement (View pull request) Added categories and/or subcategories. |
— |
| 0.0.4 | Enhancement (View pull request) Clean up ML job groups and rule tags, change release to ga, documentation updates |
— |
| 0.0.3 | Bug fix (View pull request) Add a DGA tag to all rules, fix n-gram generation logic, remove a reference to a non-existent ML job in one of the rules. |
— |
| 0.0.2 | Bug fix (View pull request) Update DGA integration Readme |
— |
| 0.0.1 | Enhancement (View pull request) Initial release of the package |
— |
