ActiveMQ Integration
| Version | 1.9.0 (View all) |
| Subscription level What's this? |
Basic |
| Developed by What's this? |
Elastic |
| Ingestion method(s) | File, Jolokia |
| Minimum Kibana version(s) | 9.0.0 8.13.0 |
Apache ActiveMQ is the most popular open-source, multi-protocol, Java-based message broker. It supports industry-standard protocols, facilitating client choices across various languages and platforms, including JavaScript, C, C++, Python, .Net, and more. ActiveMQ enables seamless integration of multi-platform applications through the widely used AMQP protocol and allows efficient message exchange between web applications using STOMP over WebSockets. Additionally, it supports IoT device management via MQTT and provides flexibility to accommodate any messaging use case, supporting both existing JMS infrastructure and beyond.
Use the ActiveMQ integration to:
- Collect logs related to the audit and ActiveMQ instance and collect metrics related to the broker, queue and topic.
- Create visualizations to monitor, measure and analyze the usage trend and key data, and derive business insights.
- Create alerts to reduce the MTTD and also the MTTR by referencing relevant logs when troubleshooting an issue.
The ActiveMQ integration collects logs and metrics data.
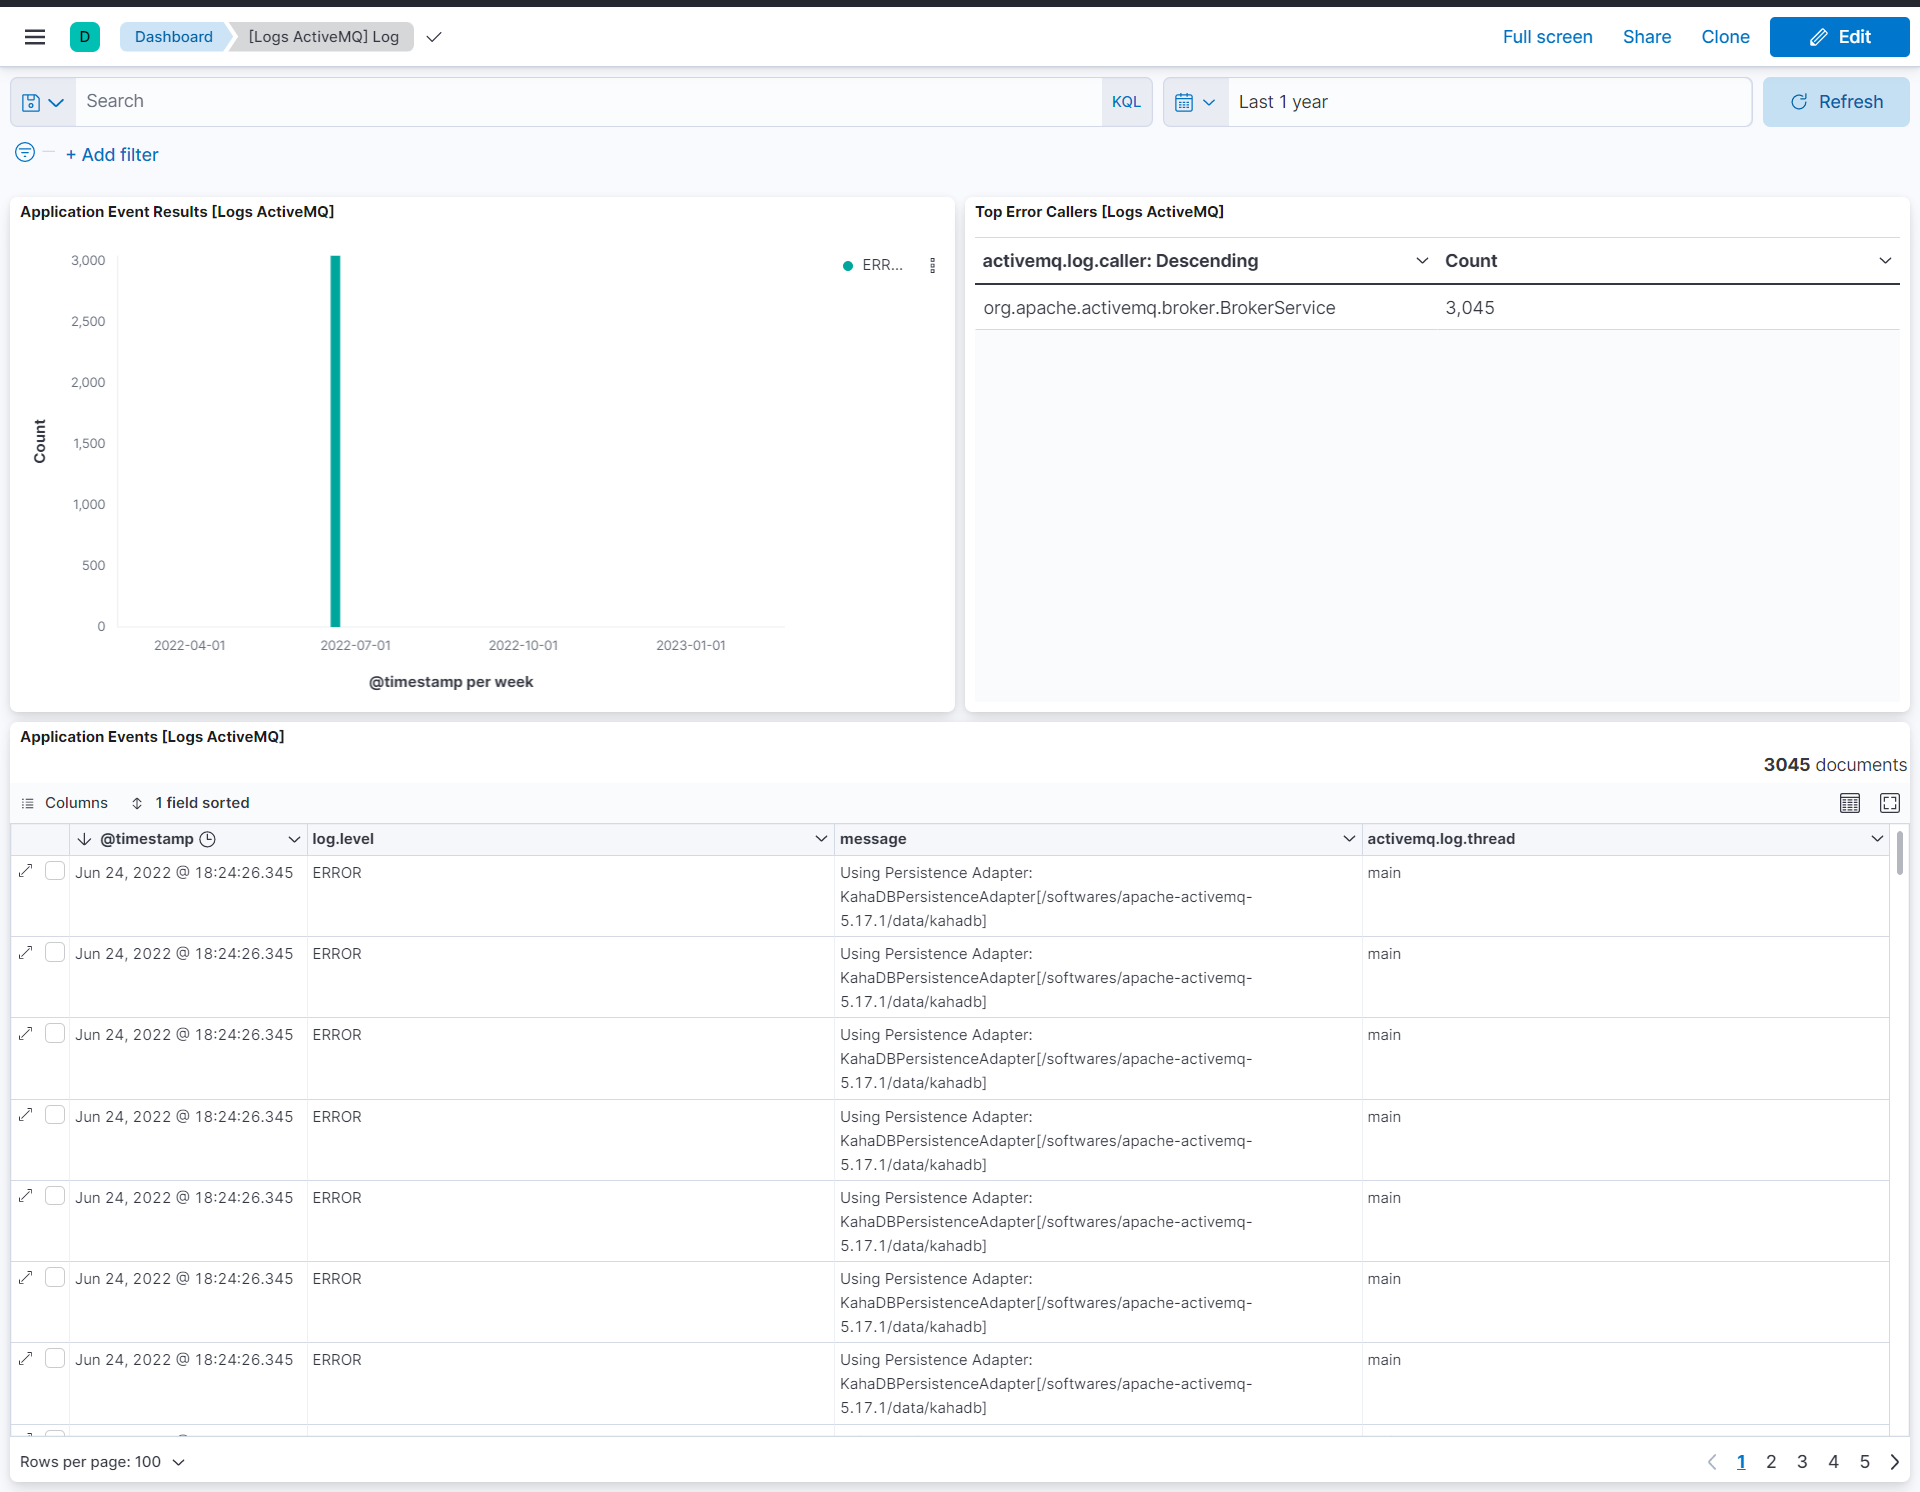
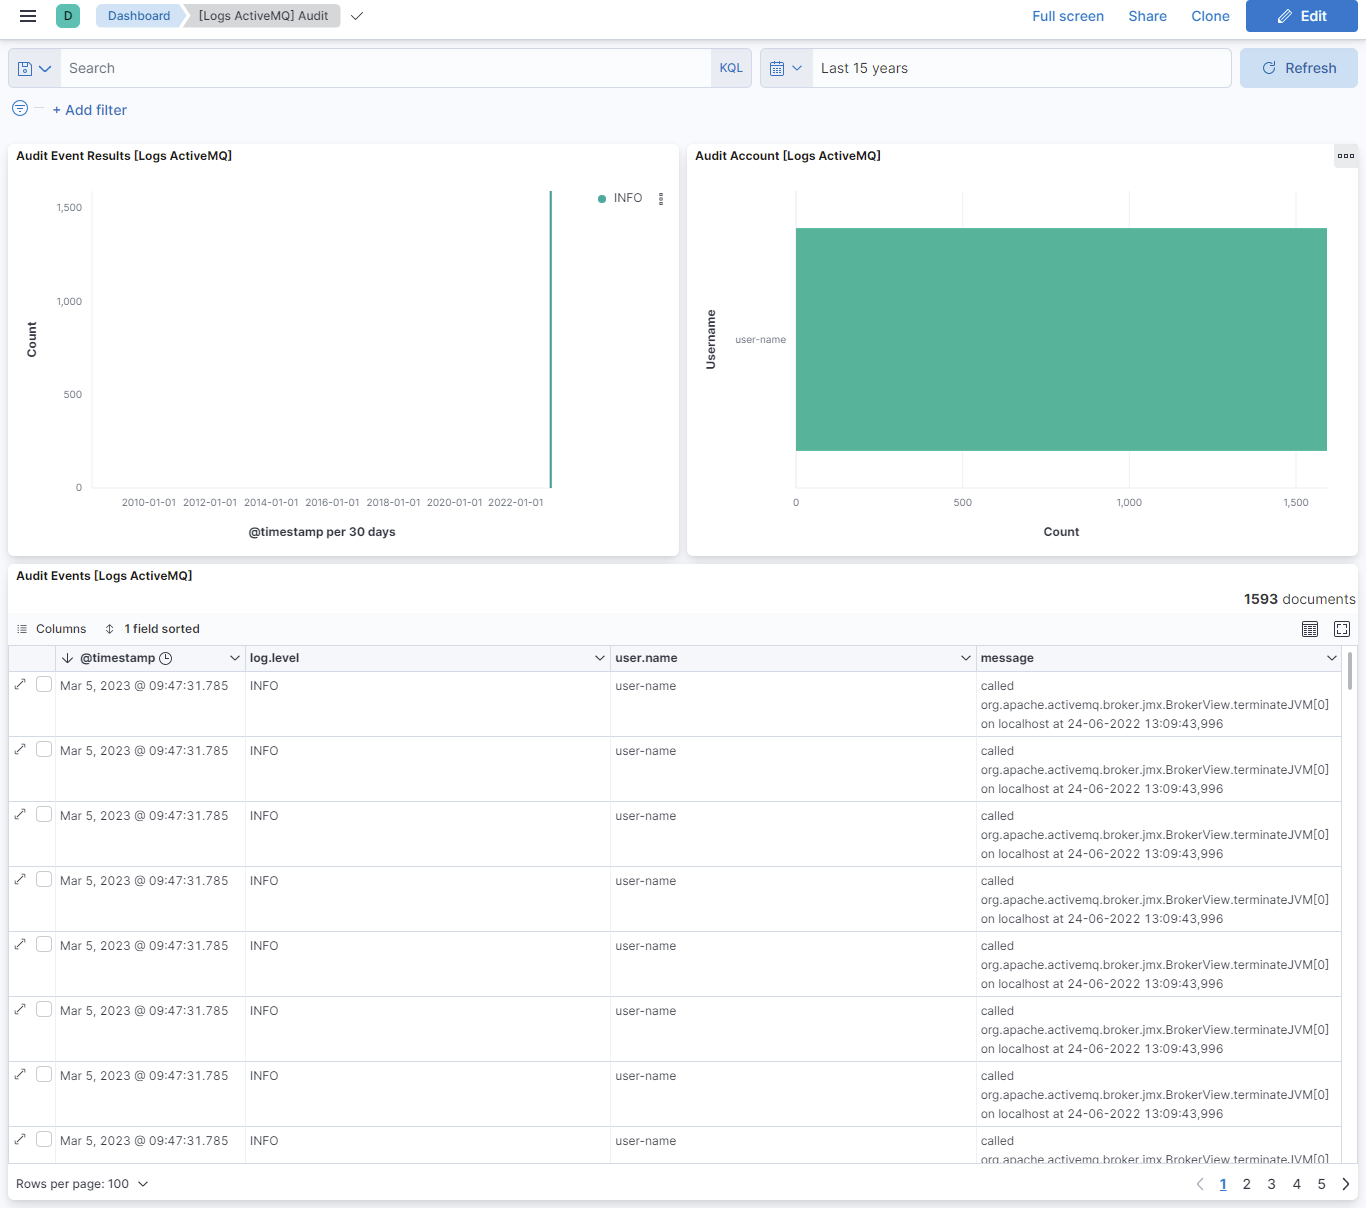
Logs help you keep a record of events that happen on your machine. The Log data streams collected by ActiveMQ integration are audit and log so that users can keep track of the username, audit threads, messages, name of the caller issuing the logging requests, logging event etc.
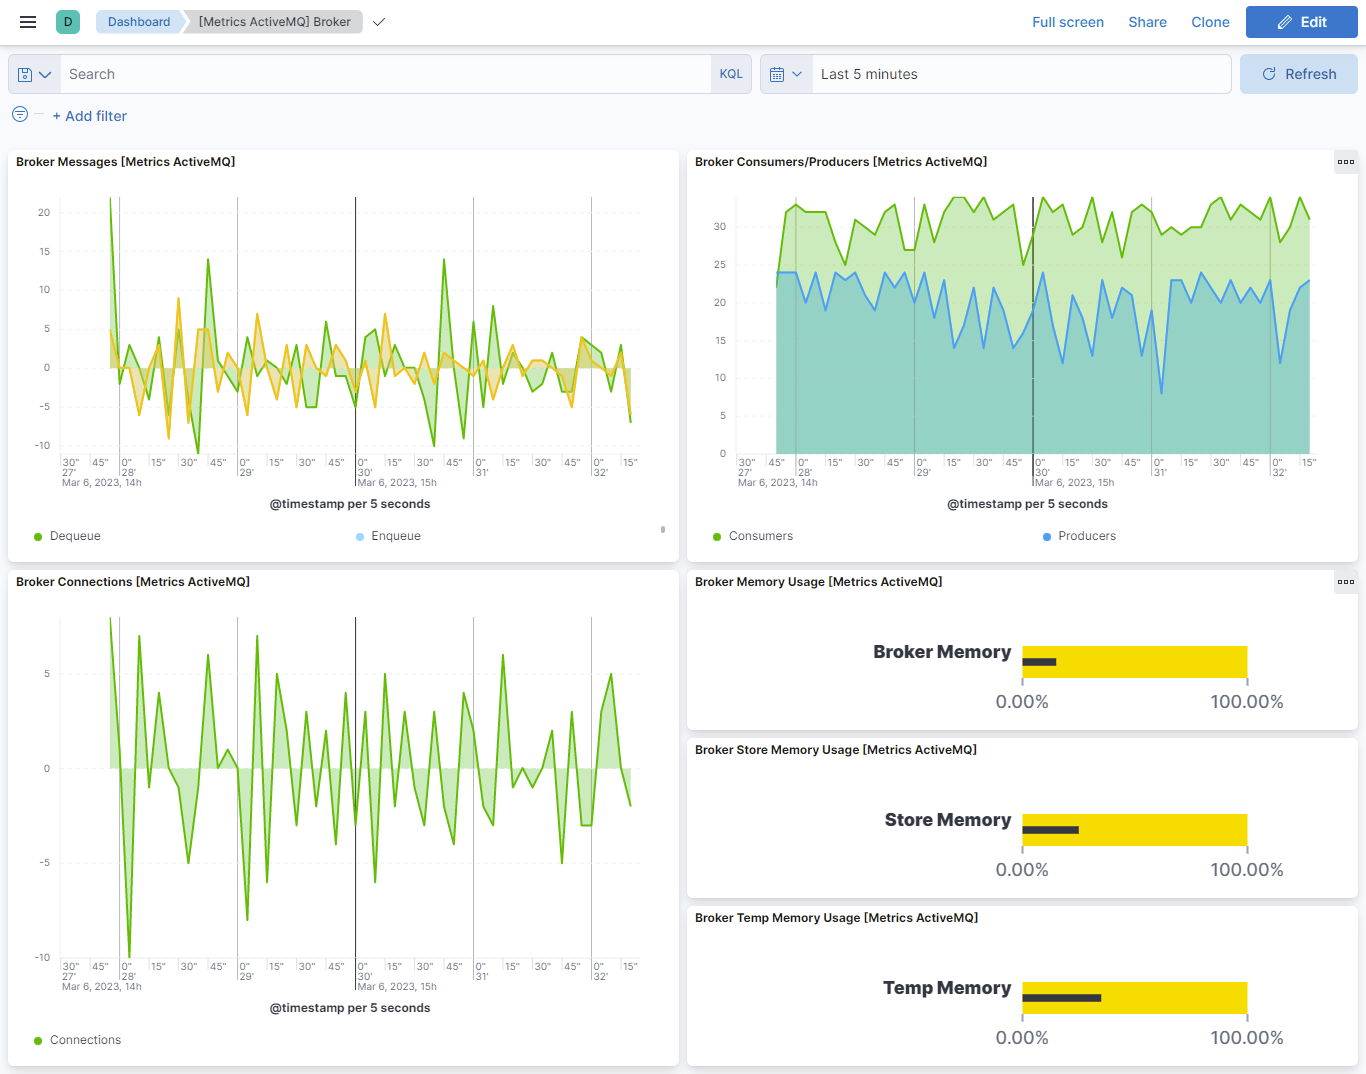
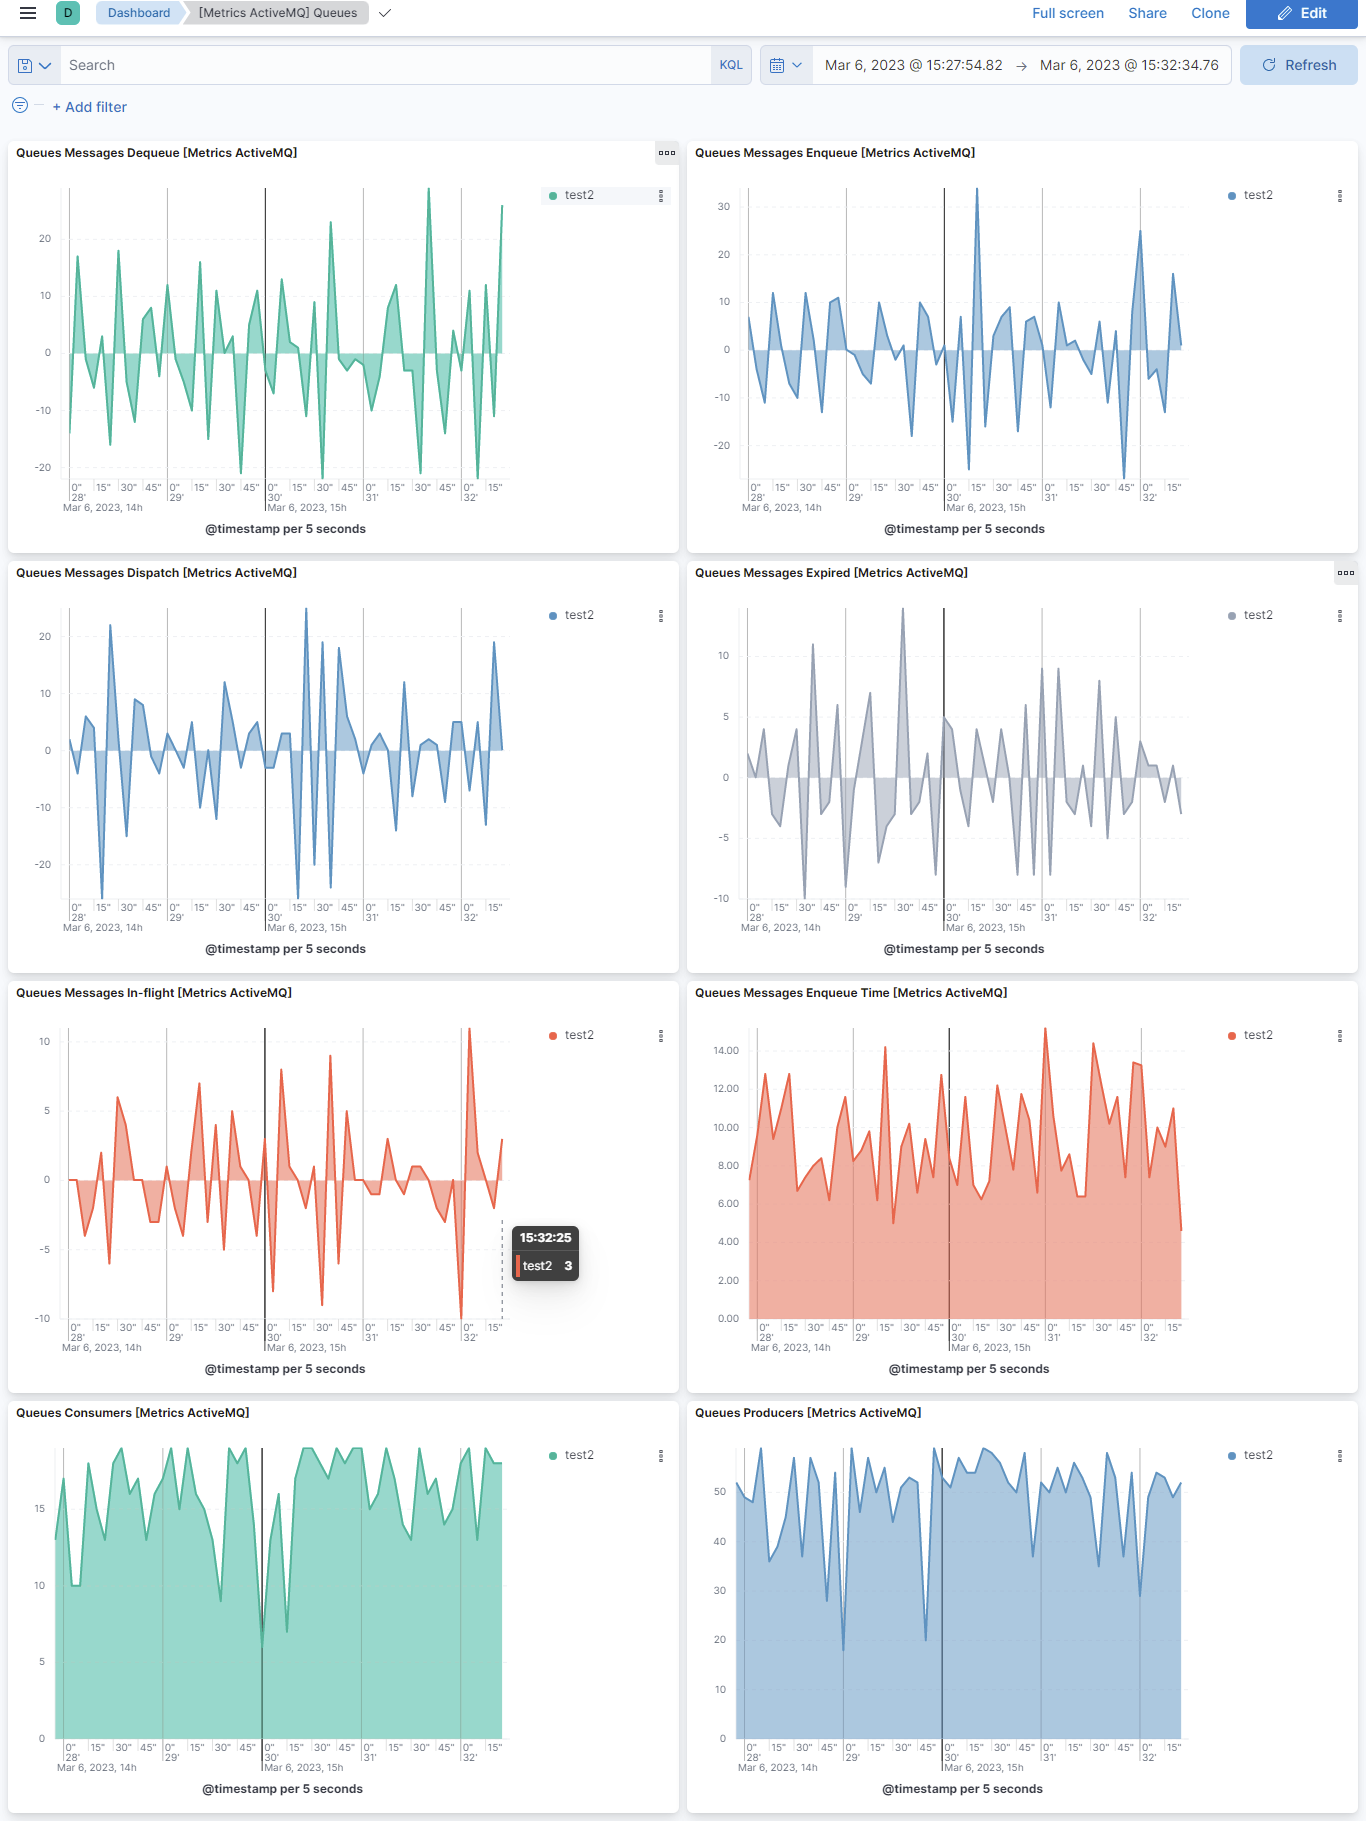
Metrics give you insight into the statistics of the ActiveMQ. The Metric data streams collected by the ActiveMQ integration are broker, queue and topic so that the user can monitor and troubleshoot the performance of the ActiveMQ instance.
Data streams:
audit: Collects information related to the username, audit threads and messages.broker: Collects information related to the statistics of enqueued and dequeued messages, consumers, producers and memory usage (broker, store, temp).log: Collects information related to the startup and shutdown of the ActiveMQ application server, the deployment of new applications, or the failure of one or more subsystems.queue: Collects information related to the statistics of queue name and size, exchanged messages and number of producers and consumers.topic: Collects information related to the statistics of exchanged messages, consumers, producers and memory usage.
Note:
- Users can monitor and see the log inside the ingested documents for ActiveMQ in the
logs-*index pattern fromDiscover, and for metrics, the index pattern ismetrics-*.
This integration has been tested against ActiveMQ 5.17.1 (independent from the operating system).
You need Elasticsearch to store and search your data and Kibana to visualize and manage it. You can use our hosted Elasticsearch Service on Elastic Cloud, which is recommended or self-manage the Elastic Stack on your hardware.
For step-by-step instructions on how to set up an integration, see the Getting Started guide.
Here are the supported log format for the Audit logs and ActiveMQ logs in the ActiveMQ instance,
%-5p | %m | %t%n
Here is the breakdown of the pattern:
%-5p: This part represents the log level left-aligned with a width of 5 characters. The - signifies left alignment.
%m: This part represents the log message.
%t%n: This part represents the thread name (%t) followed by a newline (%n).
%d | %-5p | %m | %c | %t%n%throwable{full}
Here is the breakdown of the pattern:
%d: This part represents the date and time of the log event in the ISO8601 format.
%-5p: This part represents the log level left-aligned with a width of 5 characters. The - signifies left alignment.
%m: This part represents the log message.
%c: This part represents the logger category (class name).
%t%n: This part represents the thread name (%t) followed by a newline (%n).
%throwable{full}: This part represents the full stack trace if an exception is attached to the log entry.
After the integration is successfully configured, clicking on the Assets tab of the ActiveMQ Integration should display a list of available dashboards. Click on the dashboard available for your configured data stream. It should be populated with the required data.
If host.ip is shown conflicted under logs-* data view, then this issue can be solved by reindexing the Audit and Log data stream's indices.
If host.ip is shown conflicted under metrics-* data view, then this issue can be solved by reindexing the Broker, Queue and Topic data stream's indices.
These logs are System logs of ActiveMQ.
Example
{
    "@timestamp": "2022-06-24T12:54:26.345Z",
    "activemq": {
        "log": {
            "caller": "org.apache.activemq.broker.BrokerService",
            "thread": "main"
        }
    },
    "agent": {
        "ephemeral_id": "71698f60-6a6f-4b4e-ac2a-20c0b1805cff",
        "id": "46343e0c-0d8c-464b-a216-cacf63027d6f",
        "name": "docker-fleet-agent",
        "type": "filebeat",
        "version": "8.5.0"
    },
    "data_stream": {
        "dataset": "activemq.log",
        "namespace": "ep",
        "type": "logs"
    },
    "ecs": {
        "version": "8.11.0"
    },
    "elastic_agent": {
        "id": "46343e0c-0d8c-464b-a216-cacf63027d6f",
        "snapshot": false,
        "version": "8.5.0"
    },
    "event": {
        "agent_id_status": "verified",
        "dataset": "activemq.log",
        "ingested": "2022-12-09T04:19:37Z",
        "kind": "event",
        "module": "activemq",
        "type": [
            "info"
        ]
    },
    "host": {
        "name": "docker-fleet-agent"
    },
    "input": {
        "type": "log"
    },
    "log": {
        "file": {
            "path": "/tmp/service_logs/activemq.log"
        },
        "level": "INFO",
        "offset": 0
    },
    "message": "Using Persistence Adapter: KahaDBPersistenceAdapter[/softwares/apache-activemq-5.17.1/data/kahadb]",
    "tags": [
        "forwarded",
        "activemq-log"
    ]
}
ECS Field Reference
Please refer to the following document for detailed information on ECS fields.
Exported fields
| Field | Description | Type |
|---|---|---|
| @timestamp | Event timestamp. | date |
| activemq.log.caller | Name of the caller issuing the logging request (class or resource). | keyword |
| activemq.log.thread | Thread that generated the logging event. | keyword |
| data_stream.dataset | Data stream dataset. | constant_keyword |
| data_stream.namespace | Data stream namespace. | constant_keyword |
| data_stream.type | Data stream type. | constant_keyword |
| input.type | Input type | keyword |
| log.flags | Log flags | keyword |
| log.offset | Log offset | long |
In secured environments, it is required to log every user management action. ActiveMQ implements audit logging, which means that every management action made through JMX or Web Console management interface is logged and available for later inspection.
Example
{
    "@timestamp": "2022-12-09T04:17:31.785Z",
    "activemq": {
        "audit": {
            "thread": "RMI TCP Connection(1)-127.0.0.1"
        }
    },
    "agent": {
        "ephemeral_id": "34b01ecd-6dff-4bc4-b2e2-a7388b1e20b2",
        "id": "46343e0c-0d8c-464b-a216-cacf63027d6f",
        "name": "docker-fleet-agent",
        "type": "filebeat",
        "version": "8.5.0"
    },
    "data_stream": {
        "dataset": "activemq.audit",
        "namespace": "ep",
        "type": "logs"
    },
    "ecs": {
        "version": "8.11.0"
    },
    "elastic_agent": {
        "id": "46343e0c-0d8c-464b-a216-cacf63027d6f",
        "snapshot": false,
        "version": "8.5.0"
    },
    "event": {
        "agent_id_status": "verified",
        "dataset": "activemq.audit",
        "ingested": "2022-12-09T04:17:32Z",
        "kind": "event",
        "module": "activemq",
        "type": [
            "info"
        ]
    },
    "host": {
        "name": "docker-fleet-agent"
    },
    "input": {
        "type": "log"
    },
    "log": {
        "file": {
            "path": "/tmp/service_logs/audit.log"
        },
        "level": "INFO",
        "offset": 0
    },
    "message": "called org.apache.activemq.broker.jmx.BrokerView.terminateJVM[0] on localhost at 24-06-2022 13:09:43,996",
    "tags": [
        "forwarded",
        "activemq-audit"
    ],
    "user": {
        "name": "anonymous"
    }
}
ECS Field Reference
Please refer to the following document for detailed information on ECS fields.
Exported fields
| Field | Description | Type |
|---|---|---|
| @timestamp | Event timestamp. | date |
| activemq.audit.thread | Thread that generated the logging event. | keyword |
| cloud.image.id | Image ID for the cloud instance. | keyword |
| data_stream.dataset | Data stream dataset. | constant_keyword |
| data_stream.namespace | Data stream namespace. | constant_keyword |
| data_stream.type | Data stream type. | constant_keyword |
| host.containerized | If the host is a container. | boolean |
| host.os.build | OS build information. | keyword |
| host.os.codename | OS codename, if any. | keyword |
| input.type | Input type | keyword |
| log.offset | Log offset | long |
ActiveMQ brokers serve as implementations of the Java Messaging Service (JMS), a Java specification facilitating the seamless exchange of data between applications. Metrics provide insights into statistics such as enqueued and dequeued messages, as well as details on consumers, producers, and memory usage (broker, store, temp).
Example
{
    "@timestamp": "2022-12-09T04:18:21.069Z",
    "activemq": {
        "broker": {
            "connections": {
                "count": 9
            },
            "consumers": {
                "count": 0
            },
            "mbean": "org.apache.activemq:brokerName=localhost,type=Broker",
            "memory": {
                "broker": {
                    "pct": 0
                },
                "store": {
                    "pct": 0
                },
                "temp": {
                    "pct": 0
                }
            },
            "messages": {
                "count": 9,
                "dequeue": {
                    "count": 0
                },
                "enqueue": {
                    "count": 20
                }
            },
            "name": "localhost",
            "producers": {
                "count": 0
            }
        }
    },
    "agent": {
        "ephemeral_id": "04f37e48-28d9-4b56-a226-c480f4a8a5ae",
        "id": "46343e0c-0d8c-464b-a216-cacf63027d6f",
        "name": "docker-fleet-agent",
        "type": "metricbeat",
        "version": "8.5.0"
    },
    "data_stream": {
        "dataset": "activemq.broker",
        "namespace": "ep",
        "type": "metrics"
    },
    "ecs": {
        "version": "8.11.0"
    },
    "elastic_agent": {
        "id": "46343e0c-0d8c-464b-a216-cacf63027d6f",
        "snapshot": false,
        "version": "8.5.0"
    },
    "event": {
        "agent_id_status": "verified",
        "category": [
            "web"
        ],
        "dataset": "activemq.broker",
        "duration": 22293625,
        "ingested": "2022-12-09T04:18:22Z",
        "kind": "metric",
        "module": "activemq",
        "type": [
            "info"
        ]
    },
    "host": {
        "architecture": "x86_64",
        "containerized": false,
        "hostname": "docker-fleet-agent",
        "id": "66392b0697b84641af8006d87aeb89f1",
        "ip": [
            "172.18.0.7"
        ],
        "mac": [
            "02-42-AC-12-00-07"
        ],
        "name": "docker-fleet-agent",
        "os": {
            "codename": "focal",
            "family": "debian",
            "kernel": "5.15.49-linuxkit",
            "name": "Ubuntu",
            "platform": "ubuntu",
            "type": "linux",
            "version": "20.04.5 LTS (Focal Fossa)"
        }
    },
    "metricset": {
        "name": "broker",
        "period": 10000
    },
    "service": {
        "address": "http://elastic-package-service-activemq-1:8161/api/jolokia/%3FignoreErrors=true&canonicalNaming=false",
        "type": "activemq"
    },
    "tags": [
        "activemq-broker"
    ]
}
ECS Field Reference
Please refer to the following document for detailed information on ECS fields.
Exported fields
| Field | Description | Type | Unit | Metric Type |
|---|---|---|---|---|
| @timestamp | Event timestamp. | date | ||
| activemq.broker.connections.count | Total number of connections. | long | counter | |
| activemq.broker.consumers.count | Number of message consumers. | long | gauge | |
| activemq.broker.mbean | MBean that this event is related to. | keyword | ||
| activemq.broker.memory.broker.pct | The percentage of the memory limit used. | float | percent | gauge |
| activemq.broker.memory.store.pct | Percent of store limit used. | float | percent | gauge |
| activemq.broker.memory.temp.pct | The percentage of the temp usage limit used. | float | percent | gauge |
| activemq.broker.messages.count | Number of unacknowledged messages on the broker. | long | gauge | |
| activemq.broker.messages.dequeue.count | Number of messages that have been acknowledged on the broker. | long | gauge | |
| activemq.broker.messages.enqueue.count | Number of messages that have been sent to the destination. | long | gauge | |
| activemq.broker.name | Broker name. | keyword | ||
| activemq.broker.producers.count | Number of message producers active on destinations on the broker. | long | gauge | |
| agent.id | Unique identifier of this agent (if one exists). Example: For Beats this would be beat.id. | keyword | ||
| cloud.account.id | The cloud account or organization id used to identify different entities in a multi-tenant environment. Examples: AWS account id, Google Cloud ORG Id, or other unique identifier. | keyword | ||
| cloud.availability_zone | Availability zone in which this host, resource, or service is located. | keyword | ||
| cloud.instance.id | Instance ID of the host machine. | keyword | ||
| cloud.provider | Name of the cloud provider. Example values are aws, azure, gcp, or digitalocean. | keyword | ||
| cloud.region | Region in which this host, resource, or service is located. | keyword | ||
| container.id | Unique container id. | keyword | ||
| data_stream.dataset | Data stream dataset. | constant_keyword | ||
| data_stream.namespace | Data stream namespace. | constant_keyword | ||
| data_stream.type | Data stream type. | constant_keyword | ||
| host.name | Name of the host. It can contain what hostname returns on Unix systems, the fully qualified domain name (FQDN), or a name specified by the user. The recommended value is the lowercase FQDN of the host. | keyword | ||
| service.address | Address where data about this service was collected from. This should be a URI, network address (ipv4:port or [ipv6]:port) or a resource path (sockets). | keyword |
Queues are FIFO (first-in, first-out) pipelines of messages produced and consumed by brokers and clients. Producers create messages and push them onto these queues. Then, those messages are polled and collected by consumer applications, one message at a time. Metrics show statistics of exchanged messages, consumers, producers and memory usage.
Example
{
    "@timestamp": "2022-12-09T04:20:29.290Z",
    "activemq": {
        "queue": {
            "consumers": {
                "count": 0
            },
            "mbean": "org.apache.activemq:brokerName=localhost,destinationName=TEST,destinationType=Queue,type=Broker",
            "memory": {
                "broker": {
                    "pct": 0
                }
            },
            "messages": {
                "dequeue": {
                    "count": 0
                },
                "dispatch": {
                    "count": 0
                },
                "enqueue": {
                    "count": 8,
                    "time": {
                        "avg": 0,
                        "max": 0,
                        "min": 0
                    }
                },
                "expired": {
                    "count": 0
                },
                "inflight": {
                    "count": 0
                },
                "size": {
                    "avg": 1035
                }
            },
            "name": "TEST",
            "producers": {
                "count": 0
            },
            "size": 8
        }
    },
    "agent": {
        "ephemeral_id": "cf2dc538-c1ce-41e4-8c82-90a77985107b",
        "id": "46343e0c-0d8c-464b-a216-cacf63027d6f",
        "name": "docker-fleet-agent",
        "type": "metricbeat",
        "version": "8.5.0"
    },
    "data_stream": {
        "dataset": "activemq.queue",
        "namespace": "ep",
        "type": "metrics"
    },
    "ecs": {
        "version": "8.11.0"
    },
    "elastic_agent": {
        "id": "46343e0c-0d8c-464b-a216-cacf63027d6f",
        "snapshot": false,
        "version": "8.5.0"
    },
    "event": {
        "agent_id_status": "verified",
        "category": [
            "web"
        ],
        "dataset": "activemq.queue",
        "duration": 21893167,
        "ingested": "2022-12-09T04:20:30Z",
        "kind": "metric",
        "module": "activemq",
        "type": [
            "info"
        ]
    },
    "host": {
        "architecture": "x86_64",
        "containerized": false,
        "hostname": "docker-fleet-agent",
        "id": "66392b0697b84641af8006d87aeb89f1",
        "ip": [
            "172.18.0.7"
        ],
        "mac": [
            "02-42-AC-12-00-07"
        ],
        "name": "docker-fleet-agent",
        "os": {
            "codename": "focal",
            "family": "debian",
            "kernel": "5.15.49-linuxkit",
            "name": "Ubuntu",
            "platform": "ubuntu",
            "type": "linux",
            "version": "20.04.5 LTS (Focal Fossa)"
        }
    },
    "metricset": {
        "name": "queue",
        "period": 10000
    },
    "service": {
        "address": "http://elastic-package-service-activemq-1:8161/api/jolokia/%3FignoreErrors=true&canonicalNaming=false",
        "type": "activemq"
    },
    "tags": [
        "activemq-queue"
    ]
}
ECS Field Reference
Please refer to the following document for detailed information on ECS fields.
Exported fields
| Field | Description | Type | Unit | Metric Type |
|---|---|---|---|---|
| @timestamp | Event timestamp. | date | ||
| activemq.queue.consumers.count | Number of consumers subscribed to this destination. | long | gauge | |
| activemq.queue.mbean | MBean that this event is related to. | keyword | ||
| activemq.queue.memory.broker.pct | Percent of memory limit used. | float | percent | gauge |
| activemq.queue.messages.dequeue.count | Number of messages that has been acknowledged (and removed) from the destination. | long | gauge | |
| activemq.queue.messages.dispatch.count | Number of messages that has been delivered to consumers, including those not acknowledged. | long | gauge | |
| activemq.queue.messages.enqueue.count | Number of messages that have been sent to the destination. | long | gauge | |
| activemq.queue.messages.enqueue.time.avg | Average time a message was held on this destination. | double | gauge | |
| activemq.queue.messages.enqueue.time.max | The longest time a message was held on this destination. | long | gauge | |
| activemq.queue.messages.enqueue.time.min | The shortest time a message was held on this destination. | long | gauge | |
| activemq.queue.messages.expired.count | Number of messages that have been expired. | long | gauge | |
| activemq.queue.messages.inflight.count | Number of messages that have been dispatched to consumers but not acknowledged by consumers. | long | gauge | |
| activemq.queue.messages.size.avg | Average message size on this destination. | long | gauge | |
| activemq.queue.name | Queue name. | keyword | ||
| activemq.queue.producers.count | Number of producers attached to this destination. | long | gauge | |
| activemq.queue.size | Queue size. | long | gauge | |
| agent.id | Unique identifier of this agent (if one exists). Example: For Beats this would be beat.id. | keyword | ||
| cloud.account.id | The cloud account or organization id used to identify different entities in a multi-tenant environment. Examples: AWS account id, Google Cloud ORG Id, or other unique identifier. | keyword | ||
| cloud.availability_zone | Availability zone in which this host, resource, or service is located. | keyword | ||
| cloud.instance.id | Instance ID of the host machine. | keyword | ||
| cloud.provider | Name of the cloud provider. Example values are aws, azure, gcp, or digitalocean. | keyword | ||
| cloud.region | Region in which this host, resource, or service is located. | keyword | ||
| container.id | Unique container id. | keyword | ||
| data_stream.dataset | Data stream dataset. | constant_keyword | ||
| data_stream.namespace | Data stream namespace. | constant_keyword | ||
| data_stream.type | Data stream type. | constant_keyword | ||
| host.name | Name of the host. It can contain what hostname returns on Unix systems, the fully qualified domain name (FQDN), or a name specified by the user. The recommended value is the lowercase FQDN of the host. | keyword | ||
| service.address | Address where data about this service was collected from. This should be a URI, network address (ipv4:port or [ipv6]:port) or a resource path (sockets). | keyword |
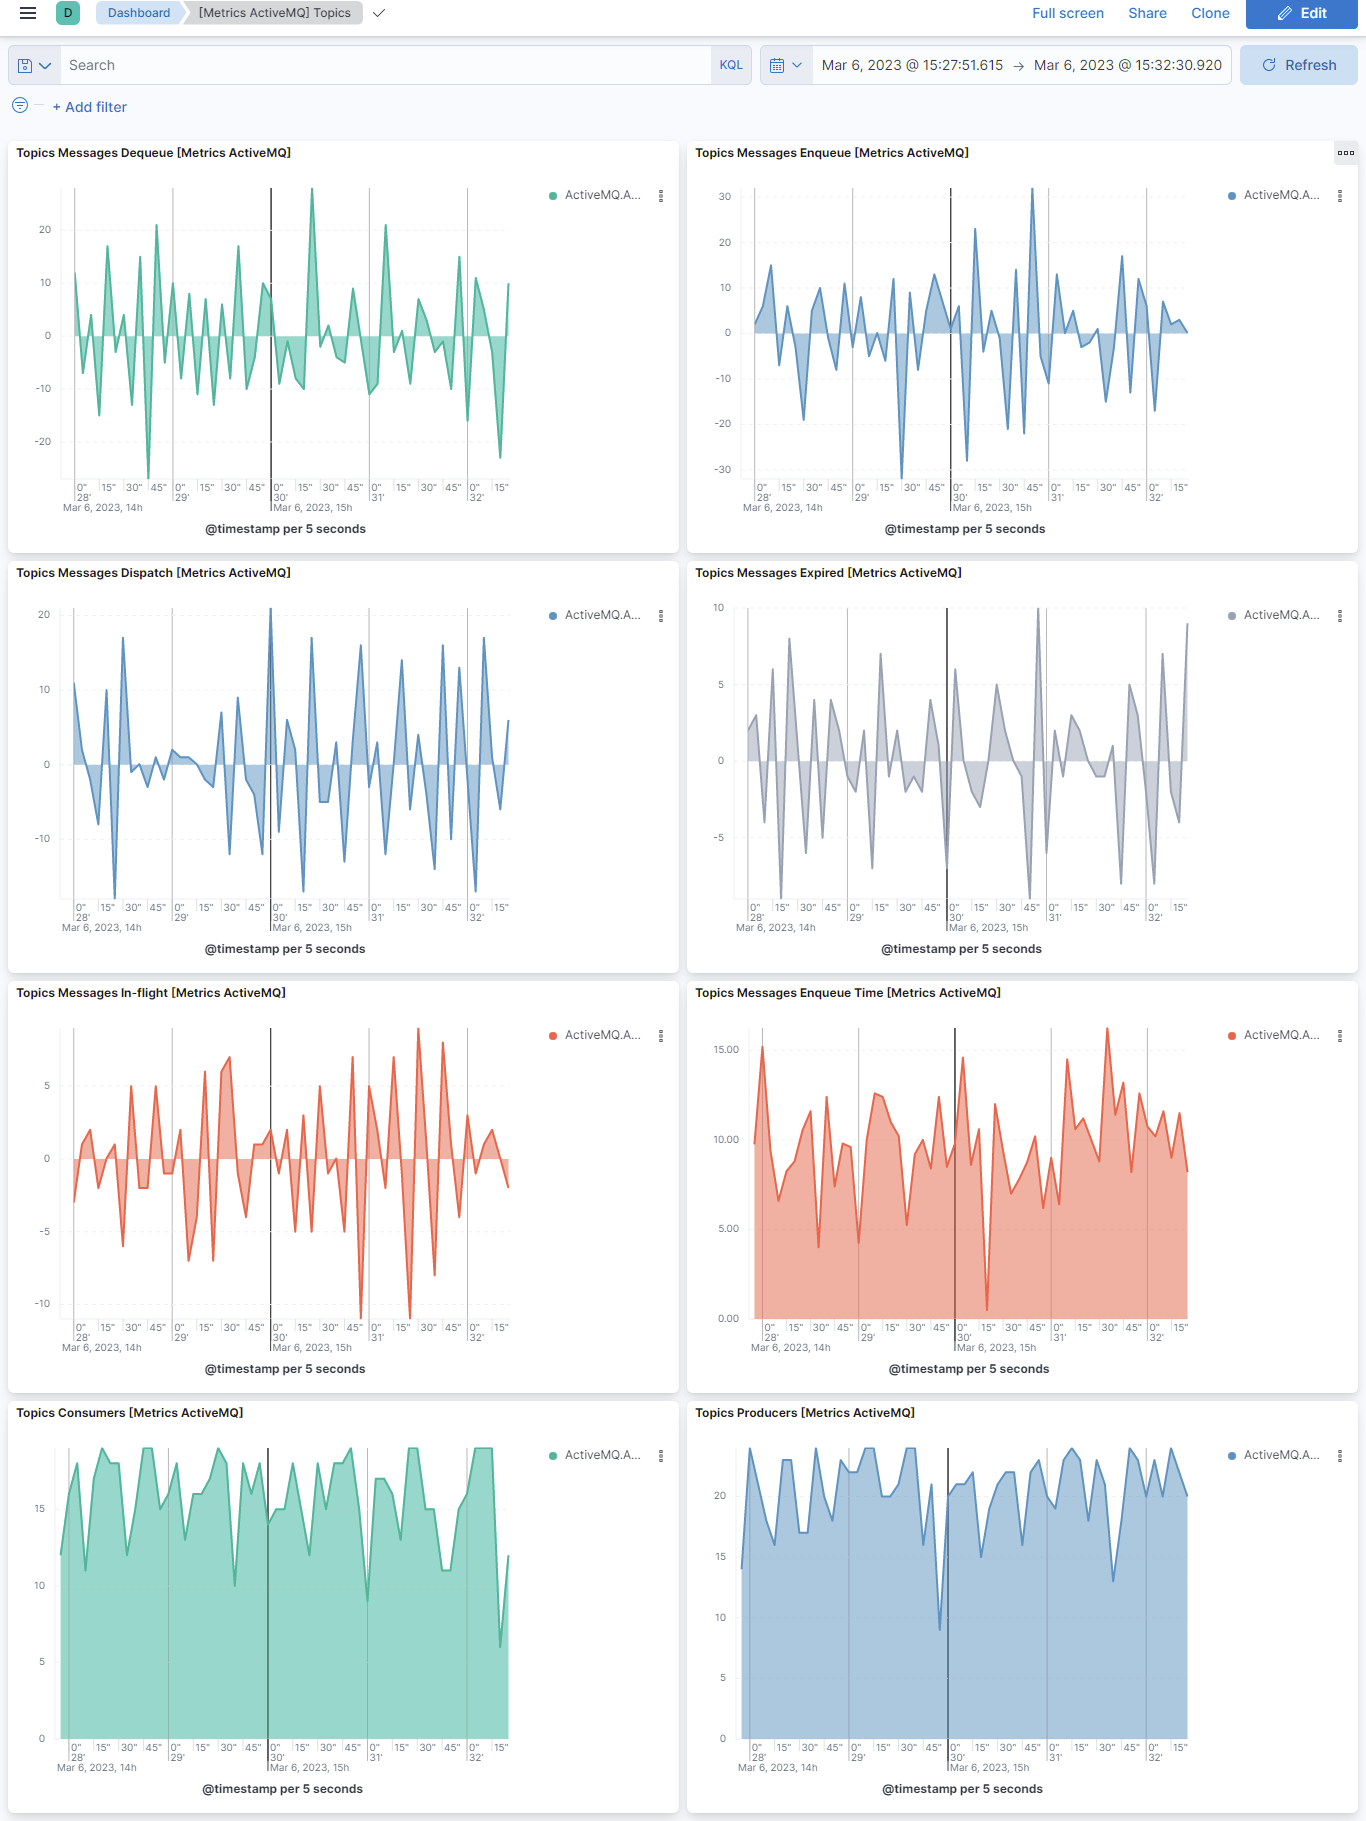
Topics are subscription-based message broadcast channels. When a producing application sends a message, multiple recipients who are 'subscribed' to that topic receive a broadcast of the message. Metrics show statistics of exchanged messages, consumers, producers and memory usage.
Example
{
    "@timestamp": "2022-12-09T04:21:20.298Z",
    "activemq": {
        "topic": {
            "consumers": {
                "count": 0
            },
            "mbean": "org.apache.activemq:brokerName=localhost,destinationName=ActiveMQ.Advisory.MasterBroker,destinationType=Topic,type=Broker",
            "memory": {
                "broker": {
                    "pct": 0
                }
            },
            "messages": {
                "dequeue": {
                    "count": 0
                },
                "dispatch": {
                    "count": 0
                },
                "enqueue": {
                    "count": 1,
                    "time": {
                        "avg": 0,
                        "max": 0,
                        "min": 0
                    }
                },
                "expired": {
                    "count": 0
                },
                "inflight": {
                    "count": 0
                },
                "size": {
                    "avg": 1024
                }
            },
            "name": "ActiveMQ.Advisory.MasterBroker",
            "producers": {
                "count": 0
            }
        }
    },
    "agent": {
        "ephemeral_id": "cf2dc538-c1ce-41e4-8c82-90a77985107b",
        "id": "46343e0c-0d8c-464b-a216-cacf63027d6f",
        "name": "docker-fleet-agent",
        "type": "metricbeat",
        "version": "8.5.0"
    },
    "data_stream": {
        "dataset": "activemq.topic",
        "namespace": "ep",
        "type": "metrics"
    },
    "ecs": {
        "version": "8.11.0"
    },
    "elastic_agent": {
        "id": "46343e0c-0d8c-464b-a216-cacf63027d6f",
        "snapshot": false,
        "version": "8.5.0"
    },
    "event": {
        "agent_id_status": "verified",
        "category": [
            "web"
        ],
        "dataset": "activemq.topic",
        "duration": 18261916,
        "ingested": "2022-12-09T04:21:21Z",
        "kind": "metric",
        "module": "activemq",
        "type": [
            "info"
        ]
    },
    "host": {
        "architecture": "x86_64",
        "containerized": false,
        "hostname": "docker-fleet-agent",
        "id": "66392b0697b84641af8006d87aeb89f1",
        "ip": [
            "172.18.0.7"
        ],
        "mac": [
            "02-42-AC-12-00-07"
        ],
        "name": "docker-fleet-agent",
        "os": {
            "codename": "focal",
            "family": "debian",
            "kernel": "5.15.49-linuxkit",
            "name": "Ubuntu",
            "platform": "ubuntu",
            "type": "linux",
            "version": "20.04.5 LTS (Focal Fossa)"
        }
    },
    "metricset": {
        "name": "topic",
        "period": 10000
    },
    "service": {
        "address": "http://elastic-package-service-activemq-1:8161/api/jolokia/%3FignoreErrors=true&canonicalNaming=false",
        "type": "activemq"
    },
    "tags": [
        "activemq-topic"
    ]
}
ECS Field Reference
Please refer to the following document for detailed information on ECS fields.
Exported fields
| Field | Description | Type | Unit | Metric Type |
|---|---|---|---|---|
| @timestamp | Event timestamp. | date | ||
| activemq.topic.consumers.count | Number of consumers subscribed to this destination. | long | gauge | |
| activemq.topic.mbean | MBean that this event is related to. | keyword | ||
| activemq.topic.memory.broker.pct | Percent of memory limit used. | float | percent | gauge |
| activemq.topic.messages.dequeue.count | Number of messages that has been acknowledged (and removed) from the destination. | long | gauge | |
| activemq.topic.messages.dispatch.count | Number of messages that has been delivered to consumers, including those not acknowledged. | long | gauge | |
| activemq.topic.messages.enqueue.count | Number of messages that have been sent to the destination. | long | gauge | |
| activemq.topic.messages.enqueue.time.avg | Average time a message was held on this destination. | double | gauge | |
| activemq.topic.messages.enqueue.time.max | The longest time a message was held on this destination. | long | gauge | |
| activemq.topic.messages.enqueue.time.min | The shortest time a message was held on this destination. | long | gauge | |
| activemq.topic.messages.expired.count | Number of messages that have been expired. | long | gauge | |
| activemq.topic.messages.inflight.count | Number of messages that have been dispatched to, but not acknowledged by, consumers. | long | gauge | |
| activemq.topic.messages.size.avg | Average message size on this destination. | long | gauge | |
| activemq.topic.name | Topic name | keyword | ||
| activemq.topic.producers.count | Number of producers attached to this destination. | long | gauge | |
| agent.id | Unique identifier of this agent (if one exists). Example: For Beats this would be beat.id. | keyword | ||
| cloud.account.id | The cloud account or organization id used to identify different entities in a multi-tenant environment. Examples: AWS account id, Google Cloud ORG Id, or other unique identifier. | keyword | ||
| cloud.availability_zone | Availability zone in which this host, resource, or service is located. | keyword | ||
| cloud.instance.id | Instance ID of the host machine. | keyword | ||
| cloud.provider | Name of the cloud provider. Example values are aws, azure, gcp, or digitalocean. | keyword | ||
| cloud.region | Region in which this host, resource, or service is located. | keyword | ||
| container.id | Unique container id. | keyword | ||
| data_stream.dataset | Data stream dataset. | constant_keyword | ||
| data_stream.namespace | Data stream namespace. | constant_keyword | ||
| data_stream.type | Data stream type. | constant_keyword | ||
| host.name | Name of the host. It can contain what hostname returns on Unix systems, the fully qualified domain name (FQDN), or a name specified by the user. The recommended value is the lowercase FQDN of the host. | keyword | ||
| service.address | Address where data about this service was collected from. This should be a URI, network address (ipv4:port or [ipv6]:port) or a resource path (sockets). | keyword |
This integration includes one or more Kibana dashboards that visualizes the data collected by the integration. The screenshots below illustrate how the ingested data is displayed.
Changelog
| Version | Details | Minimum Kibana version |
|---|---|---|
| 1.9.0 | Enhancement (View pull request) Improve documentation |
9.0.0 8.13.0 |
| 1.8.1 | Bug fix (View pull request) Added description to ssl nodes including links to documentation. |
9.0.0 8.13.0 |
| 1.8.0 | Enhancement (View pull request) Add support for Kibana 9.0.0. |
9.0.0 8.13.0 |
| 1.7.0 | Enhancement (View pull request) Allow the usage of deprecated log input and support for stack 9.0 |
8.13.0 |
| 1.6.1 | Bug fix (View pull request) Update links to getting started docs |
8.13.0 |
| 1.6.0 | Enhancement (View pull request) Allow @custom pipeline access to event.original without setting preserve_original_event. |
8.13.0 |
| 1.5.0 | Enhancement (View pull request) Add processor support for broker, queue and topic data streams. |
8.13.0 |
| 1.4.0 | Enhancement (View pull request) ECS version updated to 8.11.0. Update the kibana constraint to ^8.13.0. Modified the field definitions to remove ECS fields made redundant by the ecs@mappings component template. |
8.13.0 |
| 1.3.0 | Enhancement (View pull request) Add global filter on data_stream.dataset to improve performance. |
8.12.0 |
| 1.2.1 | Enhancement (View pull request) Add pipeline tests for Broker, Queue and Topic data streams. |
8.12.0 |
| 1.2.0 | Enhancement (View pull request) Enable secrets for sensitive fields. For more details, refer https://www.elastic.co/guide/en/fleet/current/agent-policy.html#agent-policy-secret-values |
8.12.0 |
| 1.1.1 | Bug fix (View pull request) Disable secrets for older stack versions due to errors. |
8.8.0 |
| 1.1.0 | Enhancement (View pull request) Enable 'secret' for the sensitive fields, supported from 8.12. |
8.8.0 |
| 1.0.0 | Enhancement (View pull request) Make ActiveMQ GA. |
8.8.0 |
| 0.16.1 | Bug fix (View pull request) Update link to the correct reindexing procedure. |
8.8.0 |
| 0.16.0 | Enhancement (View pull request) Update README to use documentation guidelines. |
8.8.0 |
| 0.15.0 | Enhancement (View pull request) Add metric_type and support tooltip for period. |
8.8.0 |
| 0.14.2 | Bug fix (View pull request) Resolve host.ip field conflict. |
8.8.0 |
| 0.14.1 | Bug fix (View pull request) Add null and ignore_missing check to handle event.original field. |
8.8.0 |
| 0.14.0 | Enhancement (View pull request) Update the package format_version to 3.0.0. |
8.8.0 |
| 0.13.1 | Bug fix (View pull request) Remove forwarded tag from metrics data streams. |
8.8.0 |
| 0.13.0 | Enhancement (View pull request) Revert changes to permissions to reroute events to logs-- for log datastream |
8.8.0 |
| 0.12.0 | Enhancement (View pull request) Enable time series data streams for the metrics datasets. This dramatically reduces storage for metrics and is expected to progressively improve query performance. For more details, see https://www.elastic.co/guide/en/elasticsearch/reference/current/tsds.html. |
8.8.0 |
| 0.11.0 | Enhancement (View pull request) Add metric_type mappings for broker, queue and topic datastreams. |
8.2.0 |
| 0.10.0 | Enhancement (View pull request) Add permissions to reroute events to logs-- for log datastream |
8.2.0 |
| 0.9.2 | Enhancement (View pull request) Added dimension fields for topic datastream for TSDB enablement |
8.2.0 |
| 0.9.1 | Enhancement (View pull request) Added dimension fields for queue datastream for TSDB enablement |
8.2.0 |
| 0.9.0 | Enhancement (View pull request) Added dimension fields for broker datastream for TSDB enablement |
8.2.0 |
| 0.8.0 | Enhancement (View pull request) Rename ownership from obs-service-integrations to obs-infraobs-integrations |
8.2.0 |
| 0.7.0 | Enhancement (View pull request) Migrate visualizations to lens. |
8.2.0 |
| 0.6.1 | Enhancement (View pull request) Added categories and/or subcategories. |
8.2.0 |
| 0.6.0 | Enhancement (View pull request) Update ECS version to 8.5.1. |
8.2.0 |
| 0.5.0 | Enhancement (View pull request) Added infrastructure category. |
8.2.0 |
| 0.4.3 | Enhancement (View pull request) Add additional ECS fields. |
8.2.0 |
| 0.4.2 | Bug fix (View pull request) Remove unnecessary fields from fields.yml |
8.2.0 |
| 0.4.1 | Enhancement (View pull request) fixed line break in readme |
8.2.0 |
| 0.4.0 | Enhancement (View pull request) Update the package to follow the best practices, fix minor bugs, update the system tests as per the 5.17.1 version of ActiveMQ, update dashboards |
8.2.0 |
| 0.3.1 | Enhancement (View pull request) Add documentation for multi-fields |
8.0.0 7.16.0 |
| 0.3.0 | Enhancement (View pull request) Support Kibana 8.0 |
8.0.0 7.16.0 |
| 0.2.0 | Enhancement (View pull request) Uniform with guidelines |
7.16.0 |
| 0.1.0 | Enhancement (View pull request) Update to ECS 1.12.0 |
— |
| 0.0.1 | Enhancement (View pull request) initial release |
— |
