Network Beaconing Identification
| Version | 1.5.2 (View all) |
| Subscription level What's this? |
Platinum |
| Developed by What's this? |
Elastic |
| Minimum Kibana version(s) | 9.0.0 8.10.1 |
The Network Beaconing Identification package consists of a framework to identify beaconing activity in your environment. The framework surfaces significant indicators of compromise (IoCs) for threat hunters and analysts to use as a starting point for an investigation in addition to helping them monitor network traffic for beaconing activities. This package is licensed under Elastic License 2.0.
This package leverages event logs on Linux, macOS, and Windows. Prior to using this integration, you must have Elastic Endpoint via Elastic Defend, or have equivalent tools/endpoints set up. If using Elastic Defend, Elastic Defend should be installed through Elastic Agent and collecting data from hosts. See Configure endpoint protection with Elastic Defend for more information.
This package filters out data from cold and frozen data tiers to reduce heap memory usage, avoid running on outdated data, and to follow best practices.
For more detailed information refer to the following blog:
Add the Integration Package: Install the package via Management > Integrations > Network Beaconing Identification. Configure the integration name and agent policy. Click Save and Continue. (Note that this integration does not rely on an agent, and can be assigned to a policy without an agent.)
Check the health of the transform: The transform is scheduled to run every hour. This transform creates the index
ml_beaconing-<VERSION>. To check the health of the transform go to Management > Stack Management > Data > Transforms underlogs-beaconing.pivot_transform-default-<VERSION>.Data view configuration for Dashboards: For the dashboards to work as expected, the following settings need to be configured in Kibana:
- Ensure the pivot transform is installed and running.
- Go to Management > Stack Management > Kibana > Data Views. Click on Create a data view with the following settings:
- Name:
ml_beaconing - Index pattern:
ml_beaconing.all - Select Show Advanced settings and enable Allow hidden and system indices
- Custom data view ID:
ml_beaconing
- Name:
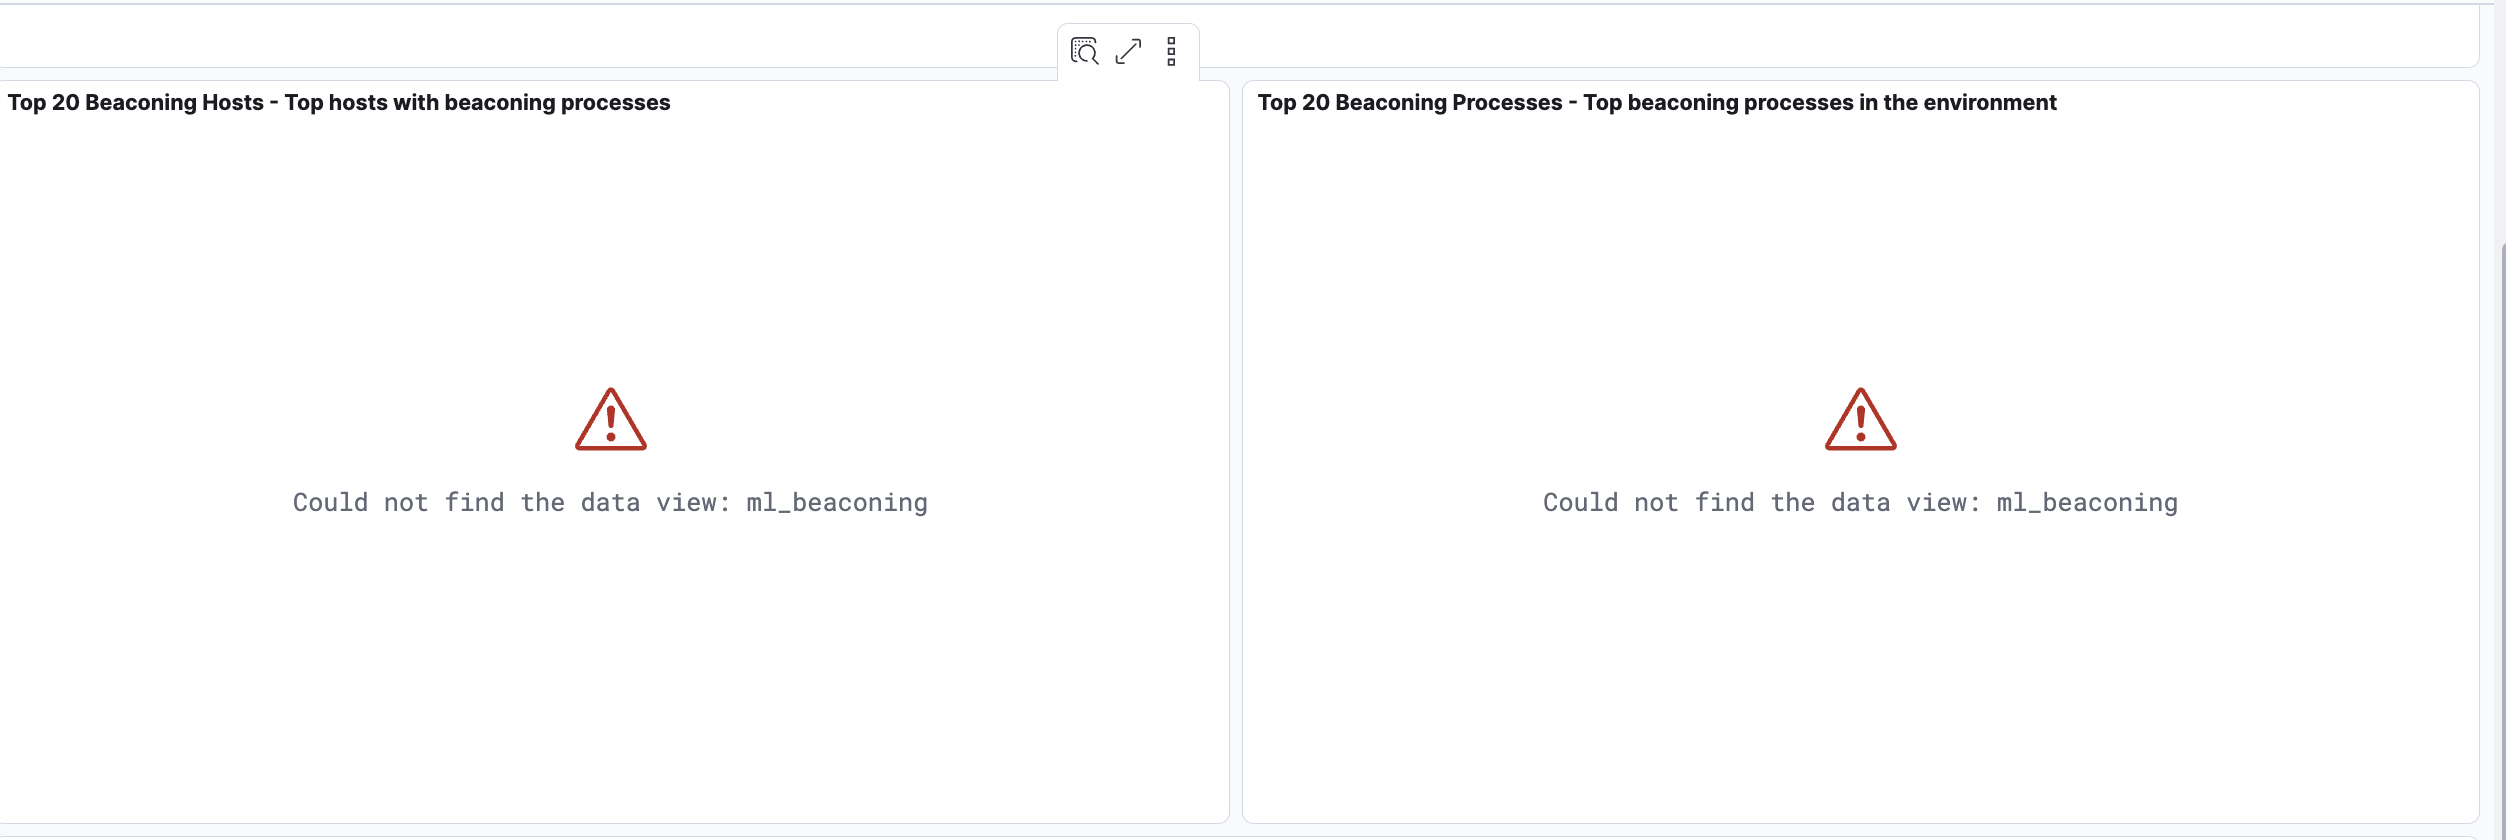
Warning: When creating the data views for the dashboards, ensure that the
Custom data view IDis set to the value specified above and is not left empty. Omitting or misconfiguring this field may result in broken visualizations, as illustrated by the error message below.
Enable detection rules: Prebuilt detection rules corresponding to this package are available from version 8.11.3 and above. You can enable detection rules to alert on beaconing activity in your environment, based on events flagged by this package. These rules are available as part of the Detection Engine, and can be found using the tag
Use Case: C2 Beaconing Detection. See this documentation for more information on importing and enabling the rules.
![]() In Security > Rules, filtering with the “Use Case: C2 Beaconing Detection” tag
In Security > Rules, filtering with the “Use Case: C2 Beaconing Detection” tag
To inspect the installed assets, you can navigate to Stack Management > Data > Transforms.
| Transform name | Purpose | Source index | Destination index | Alias | Supported Platforms |
|---|---|---|---|---|---|
| beaconing.pivot_transform | Flags beaconing activity in your environment | logs-* | ml_beaconing-[version] | ml_beaconing.all | Linux, macOS, Windows |
When querying the destination index to enquire about beaconing activities, we advise using the alias for the destination index (ml_beaconing.all). In the event that the underlying package is upgraded, the alias will aid in maintaining the previous findings.
If you want to modify any of the package components, you can install the package manually by following these steps.
To customize filters in the Network Beaconing Identification transform, follow the below steps. You can use these instructions to update basic settings or to update filters for fields such as process.name, source.ip, destination.ip, and others.
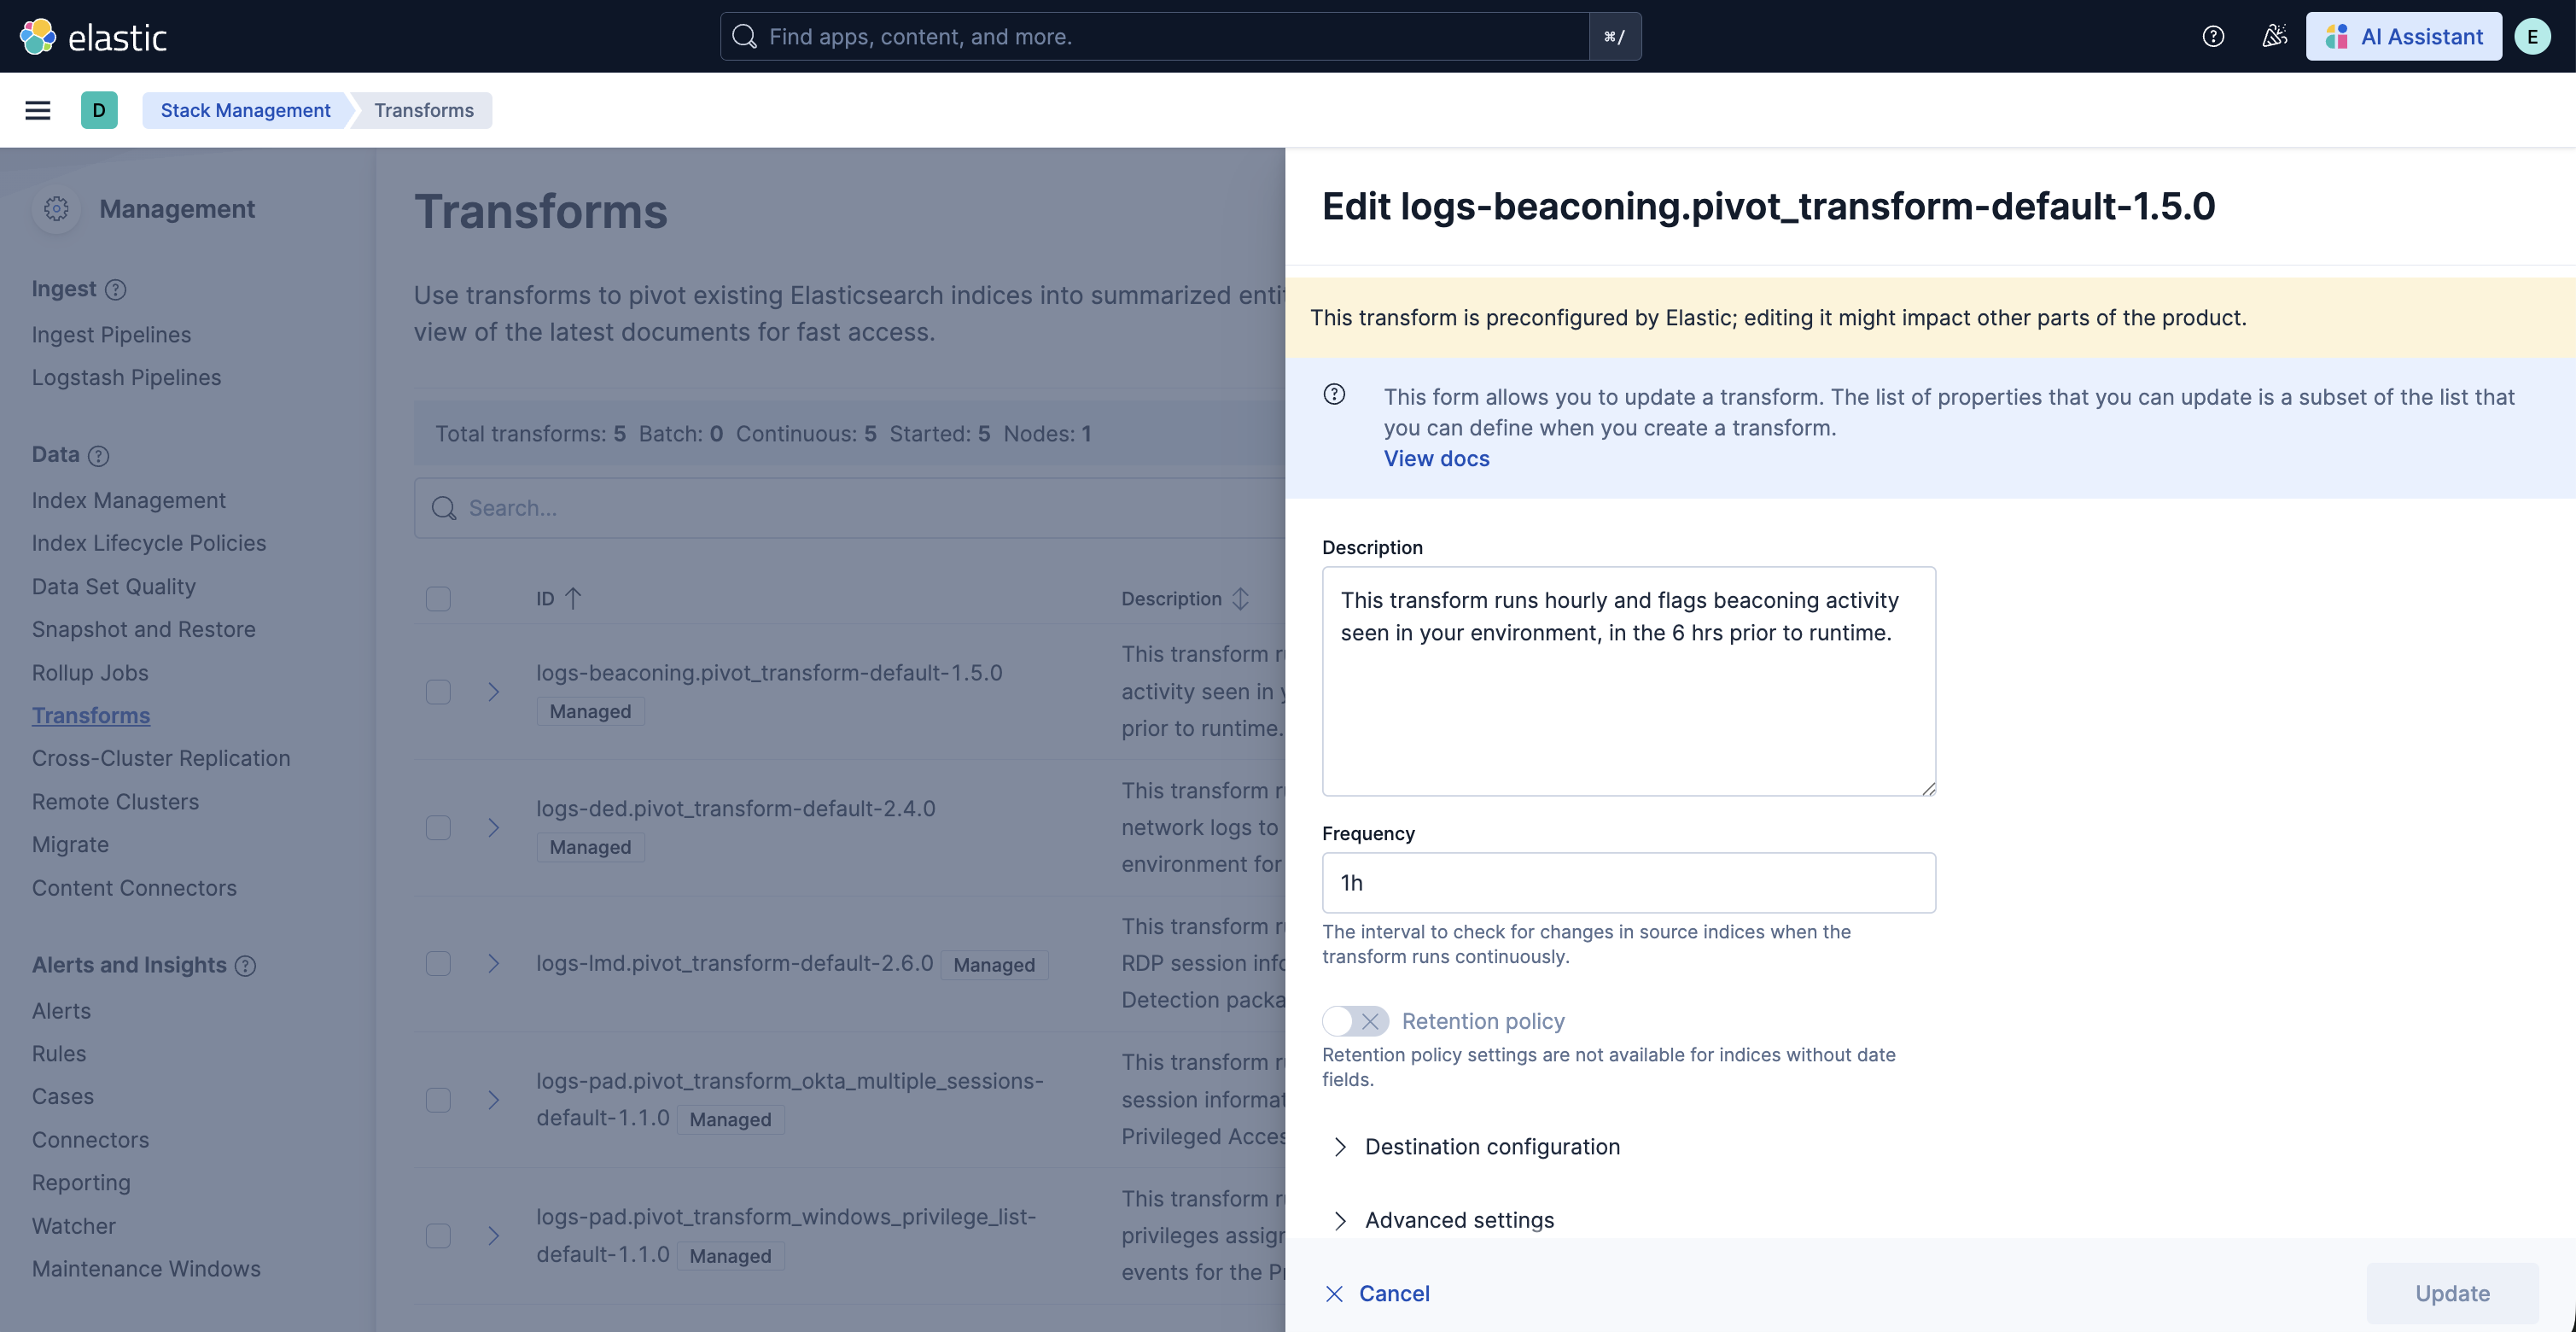
- To update settings such as retention policy, frequency, or destination configuration, stop the transform, click Edit from the Actions bar, make the required changes, and start the transform again.

- To update the query filters, go to Stack Management > Data > Transforms >
logs-beaconing.pivot_transform-default-<FLEET-TRANSFORM-VERSION>. - Click on the Actions bar at the far right of the transform and select the Clone option.

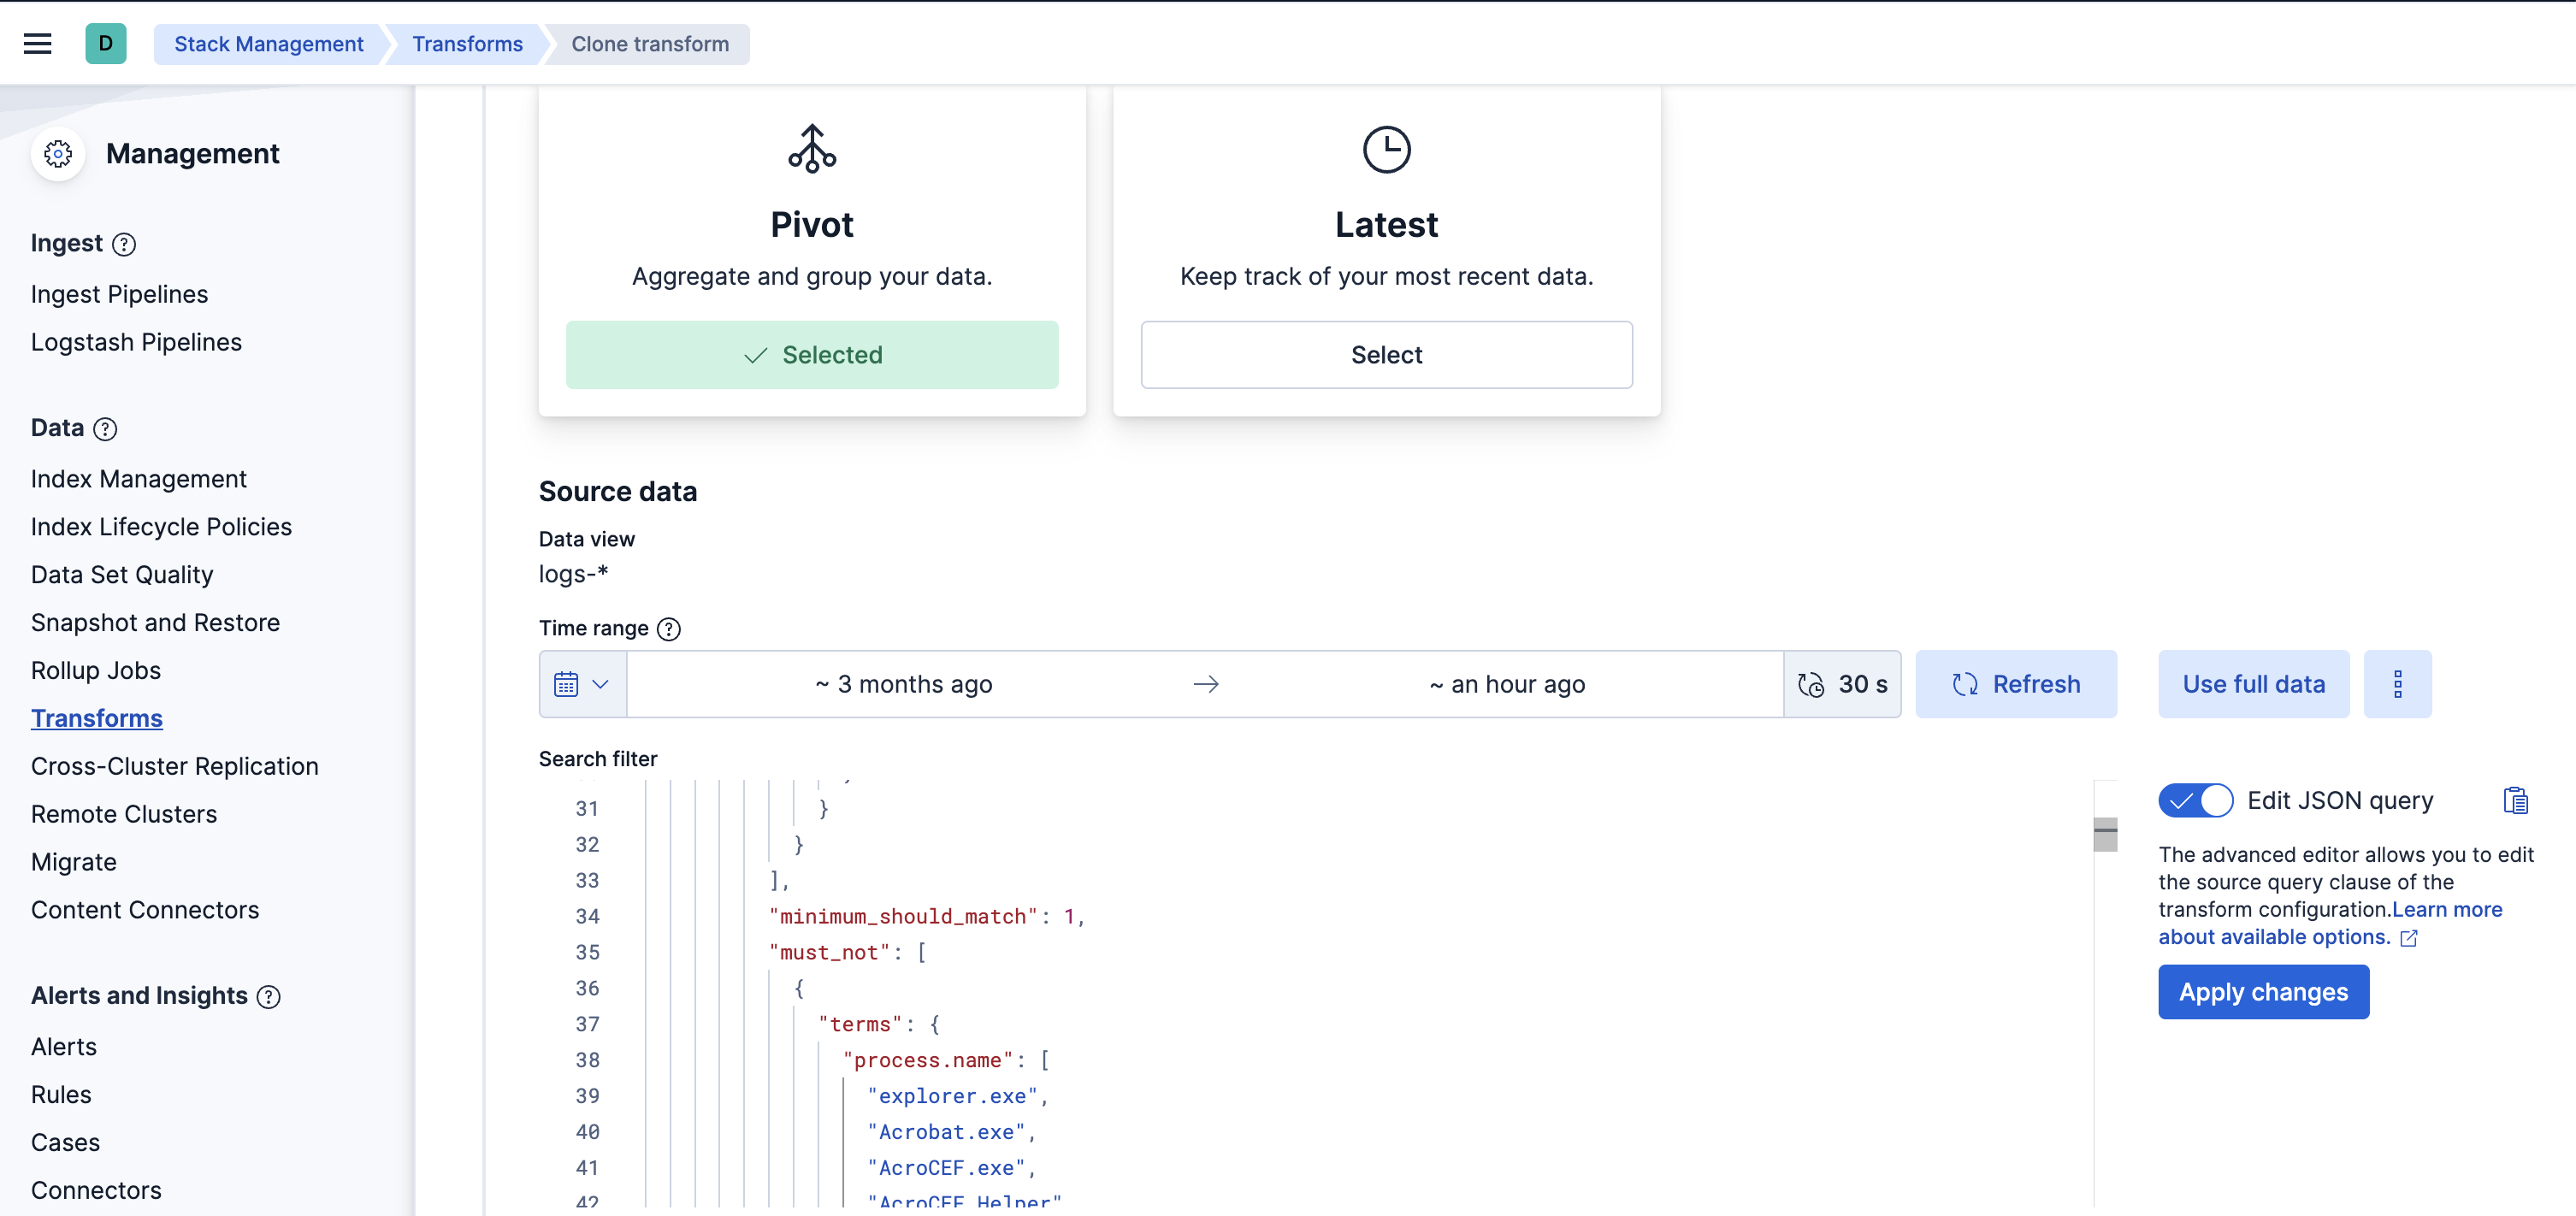
- In the new Clone transform window, go to the Search filter and update any field values you want to add or remove. Click on the Apply changes button on the right side to save these changes. Note: The image below shows an example of filtering a new
process.nameasexplorer.exe. You can follow a similar example and update the field value list based on your environment to help reduce noise and potential false positives.
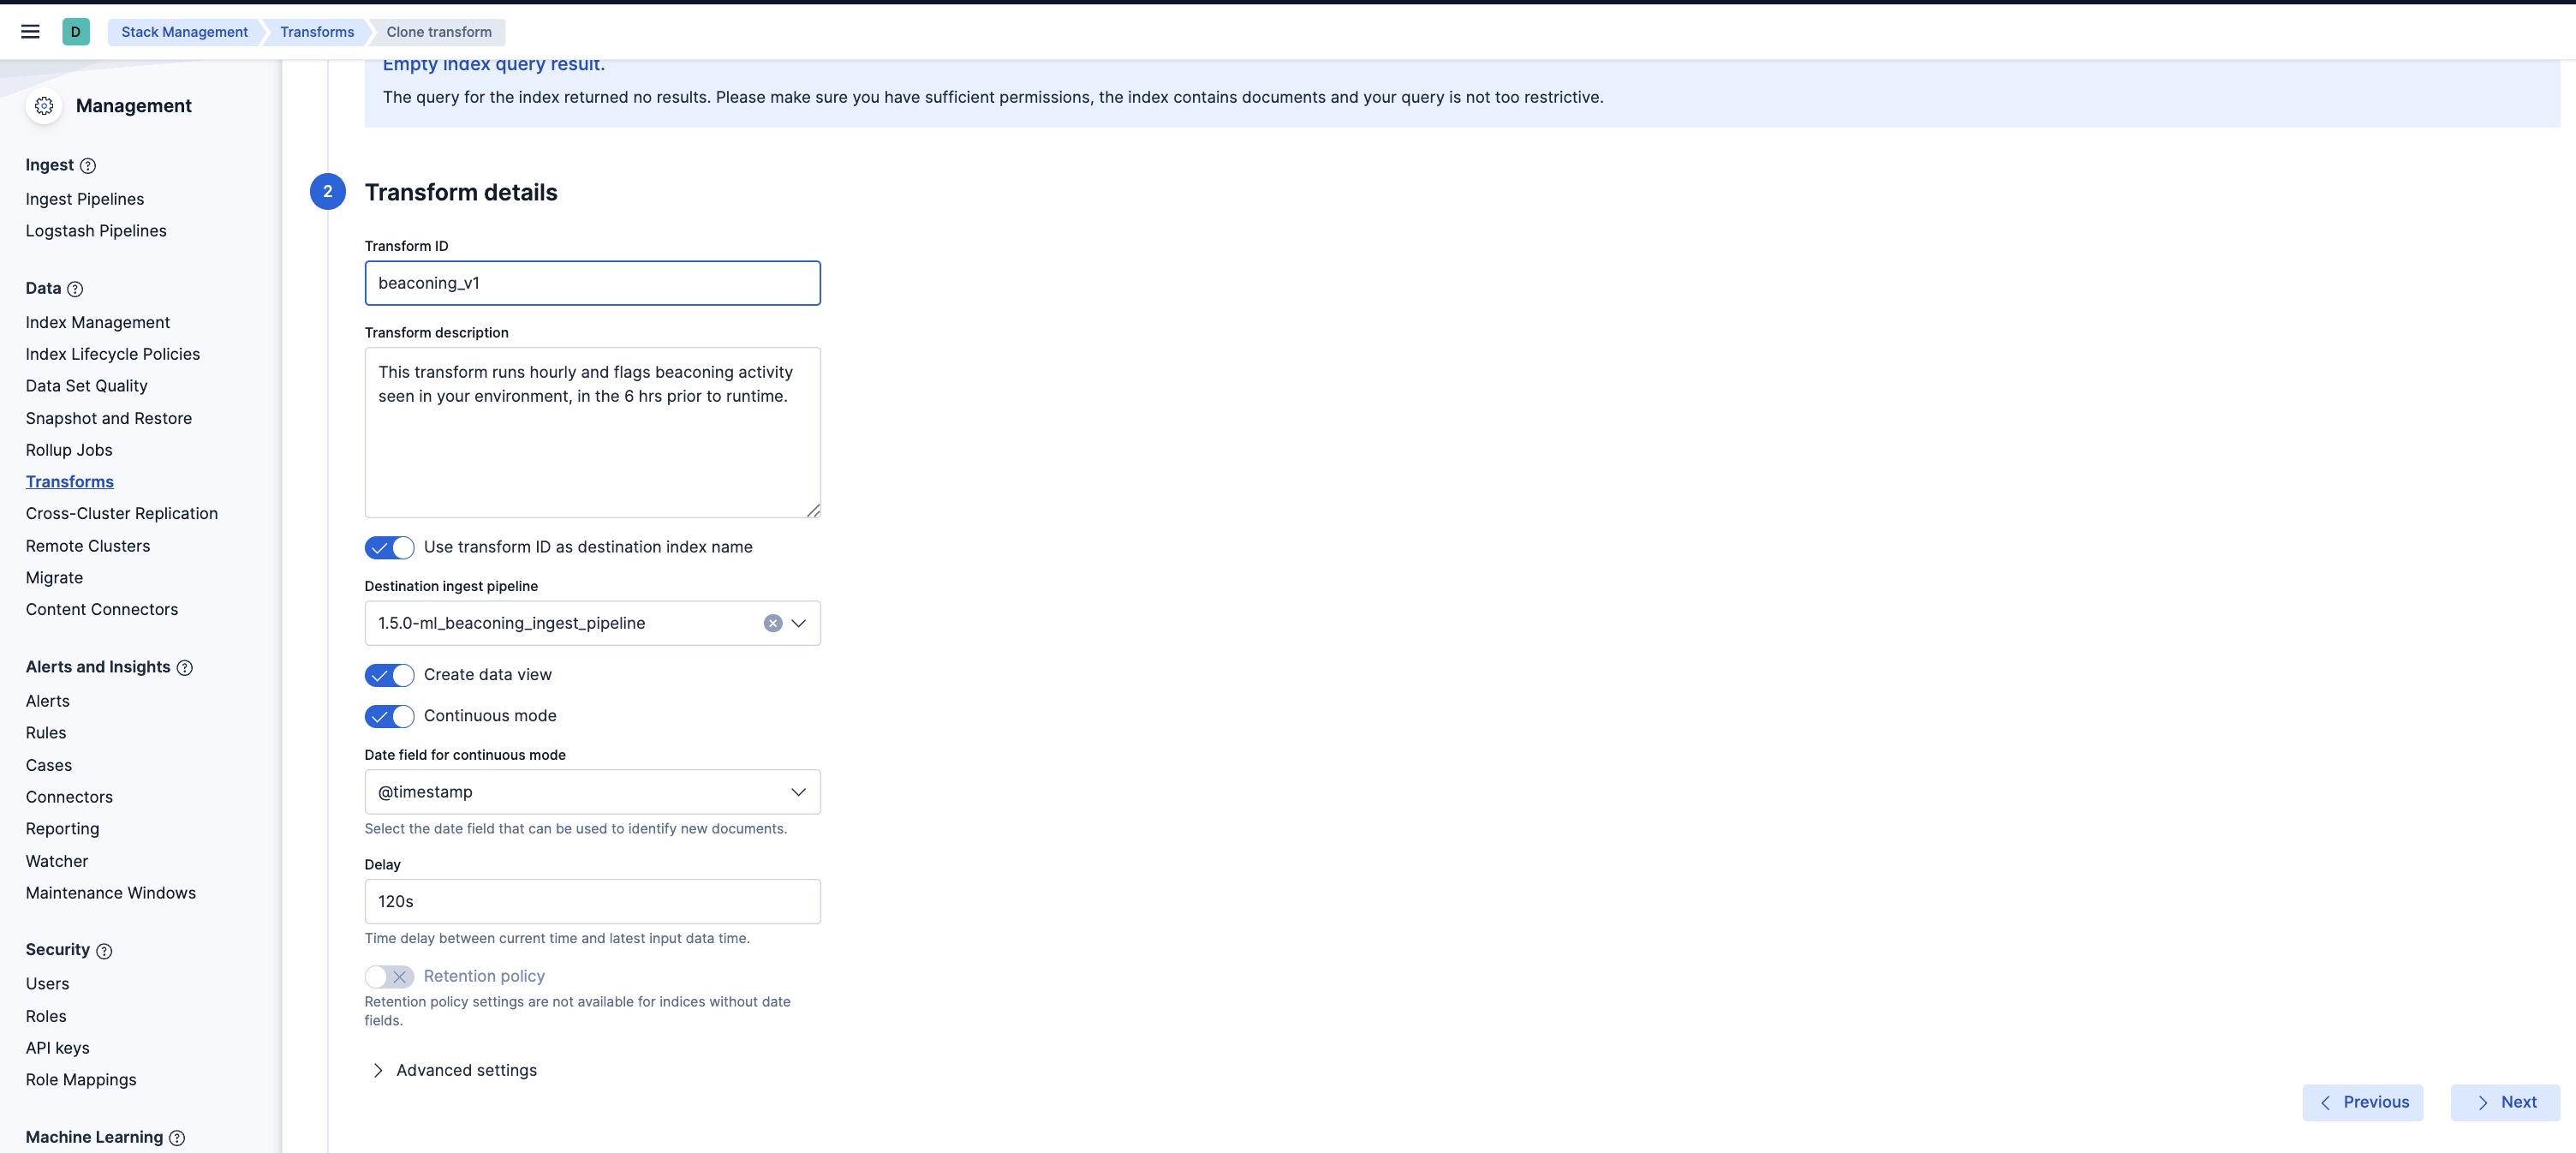
- Scroll down and select the Next button at the bottom right. Under the Transform details section, enter a new Transform ID and Destination index of your choice, then click on the Next button.

- Lastly, select the Create and Start option. Your updated transform will now start collecting data. Note: Do not forget to update your data view based on the new Destination index you have just created.

The Network Beaconing Identification has three dashboards:
- Network Beaconing: The main dashboard to monitor beaconing activity
- Beaconing Drilldown: Drilldown into relevant event logs and some statistics related to the beaconing activity
- Hosts Affected Over Time By Process Name: Monitor the spread of beaconing processes across hosts in your environment
This feature uses a transform to categorize network data by host and process name, then runs scripted metric aggregations on the host-process name pairs. For a given time window, the scripted metric aggregation checks each pair for the following:
- Signals repeating at regular intervals, accounting for minor variations in those intervals.
- Low variation of bytes sent from source to destination.
- Low variation of bytes sent from destination to source.
The transform, which runs every hour, also filters out common, known applications and IPs to reduce false positives. The transform outputs information about the detection, process, and host indicators, for example:
![]()
The values highlighted above are typical of beaconing behavior and can help with your investigation.
There are two places where you can customize which processes are on an exceptionlist for this detection. The first is in the transforms: these contain processes which are common, and thus it is beneficial for the transform's performance and data processing to keep some processes here. You can read more on how to customize the transforms in the next section.
We also provide a default exceptionlist in the rules, which you can inspect and customize in the UI. The source can be viewed here.
Advanced users can also tune the scripted metric aggregation's parameters, such as jitter percentage or time window. Navigate to Transforms on your Elastic cluster and find the transform installed by this package (search beaconing). You can browse the source of the transform there by clicking on the .json tab; the source code of the latest version can also be viewed here.
To overwrite the default parameters: stop the transform installed by the package, clone the transform, change the parameters of the cloned transform, then start the cloned transform. The configurable parameters are:
number_buckets_in_range: The number of time buckets into which the time window is split. Using more buckets improves estimates for various statistics, but also increases resource usage.time_bucket_length: The length of each time bucket. A higher value indicates a longer time window. Set this to a higher value to check for very low-frequency beacons.number_destination_ips: The number of destination IPs to collect in results. Setting this to a higher value increases resource usage.max_beaconing_bytes_cov: The maximum coefficient of variation in the payload bytes for the low source and destination bytes variance test. Higher values increase the chance of flagging traffic as beaconing, increasing recall while reducing precision.max_beaconing_count_rv: The maximum relative variance in the bucket counts for the high-frequency beacon test. As withmax_beaconing_bytes_cov, tuning this parameter involves a tradeoff between recall and precision.truncate_at: The lower and upper fraction of bucket values discarded when computingmax_beaconing_bytes_covandmax_beaconing_count_rv. This allows you to ignore occasional changes in traffic patterns. However, if you retain too small a fraction of the data, these tests will be unreliable.min_beaconing_count_autocovariance: The minimum autocorrelation of the signal for the low-frequency beacon test. Lowering this value generally increases recall for malicious command and control beacons, while reducing precision.max_jitter: The maximum amount of jitter assumed to be possible for a periodic beacon, as a fraction of its period.
You can also make changes to the transform query. The default query looks for beaconing activity over a 6-hour time range, but you can change it.
Beaconing is not used exclusively by malware. Many legitimate, benign processes also exhibit beacon-like activity. To reduce false positives, default filters in the transform query exclude known beaconing processes and IPs that fall into two groups:
- The source IP is local and the destination is remote.
- The destination IP is in a block of known Microsoft IP addresses.
You can create additional filters in the transform to meet the needs of your environment.
Changelog
| Version | Details | Minimum Kibana version |
|---|---|---|
| 1.5.2 | Enhancement (View pull request) Clarify prebuilt rules available from version 8.11.3 and above |
9.0.0 8.10.1 |
| 1.5.1 | Enhancement (View pull request) Update package docs with customization steps for ML jobs and transforms |
9.0.0 8.10.1 |
| 1.5.0 | Bug fix (View pull request) Add a transform filter to exclude cold and frozen tier data and support multiple timestamp formats |
9.0.0 8.10.1 |
| 1.4.0 | Enhancement (View pull request) Add source.ip to beaconing and fix indexing timestamp |
9.0.0 8.10.1 |
| 1.3.3 | Bug fix (View pull request) Update documentation on configuring data view for dashboards |
9.0.0 8.10.1 |
| 1.3.2 | Enhancement (View pull request) Update documentation on configuring data view for dashboards |
9.0.0 8.10.1 |
| 1.3.1 | Enhancement (View pull request) Update platform support docs |
9.0.0 8.10.1 |
| 1.3.0 | Enhancement (View pull request) Add support for Kibana 9.0.0 |
9.0.0 8.10.1 |
| 1.2.3 | Enhancement (View pull request) Add agent policy documentation |
8.10.1 |
| 1.2.2 | Bug fix (View pull request) Add field 'event.ingested' to transform, resolving detection rule backup timestamp |
8.10.1 |
| 1.2.1 | Enhancement (View pull request) Improve package installation documentation |
8.10.1 |
| 1.2.0 | Enhancement (View pull request) Update transform exceptionlist |
8.10.1 |
| 1.1.0 | Enhancement (View pull request) Update package docs |
8.10.1 |
| 1.0.0 | Enhancement (View pull request) Initial release of package (with Serverless support) |
8.10.1 |