- Filebeat Reference: other versions:
- Filebeat overview
- Quick start: installation and configuration
- Set up and run
- Upgrade
- How Filebeat works
- Configure
- Inputs
- Multiline messages
- AWS CloudWatch
- AWS S3
- Azure Event Hub
- Azure Blob Storage
- Benchmark
- CEL
- Cloud Foundry
- CometD
- Container
- Entity Analytics
- ETW
- filestream
- GCP Pub/Sub
- Google Cloud Storage
- HTTP Endpoint
- HTTP JSON
- journald
- Kafka
- Log
- MQTT
- NetFlow
- Office 365 Management Activity API
- Redis
- Salesforce
- Stdin
- Streaming
- Syslog
- TCP
- UDP
- Unix
- winlog
- Modules
- General settings
- Project paths
- Config file loading
- Output
- Kerberos
- SSL
- Index lifecycle management (ILM)
- Elasticsearch index template
- Kibana endpoint
- Kibana dashboards
- Processors
- Define processors
- add_cloud_metadata
- add_cloudfoundry_metadata
- add_docker_metadata
- add_fields
- add_host_metadata
- add_id
- add_kubernetes_metadata
- add_labels
- add_locale
- add_network_direction
- add_nomad_metadata
- add_observer_metadata
- add_process_metadata
- add_tags
- append
- cache
- community_id
- convert
- copy_fields
- decode_base64_field
- decode_cef
- decode_csv_fields
- decode_duration
- decode_json_fields
- decode_xml
- decode_xml_wineventlog
- decompress_gzip_field
- detect_mime_type
- dissect
- dns
- drop_event
- drop_fields
- extract_array
- fingerprint
- include_fields
- move_fields
- parse_aws_vpc_flow_log
- rate_limit
- registered_domain
- rename
- replace
- script
- syslog
- timestamp
- translate_ldap_attribute
- translate_sid
- truncate_fields
- urldecode
- Autodiscover
- Internal queue
- Logging
- HTTP endpoint
- Regular expression support
- Instrumentation
- Feature flags
- filebeat.reference.yml
- Inputs
- How to guides
- Override configuration settings
- Load the Elasticsearch index template
- Change the index name
- Load Kibana dashboards
- Load ingest pipelines
- Enrich events with geoIP information
- Deduplicate data
- Parse data using an ingest pipeline
- Use environment variables in the configuration
- Avoid YAML formatting problems
- Migrate
log
input configurations tofilestream
- Migrating from a Deprecated Filebeat Module
- Modules
- Modules overview
- ActiveMQ module
- Apache module
- Auditd module
- AWS module
- AWS Fargate module
- Azure module
- CEF module
- Check Point module
- Cisco module
- CoreDNS module
- CrowdStrike module
- Cyberark PAS module
- Elasticsearch module
- Envoyproxy Module
- Fortinet module
- Google Cloud module
- Google Workspace module
- HAproxy module
- IBM MQ module
- Icinga module
- IIS module
- Iptables module
- Juniper module
- Kafka module
- Kibana module
- Logstash module
- Microsoft module
- MISP module
- MongoDB module
- MSSQL module
- MySQL module
- MySQL Enterprise module
- NATS module
- NetFlow module
- Nginx module
- Office 365 module
- Okta module
- Oracle module
- Osquery module
- Palo Alto Networks module
- pensando module
- PostgreSQL module
- RabbitMQ module
- Redis module
- Salesforce module
- Santa module
- Snyk module
- Sophos module
- Suricata module
- System module
- Threat Intel module
- Traefik module
- Zeek (Bro) Module
- ZooKeeper module
- Zoom module
- Exported fields
- ActiveMQ fields
- Apache fields
- Auditd fields
- AWS fields
- AWS CloudWatch fields
- AWS Fargate fields
- Azure fields
- Beat fields
- Decode CEF processor fields fields
- CEF fields
- Checkpoint fields
- Cisco fields
- Cloud provider metadata fields
- Coredns fields
- Crowdstrike fields
- CyberArk PAS fields
- Docker fields
- ECS fields
- Elasticsearch fields
- Envoyproxy fields
- Fortinet fields
- Google Cloud Platform (GCP) fields
- google_workspace fields
- HAProxy fields
- Host fields
- ibmmq fields
- Icinga fields
- IIS fields
- iptables fields
- Jolokia Discovery autodiscover provider fields
- Juniper JUNOS fields
- Kafka fields
- kibana fields
- Kubernetes fields
- Log file content fields
- logstash fields
- Lumberjack fields
- Microsoft fields
- MISP fields
- mongodb fields
- mssql fields
- MySQL fields
- MySQL Enterprise fields
- NATS fields
- NetFlow fields
- Nginx fields
- Office 365 fields
- Okta fields
- Oracle fields
- Osquery fields
- panw fields
- Pensando fields
- PostgreSQL fields
- Process fields
- RabbitMQ fields
- Redis fields
- s3 fields
- Salesforce fields
- Google Santa fields
- Snyk fields
- sophos fields
- Suricata fields
- System fields
- threatintel fields
- Traefik fields
- Windows ETW fields
- Zeek fields
- ZooKeeper fields
- Zoom fields
- Monitor
- Secure
- Troubleshoot
- Get help
- Debug
- Understand logged metrics
- Common problems
- Error extracting container id while using Kubernetes metadata
- Can’t read log files from network volumes
- Filebeat isn’t collecting lines from a file
- Too many open file handlers
- Registry file is too large
- Inode reuse causes Filebeat to skip lines
- Log rotation results in lost or duplicate events
- Open file handlers cause issues with Windows file rotation
- Filebeat is using too much CPU
- Dashboard in Kibana is breaking up data fields incorrectly
- Fields are not indexed or usable in Kibana visualizations
- Filebeat isn’t shipping the last line of a file
- Filebeat keeps open file handlers of deleted files for a long time
- Filebeat uses too much bandwidth
- Error loading config file
- Found unexpected or unknown characters
- Logstash connection doesn’t work
- Publishing to Logstash fails with "connection reset by peer" message
- @metadata is missing in Logstash
- Not sure whether to use Logstash or Beats
- SSL client fails to connect to Logstash
- Monitoring UI shows fewer Beats than expected
- Dashboard could not locate the index-pattern
- High RSS memory usage due to MADV settings
- Contribute to Beats
Auditd module
editAuditd module
editThe auditd
module collects and parses logs from the audit daemon
(auditd
).
Although Filebeat is able to parse logs by using the auditd
module,
Auditbeat offers more advanced
features for monitoring audit logs.
When you run the module, it performs a few tasks under the hood:
- Sets the default paths to the log files (but don’t worry, you can override the defaults)
- Makes sure each multiline log event gets sent as a single event
- Uses an Elasticsearch ingest pipeline to parse and process the log lines, shaping the data into a structure suitable for visualizing in Kibana
- Deploys dashboards for visualizing the log data
Read the quick start to learn how to configure and run modules.
Compatibility
editThe auditd
module was tested with logs from auditd
on OSes like CentOS
6 and CentOS 7.
This module is not available for Windows.
Configure the module
editYou can further refine the behavior of the auditd
module by specifying
variable settings in the
modules.d/auditd.yml
file, or overriding settings at the command line.
You must enable at least one fileset in the module. Filesets are disabled by default.
The following example shows how to set paths in the modules.d/auditd.yml
file to override the default paths for logs:
- module: auditd log: enabled: true var.paths: ["/path/to/log/audit/audit.log*"]
To specify the same settings at the command line, you use:
-M "auditd.log.var.paths=[/path/to/log/audit/audit.log*]"
Variable settings
editEach fileset has separate variable settings for configuring the behavior of the
module. If you don’t specify variable settings, the auditd
module uses
the defaults.
For advanced use cases, you can also override input settings. See Override input settings.
When you specify a setting at the command line, remember to prefix the
setting with the module name, for example, auditd.log.var.paths
instead of log.var.paths
.
log
fileset settings
edit-
var.paths
-
An array of glob-based paths that specify where to look for the log files. All
patterns supported by Go Glob
are also supported here. For example, you can use wildcards to fetch all files
from a predefined level of subdirectories:
/path/to/log/*/*.log
. This fetches all.log
files from the subfolders of/path/to/log
. It does not fetch log files from the/path/to/log
folder itself. If this setting is left empty, Filebeat will choose log paths based on your operating system.
Example dashboard
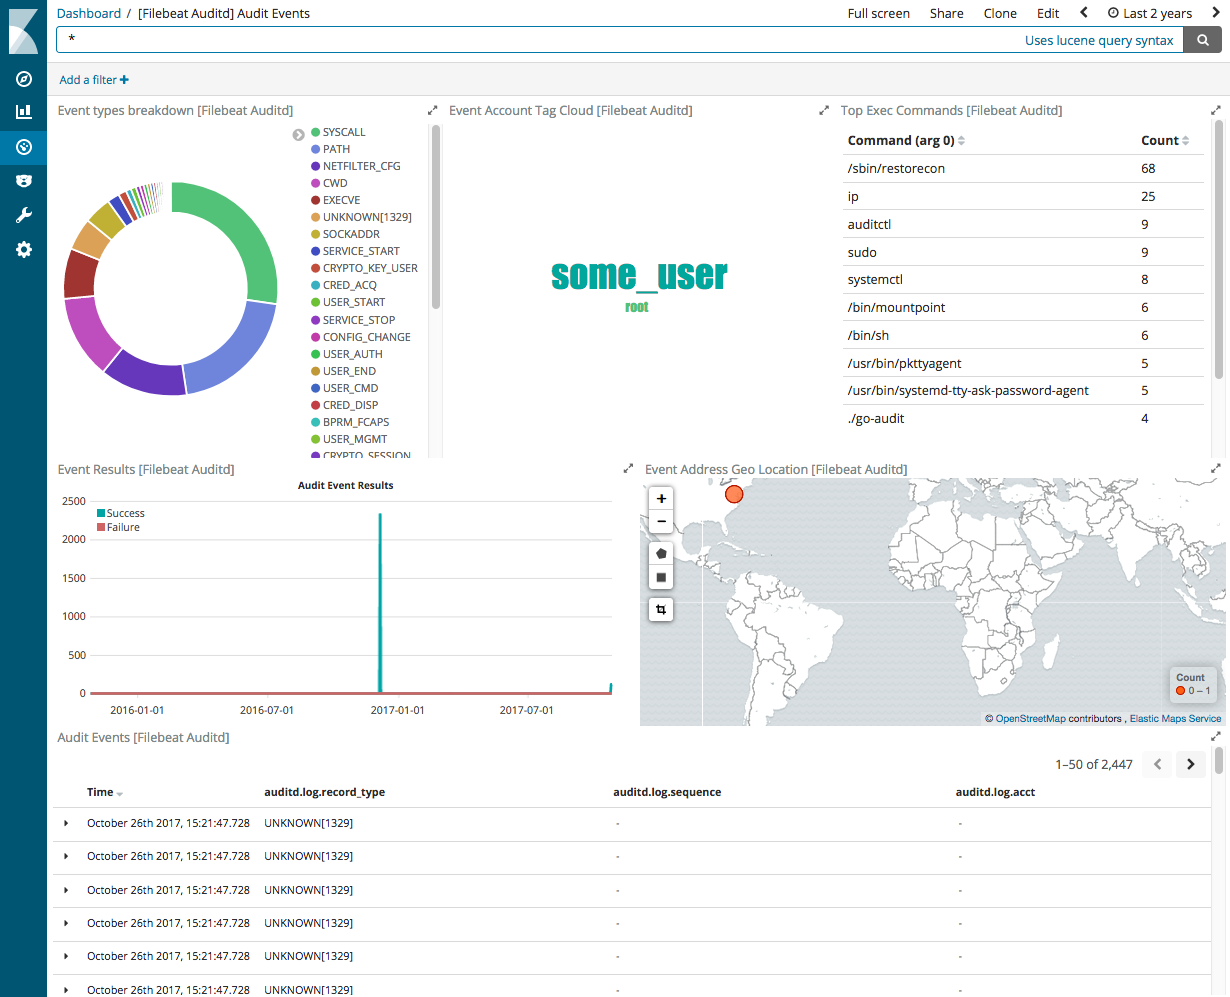
editThis module comes with a sample dashboard showing an overview of the audit log data. You can build more specific dashboards that are tailored to the audit rules that you use on your systems.
Fields
editFor a description of each field in the module, see the exported fields section.
On this page
ElasticON events are back!
Learn about the Elastic Search AI Platform from the experts at our live events.
Register now