Airflow Integration
| Version | 1.0.0 (View all) |
| Subscription level What's this? |
Basic |
| Developed by What's this? |
Elastic |
| Ingestion method(s) | Network Protocol |
| Minimum Kibana version(s) | 9.0.0 8.13.0 |
Airflow is an open-source platform for programmatically authoring, scheduling, and monitoring workflows. It allows users to define workflows as Directed Acyclic Graphs (DAGs) of tasks, which are then executed by the Airflow scheduler on an array of workers while following the specified dependencies.
Use the Airflow integration to:
- Collect detailed metrics from Airflow using StatsD to gain insights into system performance.
- Create informative visualizations to track usage trends, measure key metrics, and derive actionable business insights.
- Monitor your workflows' performance and status in real-time.
The Airflow package is tested with Airflow 2.4.3. It should work with any 2.* version.
The Airflow integration gathers metric data.
Metrics provide insight into the statistics of Airflow. The Metric data stream collected by the Airflow integration is statsd, enabling users to monitor and troubleshoot the performance of the Airflow instance.
Data stream:
statsd: Collects metrics related to scheduler activities, pool usage, task execution details, executor performance, and worker states in Airflow.
Note:
- Users can monitor and view metrics within the ingested documents for Airflow in the
metrics-*index pattern fromDiscover.
Users require Elasticsearch to store and search user data, and Kibana to visualize and manage it. They can utilize the hosted Elasticsearch Service on Elastic Cloud, which is recommended, or self-manage the Elastic Stack on their own hardware.
For step-by-step instructions on how to set up an integration, refer to the Getting started guide.
Be sure to follow the official Airflow Installation Guide for the correct installation of Airflow.
Include the following lines in the user's Airflow configuration file (e.g. airflow.cfg). Leave statsd_prefix empty and replace %HOST% with the address where the Agent is running:
[metrics]
statsd_on = True
statsd_host = %HOST%
statsd_port = 8125
statsd_prefix =
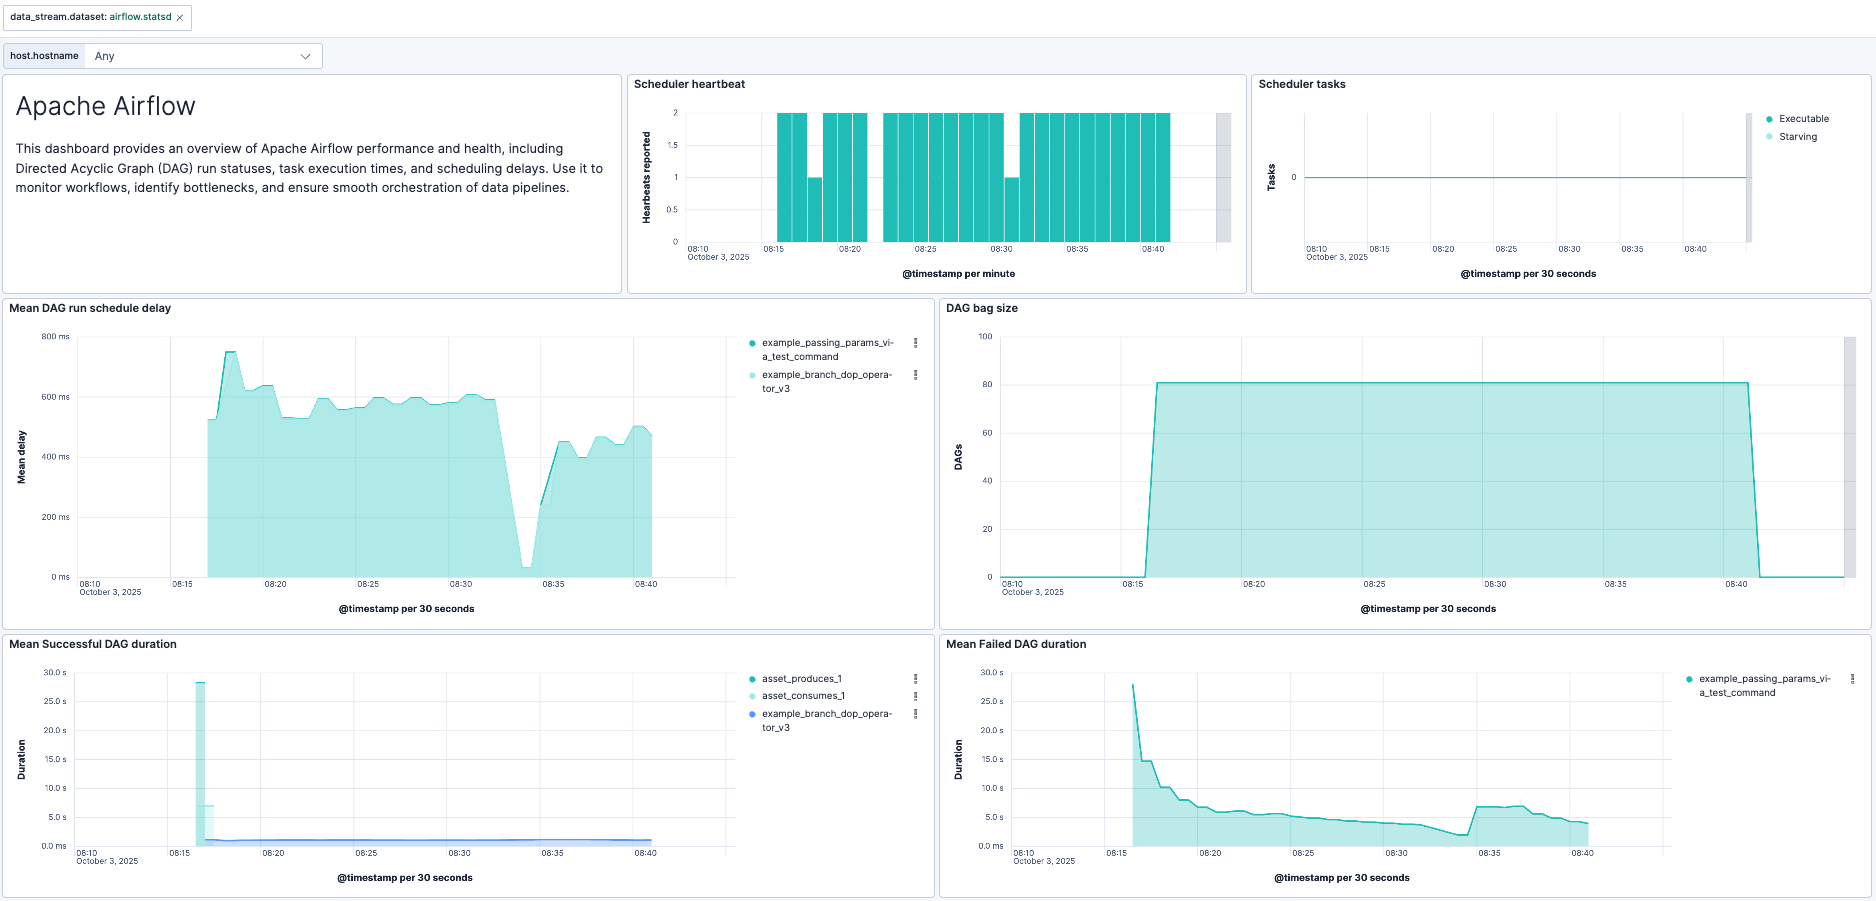
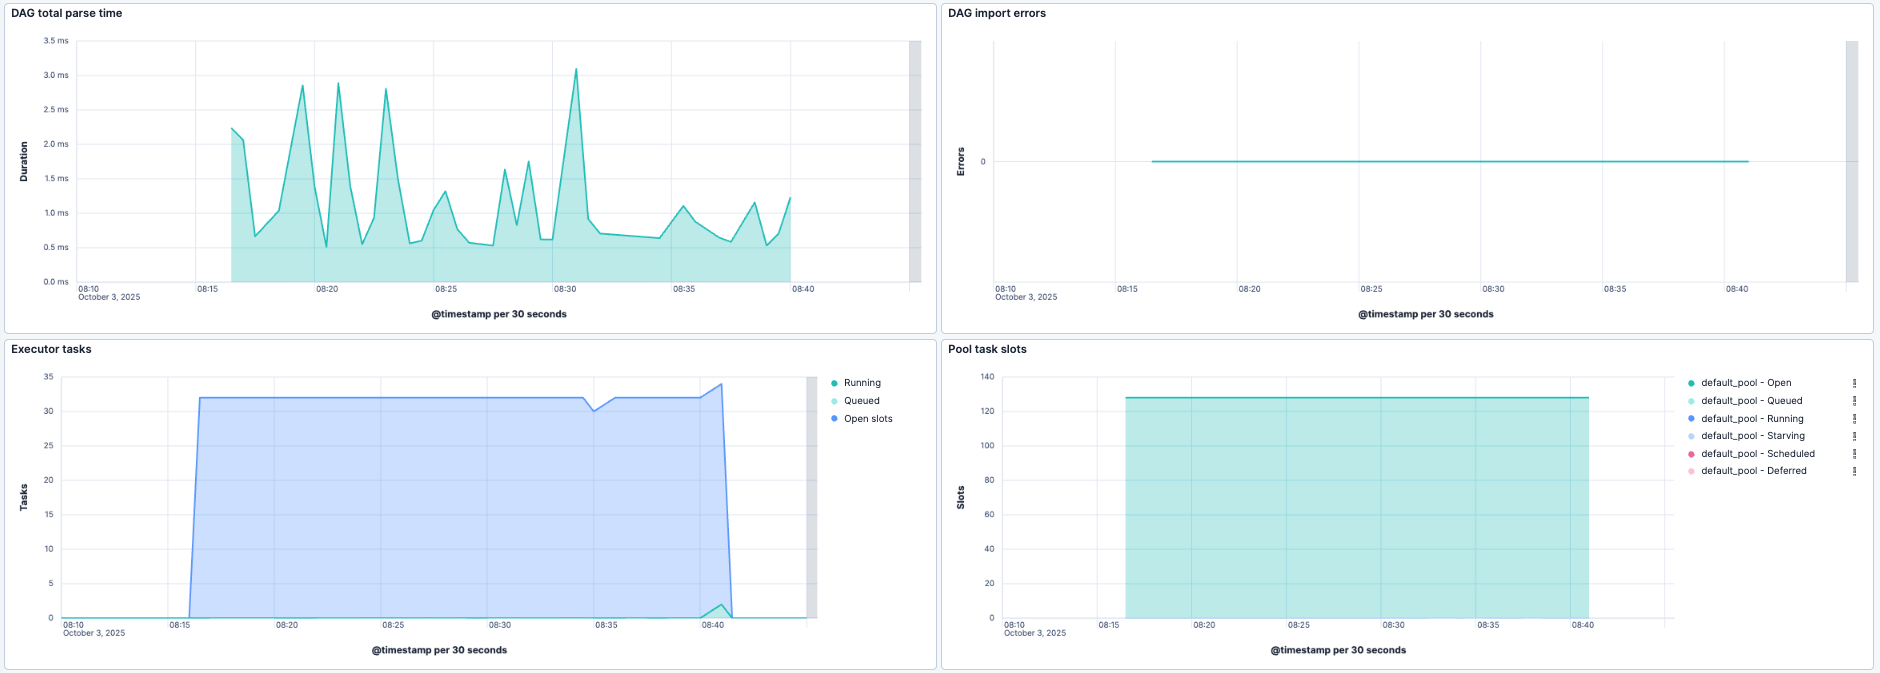
Once the integration is set up, you can click on the Assets tab in the Airflow integration to see a list of available dashboards. Choose the dashboard that corresponds to your configured data stream. The dashboard should be populated with the required data.
- Check if the StatsD server is receiving data from Airflow by examining the logs for potential errors.
- Make sure the
%HOST%placeholder in the Airflow configuration file is replaced with the correct address of the machine where the StatsD server is running. - If Airflow metrics are not being emitted, confirm that the
[metrics]section in theairflow.cfgfile is properly configured as per the instructions above.
This is the statsd data stream, which collects metrics related to scheduler activities, pool usage, task execution details, executor performance, and worker states in Airflow.
Example
{
    "@timestamp": "2024-06-18T07:24:40.220Z",
    "agent": {
        "ephemeral_id": "82e52250-5f2d-4fad-9f19-b88a209229db",
        "id": "97400795-188c-4140-a1ee-0002078c785d",
        "name": "docker-fleet-agent",
        "type": "metricbeat",
        "version": "8.13.0"
    },
    "airflow": {
        "scheduler_critical_section_duration": {
            "count": 1,
            "max": 7,
            "mean": 7,
            "mean_rate": 0.25568506211340597,
            "median": 7,
            "min": 7,
            "stddev": 0
        }
    },
    "data_stream": {
        "dataset": "airflow.statsd",
        "namespace": "ep",
        "type": "metrics"
    },
    "ecs": {
        "version": "8.17.0"
    },
    "elastic_agent": {
        "id": "97400795-188c-4140-a1ee-0002078c785d",
        "snapshot": false,
        "version": "8.13.0"
    },
    "event": {
        "agent_id_status": "verified",
        "dataset": "airflow.statsd",
        "ingested": "2024-06-18T07:24:50Z",
        "module": "statsd"
    },
    "host": {
        "architecture": "x86_64",
        "containerized": true,
        "hostname": "docker-fleet-agent",
        "id": "8259e024976a406e8a54cdbffeb84fec",
        "ip": [
            "192.168.245.7"
        ],
        "mac": [
            "02-42-C0-A8-F5-07"
        ],
        "name": "docker-fleet-agent",
        "os": {
            "codename": "focal",
            "family": "debian",
            "kernel": "3.10.0-1160.102.1.el7.x86_64",
            "name": "Ubuntu",
            "platform": "ubuntu",
            "type": "linux",
            "version": "20.04.6 LTS (Focal Fossa)"
        }
    },
    "metricset": {
        "name": "server"
    },
    "service": {
        "type": "statsd"
    }
}
ECS Field Reference
Please refer to the following document for detailed information on ECS fields.
Exported fields
| Field | Description | Type | Metric Type |
|---|---|---|---|
| @timestamp | Event timestamp. | date | |
| agent.id | keyword | ||
| airflow.*.count | Airflow counters | object | counter |
| airflow.*.max | Airflow max timers metric | object | |
| airflow.*.mean | Airflow mean timers metric | object | |
| airflow.*.mean_rate | Airflow mean rate timers metric | object | |
| airflow.*.median | Airflow median timers metric | object | |
| airflow.*.min | Airflow min timers metric | object | |
| airflow.*.stddev | Airflow standard deviation timers metric | object | |
| airflow.*.value | Airflow gauges | object | gauge |
| airflow.dag_file | Airflow dag file metadata | keyword | |
| airflow.dag_id | Airflow dag id metadata | keyword | |
| airflow.job_name | Airflow job name metadata | keyword | |
| airflow.operator_name | Airflow operator name metadata | keyword | |
| airflow.pool_name | Airflow pool name metadata | keyword | |
| airflow.scheduler_heartbeat.count | Airflow scheduler heartbeat | double | |
| airflow.status | Airflow status metadata | keyword | |
| airflow.task_id | Airflow task id metadata | keyword | |
| cloud.account.id | The cloud account or organization id used to identify different entities in a multi-tenant environment. Examples: AWS account id, Google Cloud ORG Id, or other unique identifier. | keyword | |
| cloud.availability_zone | Availability zone in which this host is running. | keyword | |
| cloud.image.id | Image ID for the cloud instance. | keyword | |
| cloud.instance.id | Instance ID of the host machine. | keyword | |
| cloud.provider | Name of the cloud provider. Example values are aws, azure, gcp, or digitalocean. | keyword | |
| cloud.region | Region in which this host is running. | keyword | |
| container.id | Unique container id. | keyword | |
| data_stream.dataset | Data stream dataset. | constant_keyword | |
| data_stream.namespace | Data stream namespace. | constant_keyword | |
| data_stream.type | Data stream type. | constant_keyword | |
| event.dataset | Event dataset | constant_keyword | |
| event.module | Event module | constant_keyword | |
| host.containerized | If the host is a container. | boolean | |
| host.name | Name of the host. It can contain what hostname returns on Unix systems, the fully qualified domain name, or a name specified by the user. The sender decides which value to use. |
keyword | |
| host.os.build | OS build information. | keyword | |
| host.os.codename | OS codename, if any. | keyword | |
| service.address | Service address | keyword |
This integration includes one or more Kibana dashboards that visualizes the data collected by the integration. The screenshots below illustrate how the ingested data is displayed.
Changelog
| Version | Details | Minimum Kibana version |
|---|---|---|
| 1.0.0 | Enhancement (View pull request) Make Airflow package GA. |
9.0.0 8.13.0 |
| 0.11.0 | Enhancement (View pull request) Improve documentation |
9.0.0 8.13.0 |
| 0.10.0 | Enhancement (View pull request) Add support for Kibana 9.0.0. |
9.0.0 8.13.0 |
| 0.9.1 | Bug fix (View pull request) Update links to getting started docs |
8.13.0 |
| 0.9.0 | Enhancement (View pull request) ECS version updated to 8.11.0. Update the kibana constraint to ^8.13.0. Modified the field definitions to remove ECS fields made redundant by the ecs@mappings component template. |
8.13.0 |
| 0.8.0 | Enhancement (View pull request) Add global filter on data_stream.dataset to improve performance. |
8.11.0 |
| 0.7.0 | Enhancement (View pull request) Update documentation. |
8.11.0 |
| 0.6.0 | Enhancement (View pull request) Update to Kibana 8.11 to support enhanced statsd implementation, and add system test cases. |
8.11.0 |
| 0.5.1 | Bug fix (View pull request) Add dimension field for container.id which was previously missed during package-spec v3 migration |
8.9.0 |
| 0.5.0 | Enhancement (View pull request) Update the package format_version to 3.0.0. |
8.9.0 |
| 0.4.0 | Enhancement (View pull request) Enable time series data streams for the metrics datasets. This dramatically reduces storage for metrics and is expected to progressively improve query performance. For more details, see https://www.elastic.co/guide/en/elasticsearch/reference/current/tsds.html. |
8.9.0 |
| 0.3.1 | Bug fix (View pull request) Remove metric_type mapping for 'airflow.scheduler.heartbeat' field and adjust the dashboard to visualize this field using 'last_value'. |
8.5.0 |
| 0.3.0 | Enhancement (View pull request) Revert metrics field definition to the format used before introducing metric_type. |
8.5.0 |
| 0.2.0 | Enhancement (View pull request) Add metric_type mapping for the fields of statsd datastream. |
8.5.0 |
| 0.1.0 | Enhancement (View pull request) Rename ownership from obs-service-integrations to obs-infraobs-integrations |
8.5.0 |
| 0.0.5 | Bug fix (View pull request) Modifed the dimension field mapping to support public cloud deployment. |
8.5.0 |
| 0.0.4 | Enhancement (View pull request) Added dimensions fields to enable TSDB. |
8.5.0 |
| 0.0.3 | Enhancement (View pull request) Added categories and/or subcategories. |
8.5.0 |
| 0.0.2 | Enhancement (View pull request) add dashboards |
8.5.0 |
| 0.0.1 | Enhancement (View pull request) initial release |
8.5.0 |

