Apache Tomcat Integration
| Version | 1.13.0 (View all) |
| Subscription level What's this? |
Basic |
| Developed by What's this? |
Elastic |
| Ingestion method(s) | File, Prometheus |
| Minimum Kibana version(s) | 9.0.0 8.13.0 |
Apache Tomcat is a free and open-source implementation of the jakarta servlet, jakarta expression language, and websocket technologies. It provides a pure java http web server environment in which java code can also run. Thus, it is a java web application server, although not a full JEE application server.
Use the Apache Tomcat integration to:
- Collect metrics related to the cache, connection pool, memory, request, session and thread pool and collect logs related to access, catalina, and localhost.
- Create visualizations to monitor, measure and analyze the usage trend and key data, and derive business insights.
- Create alerts to reduce the MTTD and also the MTTR by referencing relevant logs when troubleshooting an issue.
The Apache Tomcat integration collects logs and metrics data.
Logs help you keep a record of events that happen on your machine. The Log data streams collected by Apache Tomcat integration are access, catalina, and localhost, so that users can keep track of the IP addresses of the clients, bytes returned to the client or sent by clients, etc., so that users could monitor and troubleshoot the performance of Java applications.
Metrics give you insight into the statistics of the Apache Tomcat. The Metric data streams collected by the Apache Tomcat integration are cache, connection pool, memory, request, session and thread pool, so that the user can monitor and troubleshoot the performance of the Apache Tomcat instance.
Data streams:
access: Collects information related to the HTTP transactions, client IP, response code and request processing time.cache: Collects information related to the overall cache of the Apache Tomcat instance.catalina: Collects information related to the startup and shutdown of the Apache Tomcat application server, the deployment of new applications, or the failure of one or more subsystems.connection pool: Collects information related to connection pool such as number of active and idle connections.localhost: Collects information related to Web application activity which is related to HTTP transactions between the application server and the client.memory: Collects information related to heap memory, non-heap memory and garbage collection of the Tomcat instance.request: Collects information related to requests of the Apache Tomcat instance.thread pool: Collects information related to the overall states of the threads, CPU time and processing termination time of the threads in the Tomcat instance.session: Collects information related to overall created, active and expired sessions of the Tomcat instance.
Note:
- Users can monitor and see the log inside the ingested documents for Apache Tomcat in the
logs-*index pattern fromDiscover, and for metrics, the index pattern ismetrics-*.
This integration has been tested against Apache Tomcat versions 10.1.5, 9.0.71 and 8.5.85, and Prometheus version 0.20.0.
You need Elasticsearch for storing and searching your data and Kibana for visualizing and managing it. You can use our hosted Elasticsearch Service on Elastic Cloud, which is recommended or self-manage the Elastic Stack on your own hardware.
In order to ingest data from the Apache Tomcat, user must have
- Configured Prometheus in Apache Tomcat instance
For step-by-step instructions on how to set up an integration, see the Getting started guide.
Here are the steps to configure Prometheus in Apache Tomcat instance:
Go to
<TOMCAT_HOME>/webappsfrom Apache Tomcat instance.Please find latest Prometheus version, replace in below command and perform from Apache Tomcat instance: -
wget https://repo1.maven.org/maven2/io/prometheus/jmx/jmx_prometheus_javaagent/<prometheus_version>/jmx_prometheus_javaagent-<prometheus_version>.jar
- Create
config.ymlfile in<TOMCAT_HOME>/webappsand paste the following content inconfig.ymlfile: -
rules:
- pattern: ".*"
- Go to
/etc/systemd/systemand add the following content within the[Service]section of thetomcat.servicefile: -
Environment='JAVA_OPTS=-javaagent:<TOMCAT_HOME>/webapps/jmx_prometheus_javaagent-<prometheus_version>.jar=<prometheus_port>:/opt/tomcat/webapps/config.yml'
- Run the following commands to reload the systemd manager configuration and restart the Apache Tomcat service to set the updated environment variable: -
systemctl daemon-reload
systemctl restart tomcat
Here are the steps to configure Log format in Apache Tomcat instance:
Go to
<TOMCAT_HOME>/conf/server.xmlfrom Apache Tomcat instance.The user can update the log format in the pattern field of the class
org.apache.catalina.valves.AccessLogValve. Here is an example of theorg.apache.catalina.valves.AccessLogValveclass.
<Valve className="org.apache.catalina.valves.AccessLogValve" directory="logs"
       prefix="localhost_access_log" suffix=".txt"
       pattern='%h %l %u %t "%r" %s %b %A %X %F "%{Referer}i" "%{User-Agent}i" X-Forwarded-For="%{X-Forwarded-For}i"' />
- The supported log formats are:
Common Log Format :- '%h %l %u %t "%r" %s %b ms:%D'
Combined Log Format :- '%h %l %u %t "%r" %s %b ms:%D "%{Referrer}i" "%{User-Agent}i"'
Combined Log Format + X-Forwarded-For header :- '%h %l %u %t "%r" %s %b ms:%D %A %X %F "%{Referer}i" "%{User-Agent}i" X-Forwarded-For="%{X-Forwarded-For}i"'
- Run the following commands to restart Apache Tomcat instance: -
systemctl restart tomcat
- With error stack trace:
dd-MMM-yyyy HH:mm:ss.SSS [Severity] [Subsystem] [Message Text] [Error Stack Trace]
- Without error stack trace:
dd-MMM-yyyy HH:mm:ss.SSS [Severity] [Subsystem] [Message Text]
Note:
- Restarting Apache Tomcat does not affect the virtual desktops that are currently running. It will only prevent new users from logging in for the duration of the restart process (typically several seconds).
- A user can support a new format of log by writing their own custom ingest pipelines. To facilitate the multiline parsing of catalina and localhost logs, the multiline configuration can be used to match the multiline pattern of logs.
You need the following information from your Apache Tomcat instance to configure this integration in Elastic:
Host Configuration Format: http[s]://<hostname>:<port>/<metrics_path>
Example Host Configuration: http://example.com:9090/metrics
After the integration is successfully configured, clicking on the Assets tab of the Apache Tomcat Integration should display a list of available dashboards. Click on the dashboard available for your configured data stream. It should be populated with the required data.
apache_tomcat.access.header_forwarderis renamed toclient.ipin version0.16.1of this integration. Hence please consider changingapache_tomcat.access.header_forwardertoclient.ipfield where it is being used. By using the Update By Query API,apache_tomcat.access.header_forwardercan be renamed toclient.ipfield for all the documents which would help to adapt this change.In case of data ingestion if user encounter following errors then it is because of the rate limit of Prometheus endpoint. Here there won't be any data loss but if user still want to avoid it then make sure configured Prometheus endpoint is not being accessed from multiple places.
{
  "error": {
    "message": "unable to decode response from prometheus endpoint: error making http request: Get \"http://127.0.0.1/metrics\": dial tcp 127.0.0.1: connect: connection refused"
  }
}
- If events are ingested with incorrect timestamps, kindly verify the Timezone setting for the Catalina and Localhost logs data streams on the 'Add Apache Tomcat' page.
This is the Access data stream. This data stream collects logs related to the HTTP transactions, client IP, response code and request processing time.
Example
{
    "@timestamp": "2025-02-11T10:27:25.000Z",
    "agent": {
        "ephemeral_id": "59700606-89fb-4853-b626-d2e4b8ea7635",
        "id": "935c33f0-cfd5-4af4-adbd-2185db27468c",
        "name": "elastic-agent-48650",
        "type": "filebeat",
        "version": "9.0.0"
    },
    "apache_tomcat": {
        "access": {
            "http": {
                "ident": "-",
                "useragent": "-"
            }
        }
    },
    "data_stream": {
        "dataset": "apache_tomcat.access",
        "namespace": "15310",
        "type": "logs"
    },
    "destination": {
        "bytes": 2237
    },
    "ecs": {
        "version": "8.11.0"
    },
    "elastic_agent": {
        "id": "935c33f0-cfd5-4af4-adbd-2185db27468c",
        "snapshot": true,
        "version": "9.0.0"
    },
    "event": {
        "agent_id_status": "verified",
        "category": [
            "web"
        ],
        "dataset": "apache_tomcat.access",
        "ingested": "2025-02-11T10:28:11Z",
        "kind": "event",
        "module": "apache_tomcat",
        "original": "192.168.255.4 - - [11/Feb/2025:10:27:25 +0000] \"GET / HTTP/1.1\" 400 2237",
        "outcome": "failure",
        "type": [
            "access"
        ]
    },
    "http": {
        "request": {
            "method": "GET"
        },
        "response": {
            "status_code": 400
        },
        "version": "1.1"
    },
    "input": {
        "type": "filestream"
    },
    "log": {
        "file": {
            "device_id": "64768",
            "fingerprint": "eeb052b19f510c012de8da7f6456cc5bbfe52abba100728092fbe35cb7732c8a",
            "inode": "234909928",
            "path": "/tmp/service_logs/localhost_access_log.2025-02-11.txt"
        },
        "offset": 0
    },
    "related": {
        "ip": [
            "192.168.255.4"
        ]
    },
    "source": {
        "ip": "192.168.255.4"
    },
    "tags": [
        "preserve_original_event",
        "forwarded",
        "apache_tomcat-access"
    ],
    "url": {
        "original": "/",
        "path": "/"
    }
}
ECS Field Reference
Please refer to the following document for detailed information on ECS fields.
Exported fields
| Field | Description | Type | Unit |
|---|---|---|---|
| @timestamp | Event timestamp. | date | |
| apache_tomcat.access.connection_status | Connection status when response is completed. | keyword | |
| apache_tomcat.access.http.ident | Remote logical username from identd. | keyword | |
| apache_tomcat.access.http.useragent | The user id of the authenticated user requesting the page (if HTTP authentication is used). | keyword | |
| apache_tomcat.access.ip.local | Local IP address. | ip | |
| apache_tomcat.access.request_process_time | Time taken to process the request, in millis | double | ms |
| apache_tomcat.access.response_time | Time taken to commit the response, in millis | double | ms |
| data_stream.dataset | Data stream dataset. | constant_keyword | |
| data_stream.namespace | Data stream namespace. | constant_keyword | |
| data_stream.type | Data stream type. | constant_keyword | |
| input.type | Type of Filebeat input. | keyword | |
| log.file.device_id | ID of the device containing the filesystem where the file resides. | keyword | |
| log.file.fingerprint | The sha256 fingerprint identity of the file when fingerprinting is enabled. | keyword | |
| log.file.idxhi | The high-order part of a unique identifier that is associated with a file. (Windows-only) | keyword | |
| log.file.idxlo | The low-order part of a unique identifier that is associated with a file. (Windows-only) | keyword | |
| log.file.inode | Inode number of the log file. | keyword | |
| log.file.vol | The serial number of the volume that contains a file. (Windows-only) | keyword | |
| log.offset | Log offset. | long |
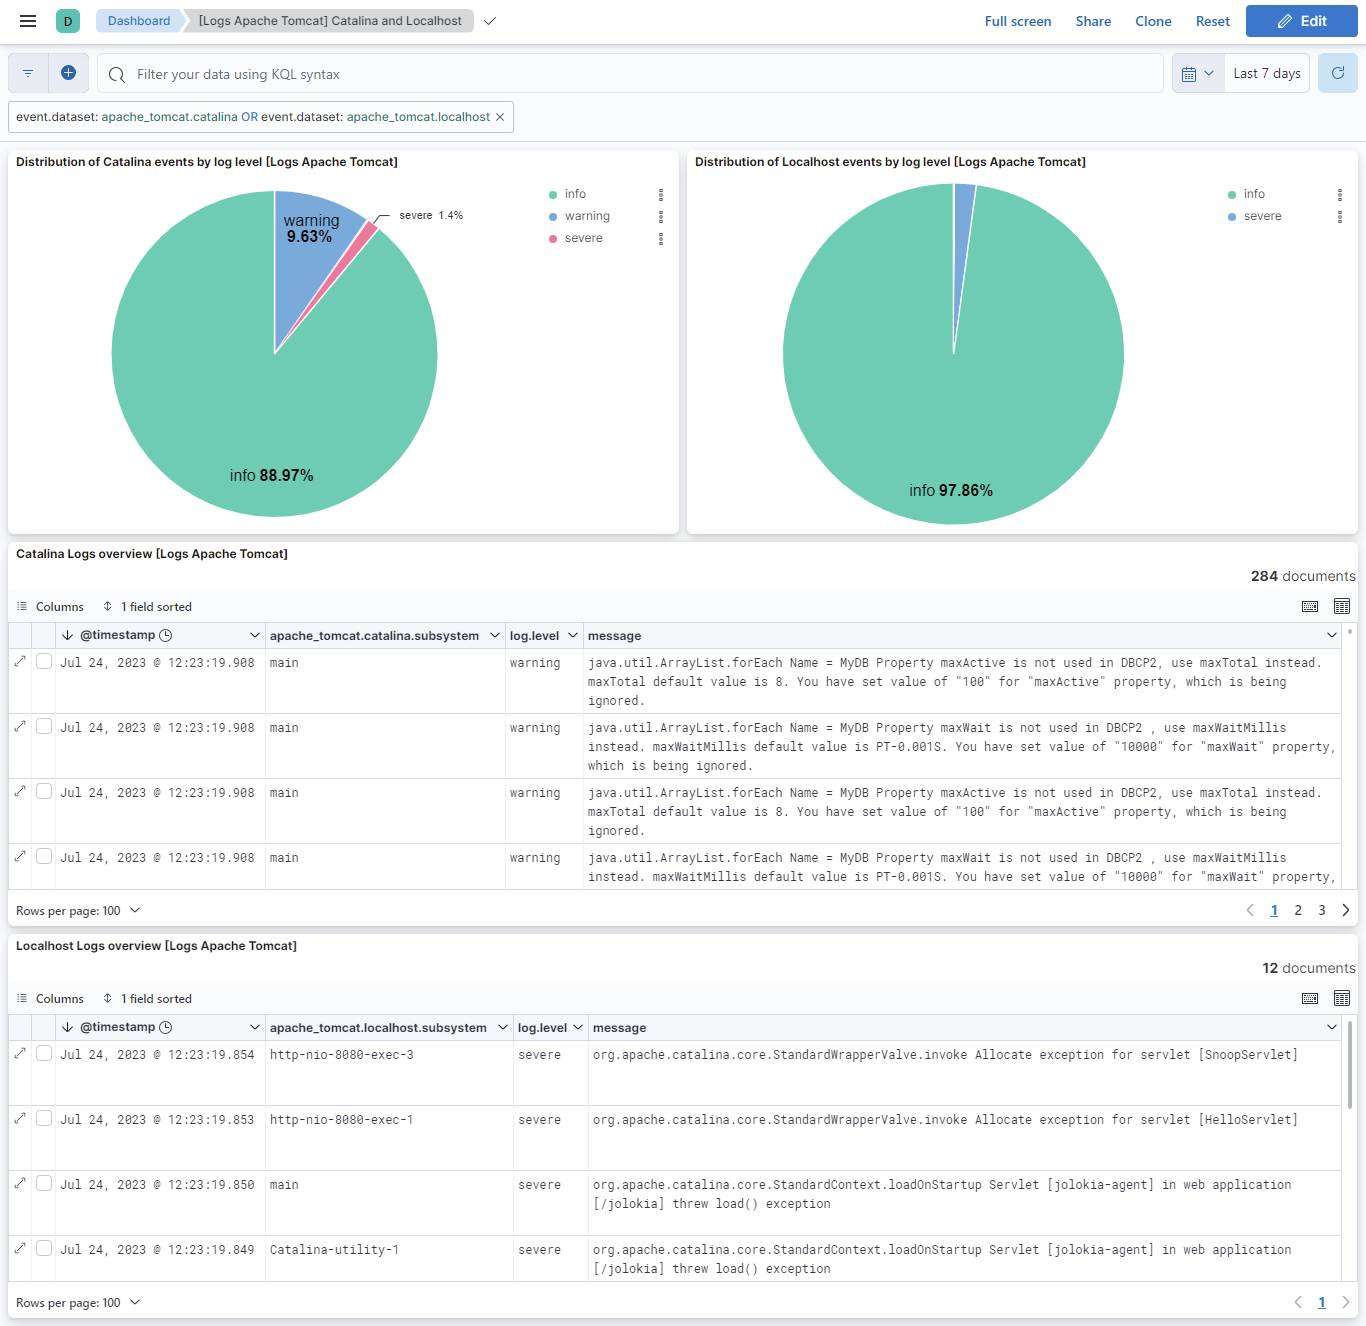
This is the Catalina data stream. This data stream collects logs related to the startup and shutdown of the Apache Tomcat application server, the deployment of new applications, or the failure of one or more subsystems.
Example
{
    "@timestamp": "2023-09-27T19:09:05.176Z",
    "agent": {
        "ephemeral_id": "077f3cfd-ea7d-49bc-a421-d85ae64524a4",
        "id": "86a82f91-ff66-4d28-ab7c-eb9350f317ed",
        "name": "docker-fleet-agent",
        "type": "filebeat",
        "version": "8.10.1"
    },
    "apache_tomcat": {
        "catalina": {
            "subsystem": "main"
        }
    },
    "data_stream": {
        "dataset": "apache_tomcat.catalina",
        "namespace": "ep",
        "type": "logs"
    },
    "ecs": {
        "version": "8.11.0"
    },
    "elastic_agent": {
        "id": "86a82f91-ff66-4d28-ab7c-eb9350f317ed",
        "snapshot": false,
        "version": "8.10.1"
    },
    "event": {
        "agent_id_status": "verified",
        "category": [
            "web"
        ],
        "dataset": "apache_tomcat.catalina",
        "ingested": "2023-09-27T19:10:10Z",
        "kind": "event",
        "module": "apache_tomcat",
        "original": "27-Sep-2023 19:09:05.176 INFO [main] org.apache.catalina.startup.VersionLoggerListener.log Server version name:   Apache Tomcat/10.1.5",
        "timezone": "UTC",
        "type": [
            "info"
        ]
    },
    "input": {
        "type": "filestream"
    },
    "log": {
        "file": {
            "device_id": 141,
            "inode": 18617251,
            "path": "/tmp/service_logs/catalina.2023-09-27.log"
        },
        "level": "info",
        "offset": 0
    },
    "message": "org.apache.catalina.startup.VersionLoggerListener.log Server version name:   Apache Tomcat/10.1.5",
    "tags": [
        "preserve_original_event",
        "forwarded",
        "apache_tomcat-catalina"
    ]
}
ECS Field Reference
Please refer to the following document for detailed information on ECS fields.
Exported fields
| Field | Description | Type |
|---|---|---|
| @timestamp | Event timestamp. | date |
| apache_tomcat.catalina.subsystem | Indicates Apache Tomcat’s subsystem or the type of the module that was the source of the message. For example, RBPM or Java Messaging Service (JMS). | keyword |
| data_stream.dataset | Data stream dataset. | constant_keyword |
| data_stream.namespace | Data stream namespace. | constant_keyword |
| data_stream.type | Data stream type. | constant_keyword |
| input.type | Type of Filebeat input. | keyword |
| log.file.device_id | ID of the device containing the filesystem where the file resides. | keyword |
| log.file.fingerprint | The sha256 fingerprint identity of the file when fingerprinting is enabled. | keyword |
| log.file.idxhi | The high-order part of a unique identifier that is associated with a file. (Windows-only) | keyword |
| log.file.idxlo | The low-order part of a unique identifier that is associated with a file. (Windows-only) | keyword |
| log.file.inode | Inode number of the log file. | keyword |
| log.file.vol | The serial number of the volume that contains a file. (Windows-only) | keyword |
| log.flags | Flags for the log file. | keyword |
| log.offset | Log offset. | long |
This is the Localhost data stream. This data stream collects logs related to Web application activity which is related to HTTP transactions between the application server and the client.
Example
{
    "@timestamp": "2023-02-23T15:40:03.711Z",
    "agent": {
        "ephemeral_id": "c79cc845-ebf4-492e-b8ea-683d50dbfa39",
        "id": "f152377f-a02e-4498-8440-ea11f965f420",
        "name": "elastic-agent-93073",
        "type": "filebeat",
        "version": "9.0.0"
    },
    "apache_tomcat": {
        "localhost": {
            "subsystem": "localhost-startStop-1"
        }
    },
    "data_stream": {
        "dataset": "apache_tomcat.localhost",
        "namespace": "96644",
        "type": "logs"
    },
    "ecs": {
        "version": "8.11.0"
    },
    "elastic_agent": {
        "id": "f152377f-a02e-4498-8440-ea11f965f420",
        "snapshot": true,
        "version": "9.0.0"
    },
    "event": {
        "agent_id_status": "verified",
        "category": [
            "web"
        ],
        "dataset": "apache_tomcat.localhost",
        "ingested": "2025-02-11T10:33:16Z",
        "kind": "event",
        "module": "apache_tomcat",
        "original": "23-Feb-2023 15:40:03.711 INFO [localhost-startStop-1] org.apache.catalina.core.ApplicationContext.log ContextListener: contextInitialized()",
        "timezone": "UTC",
        "type": [
            "info"
        ]
    },
    "input": {
        "type": "filestream"
    },
    "log": {
        "file": {
            "device_id": "64768",
            "fingerprint": "021bea49df1c6f91ac6ee6776f649cc7a86a73936e64bd44720ab1858f33c0c0",
            "inode": "236841090",
            "path": "/tmp/service_logs/localhost.log"
        },
        "level": "info",
        "offset": 0
    },
    "message": "org.apache.catalina.core.ApplicationContext.log ContextListener: contextInitialized()",
    "tags": [
        "preserve_original_event",
        "forwarded",
        "apache_tomcat-localhost"
    ]
}
ECS Field Reference
Please refer to the following document for detailed information on ECS fields.
Exported fields
| Field | Description | Type |
|---|---|---|
| @timestamp | Event timestamp. | date |
| apache_tomcat.localhost.subsystem | Indicates Apache Tomcat’s subsystem or the type of the module that was the source of the message. For example, RBPM or Java Messaging Service (JMS). | keyword |
| data_stream.dataset | Data stream dataset. | constant_keyword |
| data_stream.namespace | Data stream namespace. | constant_keyword |
| data_stream.type | Data stream type. | constant_keyword |
| input.type | Type of Filebeat input. | keyword |
| log.file.device_id | ID of the device containing the filesystem where the file resides. | keyword |
| log.file.fingerprint | The sha256 fingerprint identity of the file when fingerprinting is enabled. | keyword |
| log.file.idxhi | The high-order part of a unique identifier that is associated with a file. (Windows-only) | keyword |
| log.file.idxlo | The low-order part of a unique identifier that is associated with a file. (Windows-only) | keyword |
| log.file.inode | Inode number of the log file. | keyword |
| log.file.vol | The serial number of the volume that contains a file. (Windows-only) | keyword |
| log.offset | Log offset. | long |
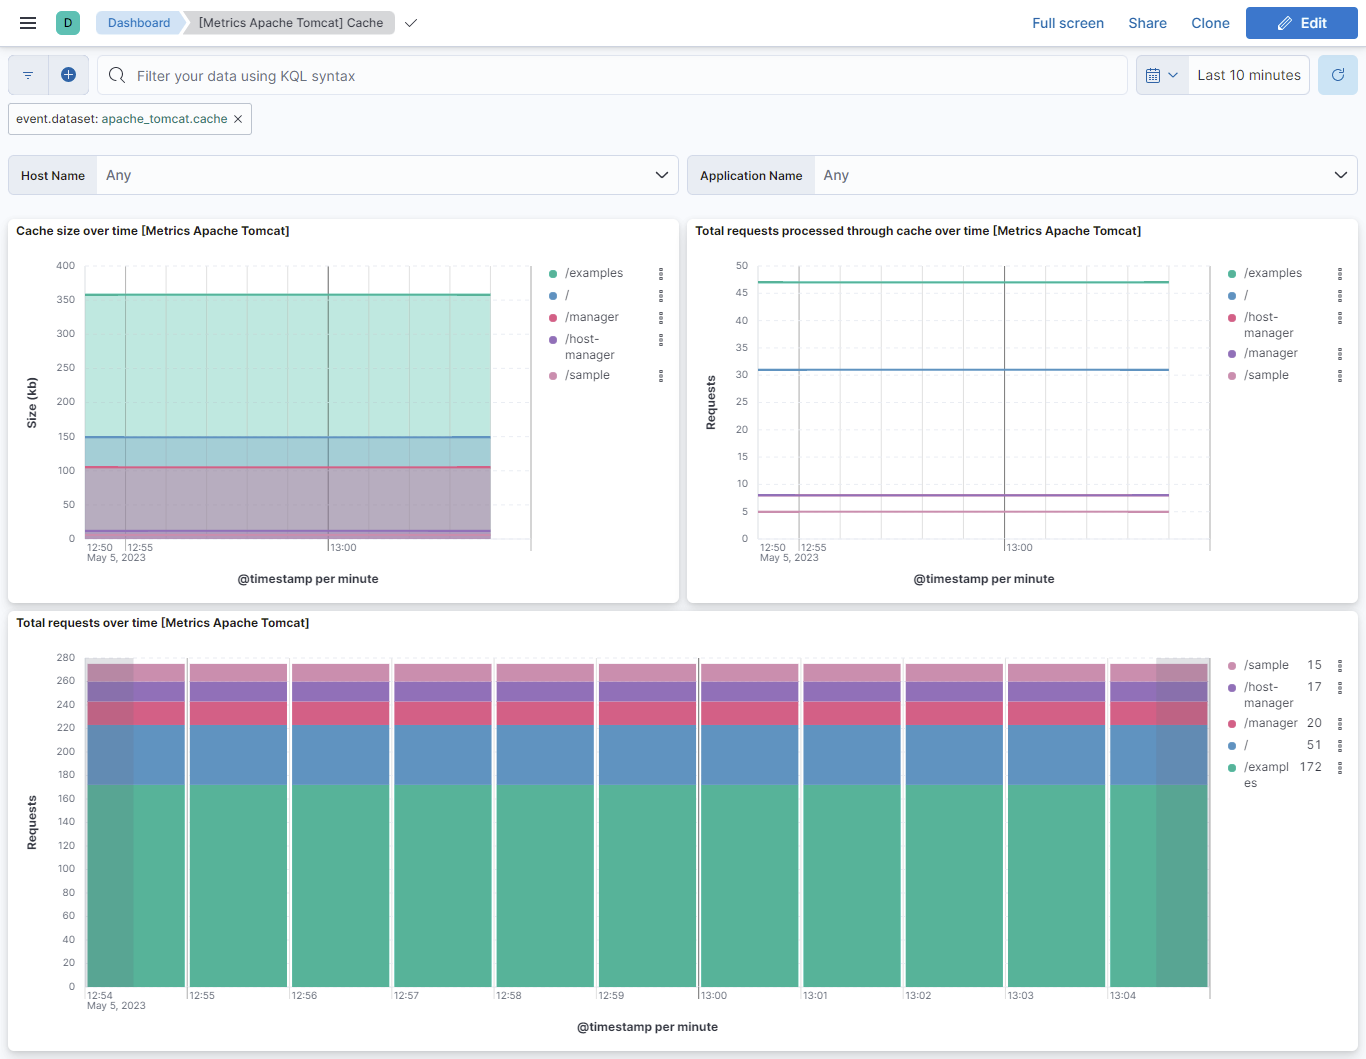
This is the Cache data stream. This data stream collects metrics related to the size of the cache and time-to-live for cache entries.
Example
{
    "@timestamp": "2023-07-06T06:19:25.324Z",
    "agent": {
        "ephemeral_id": "dd4ae675-0ef8-49ba-9568-d7f989add4dd",
        "id": "c78eadae-edd0-4b88-ab24-f2fb84a98229",
        "name": "docker-fleet-agent",
        "type": "metricbeat",
        "version": "8.8.0"
    },
    "apache_tomcat": {
        "cache": {
            "application_name": "/",
            "hit": {
                "count": 22
            },
            "lookup": {
                "count": 37
            },
            "object": {
                "size": {
                    "max": {
                        "kb": 512
                    }
                }
            },
            "size": {
                "current": {
                    "kb": 19
                },
                "max": {
                    "kb": 10240
                }
            },
            "ttl": {
                "ms": 5000
            }
        }
    },
    "data_stream": {
        "dataset": "apache_tomcat.cache",
        "namespace": "ep",
        "type": "metrics"
    },
    "ecs": {
        "version": "8.11.0"
    },
    "elastic_agent": {
        "id": "c78eadae-edd0-4b88-ab24-f2fb84a98229",
        "snapshot": false,
        "version": "8.8.0"
    },
    "event": {
        "agent_id_status": "verified",
        "category": [
            "web"
        ],
        "dataset": "apache_tomcat.cache",
        "duration": 253547035,
        "ingested": "2023-07-06T06:19:29Z",
        "kind": "metric",
        "module": "apache_tomcat",
        "type": [
            "info"
        ]
    },
    "host": {
        "architecture": "aarch64",
        "containerized": false,
        "hostname": "docker-fleet-agent",
        "id": "e8978f2086c14e13b7a0af9ed0011d19",
        "ip": [
            "172.27.0.7"
        ],
        "mac": [
            "02-42-AC-1B-00-07"
        ],
        "name": "docker-fleet-agent",
        "os": {
            "codename": "focal",
            "family": "debian",
            "kernel": "3.10.0-1160.90.1.el7.x86_64",
            "name": "Ubuntu",
            "platform": "ubuntu",
            "type": "linux",
            "version": "20.04.6 LTS (Focal Fossa)"
        }
    },
    "metricset": {
        "name": "collector",
        "period": 10000
    },
    "service": {
        "address": "http://elastic-package-service-apache_tomcat-1:9090/metrics",
        "type": "prometheus"
    },
    "tags": [
        "apache_tomcat-cache"
    ]
}
ECS Field Reference
Please refer to the following document for detailed information on ECS fields.
Exported fields
| Field | Description | Type | Unit | Metric Type |
|---|---|---|---|---|
| @timestamp | Event timestamp. | date | ||
| agent.id | Unique identifier of this agent (if one exists). Example: For Beats this would be beat.id. | keyword | ||
| apache_tomcat.cache.application_name | Name of the Apache Tomcat application. | keyword | ||
| apache_tomcat.cache.hit.count | The number of requests for resources that were served from the cache. | double | gauge | |
| apache_tomcat.cache.lookup.count | The number of requests for resources. | double | gauge | |
| apache_tomcat.cache.object.size.max.kb | The maximum permitted size for a single object in the cache in kB. | double | gauge | |
| apache_tomcat.cache.size.current.kb | The current estimate of the cache size in kB. | double | gauge | |
| apache_tomcat.cache.size.max.kb | The maximum permitted size of the cache in kB. | double | gauge | |
| apache_tomcat.cache.ttl.ms | The time-to-live for cache entries in milliseconds. | double | ms | gauge |
| cloud.account.id | The cloud account or organization id used to identify different entities in a multi-tenant environment. Examples: AWS account id, Google Cloud ORG Id, or other unique identifier. | keyword | ||
| cloud.availability_zone | Availability zone in which this host, resource, or service is located. | keyword | ||
| cloud.instance.id | Instance ID of the host machine. | keyword | ||
| cloud.provider | Name of the cloud provider. Example values are aws, azure, gcp, or digitalocean. | keyword | ||
| cloud.region | Region in which this host, resource, or service is located. | keyword | ||
| container.id | Unique container id. | keyword | ||
| data_stream.dataset | Data stream dataset. | constant_keyword | ||
| data_stream.namespace | Data stream namespace. | constant_keyword | ||
| data_stream.type | Data stream type. | constant_keyword | ||
| host.name | Name of the host. It can contain what hostname returns on Unix systems, the fully qualified domain name (FQDN), or a name specified by the user. The recommended value is the lowercase FQDN of the host. | keyword | ||
| service.address | Address where data about this service was collected from. This should be a URI, network address (ipv4:port or [ipv6]:port) or a resource path (sockets). | keyword |
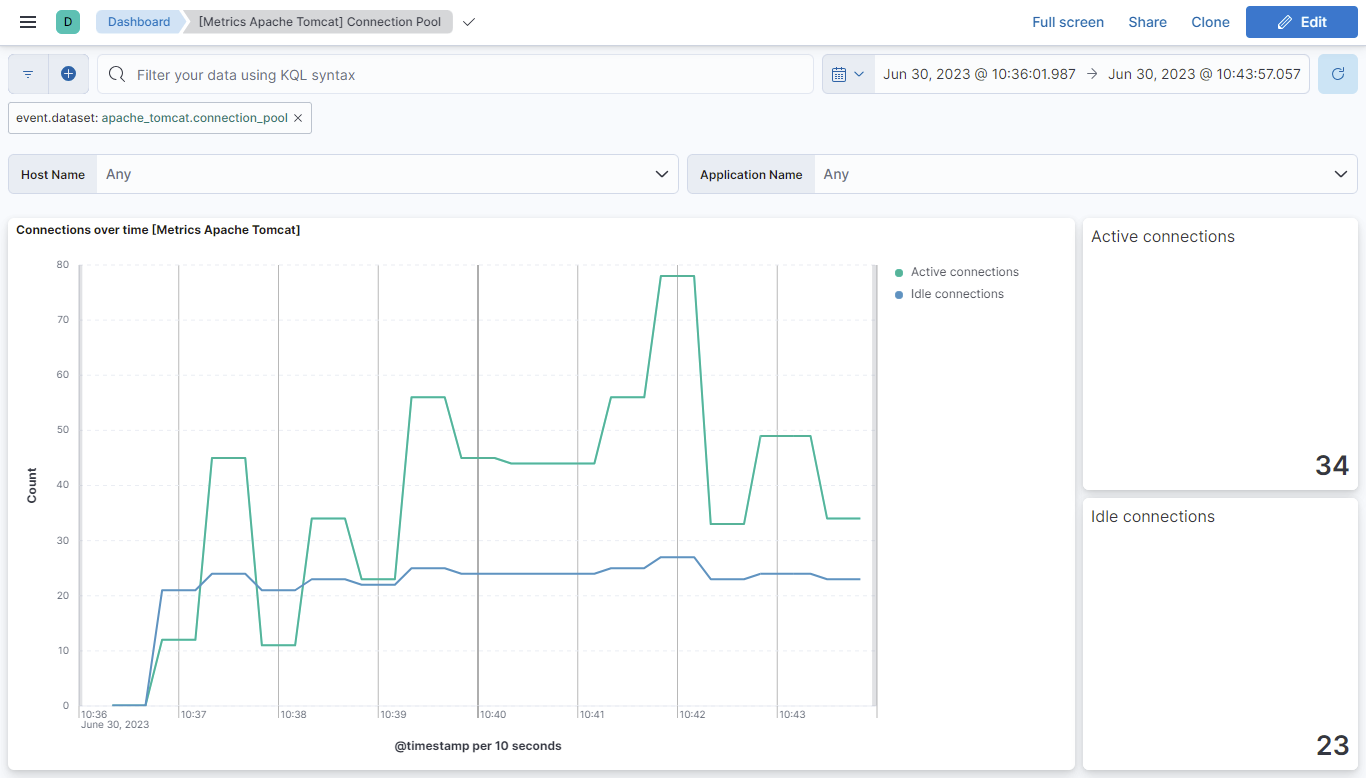
This is the connection pool data stream. This data stream collects metrics related to connection pool such as number of active and idle connections.
Example
{
    "@timestamp": "2023-09-27T19:11:29.922Z",
    "agent": {
        "ephemeral_id": "8dcc13af-7670-441d-b51b-826f604c433b",
        "id": "86a82f91-ff66-4d28-ab7c-eb9350f317ed",
        "name": "docker-fleet-agent",
        "type": "metricbeat",
        "version": "8.10.1"
    },
    "apache_tomcat": {
        "connection_pool": {
            "access_to_underlying_connection_allowed": false,
            "application_name": "/",
            "cache": {
                "state": 1
            },
            "connection": {
                "abandoned_usage_tracking": false,
                "active": {
                    "count": 0
                },
                "autocommit_on_return": true,
                "clear_statement_pool_on_return": false,
                "closed": false,
                "database": {
                    "time": {
                        "max": {
                            "ms": -1
                        }
                    }
                },
                "default_transaction_isolation": -1,
                "enable_autocommit_on_return": true,
                "fast_fail_validation": false,
                "idle": {
                    "count": 0,
                    "exists": false,
                    "max": {
                        "count": 20,
                        "size": -1,
                        "time": {
                            "ms": 3
                        }
                    },
                    "min": {
                        "size": 5,
                        "time": {
                            "ms": -1
                        }
                    }
                },
                "initial_size": {
                    "count": 0
                },
                "lifetime": {
                    "max": {
                        "ms": -1
                    }
                },
                "log_expired": true,
                "min_evictable_idle": {
                    "time": 1800000
                },
                "remove_abandoned_on_borrow": false,
                "remove_abandoned_on_maintenance": false,
                "remove_abandoned_timeout": 300,
                "rollback_on_return": true,
                "test_on_return": false,
                "test_while_idle": false,
                "time_betwen_eviction_run": {
                    "time": {
                        "ms": -1
                    }
                },
                "validate": -1
            },
            "lifo": true,
            "max": {
                "total": 8
            },
            "prepared_statements": false,
            "test_on_borrow": true,
            "test_on_create": false
        }
    },
    "data_stream": {
        "dataset": "apache_tomcat.connection_pool",
        "namespace": "ep",
        "type": "metrics"
    },
    "ecs": {
        "version": "8.11.0"
    },
    "elastic_agent": {
        "id": "86a82f91-ff66-4d28-ab7c-eb9350f317ed",
        "snapshot": false,
        "version": "8.10.1"
    },
    "event": {
        "agent_id_status": "verified",
        "category": [
            "web"
        ],
        "dataset": "apache_tomcat.connection_pool",
        "duration": 198881542,
        "ingested": "2023-09-27T19:11:32Z",
        "kind": "metric",
        "module": "apache_tomcat",
        "type": [
            "info"
        ]
    },
    "host": {
        "architecture": "aarch64",
        "containerized": false,
        "hostname": "docker-fleet-agent",
        "id": "ddbe644fa129402e9d5cf6452db1422d",
        "ip": [
            "172.31.0.7"
        ],
        "mac": [
            "02-42-AC-1F-00-07"
        ],
        "name": "docker-fleet-agent",
        "os": {
            "codename": "focal",
            "family": "debian",
            "kernel": "5.15.49-linuxkit",
            "name": "Ubuntu",
            "platform": "ubuntu",
            "type": "linux",
            "version": "20.04.6 LTS (Focal Fossa)"
        }
    },
    "metricset": {
        "name": "collector",
        "period": 10000
    },
    "service": {
        "address": "http://elastic-package-service-apache_tomcat-1:9090/metrics",
        "type": "prometheus"
    },
    "tags": [
        "apache_tomcat-connection_pool"
    ]
}
ECS Field Reference
Please refer to the following document for detailed information on ECS fields.
Exported fields
| Field | Description | Type | Unit | Metric Type |
|---|---|---|---|---|
| @timestamp | Event timestamp. | date | ||
| agent.id | Unique identifier of this agent (if one exists). Example: For Beats this would be beat.id. | keyword | ||
| apache_tomcat.connection_pool.access_to_underlying_connection_allowed | Returns the state of connections that will be established when the connection pool is started. | boolean | ||
| apache_tomcat.connection_pool.application_name | Name of the Apache Tomcat application. | keyword | ||
| apache_tomcat.connection_pool.cache.state | Cache state of connection pool. | double | gauge | |
| apache_tomcat.connection_pool.connection.abandoned_usage_tracking | Indicates if full stack traces are required when logAbandoned is true. | boolean | ||
| apache_tomcat.connection_pool.connection.active.count | Number of active connection in pool. | double | gauge | |
| apache_tomcat.connection_pool.connection.autocommit_on_return | Connections being returned to the pool. | boolean | ||
| apache_tomcat.connection_pool.connection.clear_statement_pool_on_return | Keeps track of statements associated with a connection. | boolean | ||
| apache_tomcat.connection_pool.connection.closed | Random Connection Closed Exceptions. | boolean | ||
| apache_tomcat.connection_pool.connection.database.time.max.ms | Maximum time to wait for a database connection to become available in ms. | double | ms | gauge |
| apache_tomcat.connection_pool.connection.default_transaction_isolation | TransactionIsolation state of connections created by this pool | double | gauge | |
| apache_tomcat.connection_pool.connection.enable_autocommit_on_return | Connections being returned to the pool will be checked and configured with Connection. | boolean | ||
| apache_tomcat.connection_pool.connection.fast_fail_validation | Timeout before a connection validation queries fail. | boolean | ||
| apache_tomcat.connection_pool.connection.idle.count | Idle number of connection pool. | double | gauge | |
| apache_tomcat.connection_pool.connection.idle.exists | logAbandoned to figure out the connection is idle. | boolean | ||
| apache_tomcat.connection_pool.connection.idle.max.count | Maximum idle connections. | double | gauge | |
| apache_tomcat.connection_pool.connection.idle.max.size | Returns the maximum number of connections that can remain idle in the pool. | double | gauge | |
| apache_tomcat.connection_pool.connection.idle.max.time.ms | It represents the maximum number of objects that the pool will examine during each run of the idle object evictor thread. | double | ms | gauge |
| apache_tomcat.connection_pool.connection.idle.min.size | The minimum number of established connections that should be kept in the pool at all times. | double | gauge | |
| apache_tomcat.connection_pool.connection.idle.min.time.ms | An attribute of the Tomcat DataSource object that sets the minimum time an object may sit idle in the pool before it is eligable for eviction by the idle object evictor. | double | ms | gauge |
| apache_tomcat.connection_pool.connection.initial_size.count | The initial number of connections that are created when the pool is started. | double | gauge | |
| apache_tomcat.connection_pool.connection.lifetime.max.ms | The maximum lifetime in milliseconds of a connection. | double | ms | gauge |
| apache_tomcat.connection_pool.connection.log_expired | Log expired connection in pool. | boolean | ||
| apache_tomcat.connection_pool.connection.min_evictable_idle.time | The minimum amount of time an object may sit idle in the pool before it is eligible for eviction. | double | gauge | |
| apache_tomcat.connection_pool.connection.remove_abandoned_on_borrow | Remove abandoned connections from the pool when a connection is borrowed. | boolean | ||
| apache_tomcat.connection_pool.connection.remove_abandoned_on_maintenance | The commons dbcp parameters which are unique from the Tomcat JDBC connection pool parameters are not being accepted. | boolean | ||
| apache_tomcat.connection_pool.connection.remove_abandoned_timeout | Timeout in seconds before an abandoned (in use) connection can be removed. | double | gauge | |
| apache_tomcat.connection_pool.connection.rollback_on_return | The pool can terminate the transaction by calling rollback on the connection. | boolean | ||
| apache_tomcat.connection_pool.connection.test_on_return | The indication of whether objects will be validated before being returned to the pool. | boolean | ||
| apache_tomcat.connection_pool.connection.test_while_idle | Introspected attribute testWhileIdle. | boolean | ||
| apache_tomcat.connection_pool.connection.time_betwen_eviction_run.time.ms | The total amount of time in milliseconds to sleep between runs of the idle connection validation/cleaner thread. | double | ms | gauge |
| apache_tomcat.connection_pool.connection.validate | Validate connections from this pool. | double | gauge | |
| apache_tomcat.connection_pool.lifo | Last In First Out connections. | boolean | ||
| apache_tomcat.connection_pool.max.total | Maximum total of connection pool. | double | gauge | |
| apache_tomcat.connection_pool.prepared_statements | Validate connections from this pool. | boolean | ||
| apache_tomcat.connection_pool.test_on_borrow | The indication of whether objects will be validated before being borrowed from the pool. | boolean | ||
| apache_tomcat.connection_pool.test_on_create | Property determines whether or not the pool will validate objects immediately after they are created by the pool. | boolean | ||
| cloud.account.id | The cloud account or organization id used to identify different entities in a multi-tenant environment. Examples: AWS account id, Google Cloud ORG Id, or other unique identifier. | keyword | ||
| cloud.availability_zone | Availability zone in which this host, resource, or service is located. | keyword | ||
| cloud.instance.id | Instance ID of the host machine. | keyword | ||
| cloud.provider | Name of the cloud provider. Example values are aws, azure, gcp, or digitalocean. | keyword | ||
| cloud.region | Region in which this host, resource, or service is located. | keyword | ||
| container.id | Unique container id. | keyword | ||
| data_stream.dataset | Data stream dataset. | constant_keyword | ||
| data_stream.namespace | Data stream namespace. | constant_keyword | ||
| data_stream.type | Data stream type. | constant_keyword | ||
| host.name | Name of the host. It can contain what hostname returns on Unix systems, the fully qualified domain name (FQDN), or a name specified by the user. The recommended value is the lowercase FQDN of the host. | keyword | ||
| service.address | Address where data about this service was collected from. This should be a URI, network address (ipv4:port or [ipv6]:port) or a resource path (sockets). | keyword |
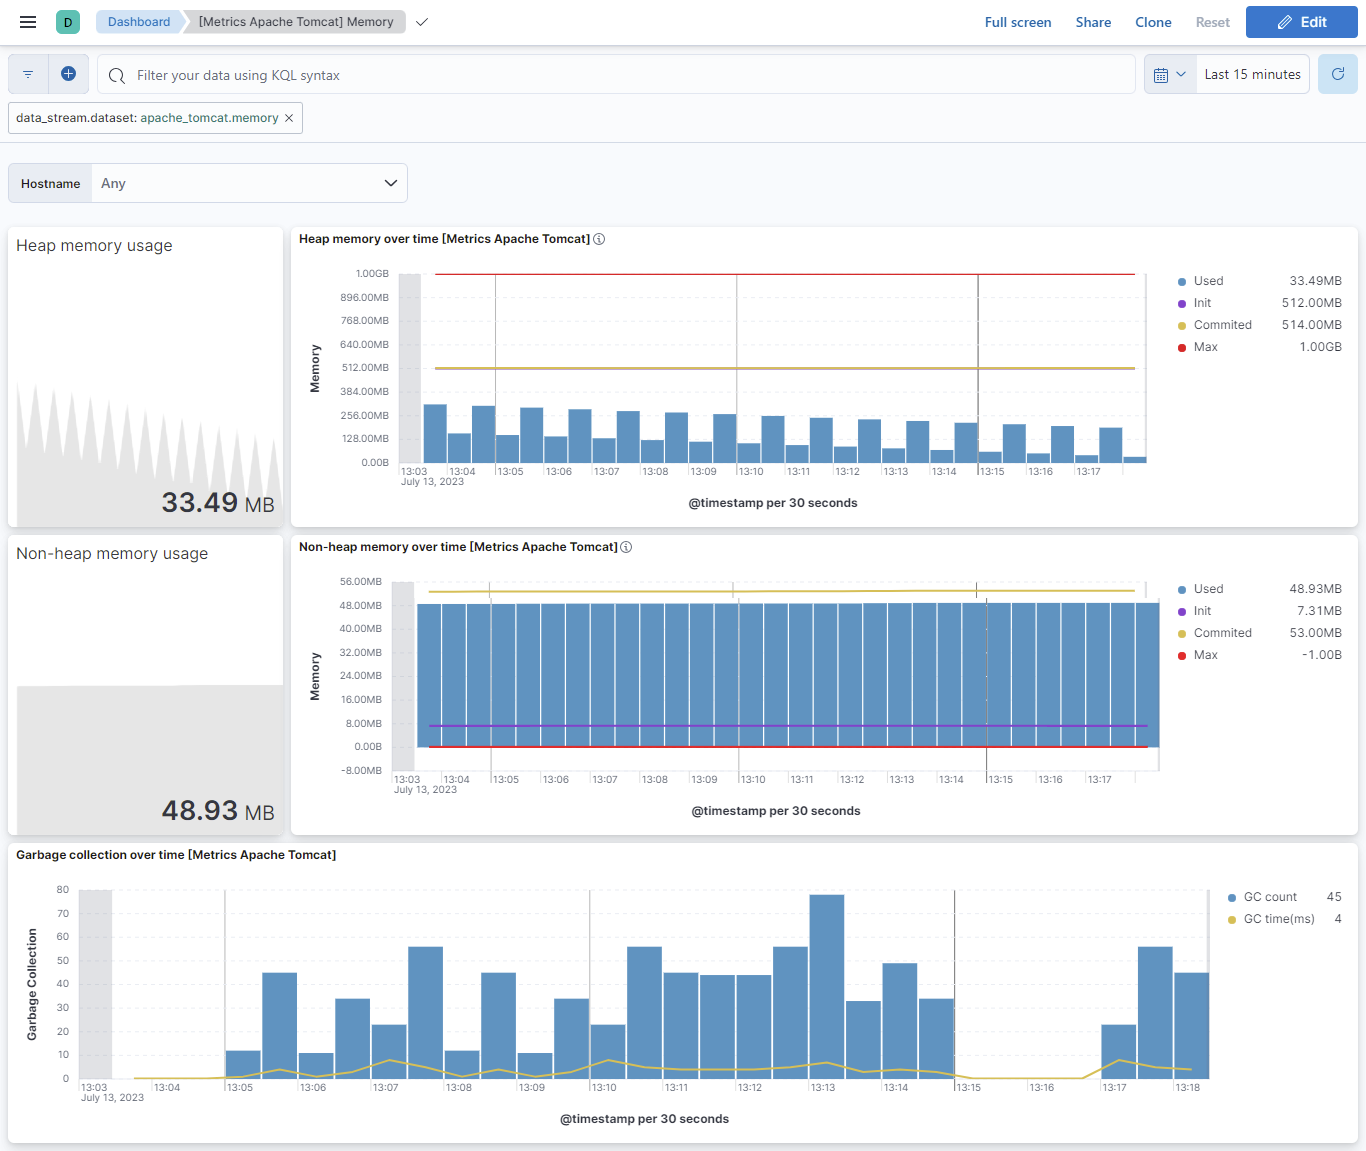
This is the memory data stream. This data stream collects metrics related to the heap memory, non-heap memory, garbage collection time and count.
Example
{
    "@timestamp": "2023-09-27T19:14:11.339Z",
    "agent": {
        "ephemeral_id": "e71c07db-c98b-4ee5-929a-959290720d1b",
        "id": "86a82f91-ff66-4d28-ab7c-eb9350f317ed",
        "name": "docker-fleet-agent",
        "type": "metricbeat",
        "version": "8.10.1"
    },
    "apache_tomcat": {
        "memory": {
            "doc_type": "gc",
            "gc": {
                "collection": {
                    "count": 0,
                    "time": {
                        "ms": 0
                    }
                },
                "valid": 1
            }
        }
    },
    "data_stream": {
        "dataset": "apache_tomcat.memory",
        "namespace": "ep",
        "type": "metrics"
    },
    "ecs": {
        "version": "8.11.0"
    },
    "elastic_agent": {
        "id": "86a82f91-ff66-4d28-ab7c-eb9350f317ed",
        "snapshot": false,
        "version": "8.10.1"
    },
    "event": {
        "agent_id_status": "verified",
        "category": [
            "web"
        ],
        "dataset": "apache_tomcat.memory",
        "duration": 173318458,
        "ingested": "2023-09-27T19:14:14Z",
        "kind": "metric",
        "module": "apache_tomcat",
        "type": [
            "info"
        ]
    },
    "host": {
        "architecture": "aarch64",
        "containerized": false,
        "hostname": "docker-fleet-agent",
        "id": "ddbe644fa129402e9d5cf6452db1422d",
        "ip": [
            "172.31.0.7"
        ],
        "mac": [
            "02-42-AC-1F-00-07"
        ],
        "name": "docker-fleet-agent",
        "os": {
            "codename": "focal",
            "family": "debian",
            "kernel": "5.15.49-linuxkit",
            "name": "Ubuntu",
            "platform": "ubuntu",
            "type": "linux",
            "version": "20.04.6 LTS (Focal Fossa)"
        }
    },
    "metricset": {
        "name": "collector",
        "period": 10000
    },
    "service": {
        "address": "http://elastic-package-service-apache_tomcat-1:9090/metrics",
        "type": "prometheus"
    },
    "tags": [
        "apache_tomcat-memory"
    ]
}
ECS Field Reference
Please refer to the following document for detailed information on ECS fields.
Exported fields
| Field | Description | Type | Unit | Metric Type |
|---|---|---|---|---|
| @timestamp | Event timestamp. | date | ||
| agent.id | Unique identifier of this agent (if one exists). Example: For Beats this would be beat.id. | keyword | ||
| apache_tomcat.memory.doc_type | Document type of the event. This should be either "memory" or "gc". | keyword | ||
| apache_tomcat.memory.gc.collection.count | The cumulative number of invoked garbage collections since the start of the server. | long | counter | |
| apache_tomcat.memory.gc.collection.time.ms | The time (in milliseconds) taken by garbage collection during the collection interval. | long | ms | gauge |
| apache_tomcat.memory.gc.valid | The garbage collection process in G1 is considered valid even if the old GC JMX counter remains at 0 while old space is gradually reclaimed by the young collections. | long | gauge | |
| apache_tomcat.memory.heap.committed.bytes | Committed heap memory usage. | double | byte | gauge |
| apache_tomcat.memory.heap.init.bytes | Initial heap memory usage. | double | byte | gauge |
| apache_tomcat.memory.heap.max.bytes | Max heap memory usage. When the value for the maximum memory size (in bytes) is set to -1 for heap memory configurations, it indicates that the user has not specified a predefined size for the memory allocation. | double | byte | gauge |
| apache_tomcat.memory.heap.used.bytes | Used heap memory usage. | double | byte | gauge |
| apache_tomcat.memory.non_heap.committed.bytes | Committed non-heap memory usage. | double | byte | gauge |
| apache_tomcat.memory.non_heap.init.bytes | Initial non-heap memory usage. | double | byte | gauge |
| apache_tomcat.memory.non_heap.max.bytes | Max non-heap memory usage. When the value for the maximum memory size (in bytes) is set to -1 for non-heap memory configurations, it indicates that the user has not specified a predefined size for the memory allocation. | double | byte | gauge |
| apache_tomcat.memory.non_heap.used.bytes | Used non-heap memory usage. | double | byte | gauge |
| apache_tomcat.memory.object_pending_finalization.count | Count of object pending finalization. | double | gauge | |
| apache_tomcat.memory.verbose | When set to true, will cause the memory manager to print messages to the console whenever it performs certain memory-related operations.(1.0-true, 0.0-false). | boolean | ||
| cloud.account.id | The cloud account or organization id used to identify different entities in a multi-tenant environment. Examples: AWS account id, Google Cloud ORG Id, or other unique identifier. | keyword | ||
| cloud.availability_zone | Availability zone in which this host, resource, or service is located. | keyword | ||
| cloud.instance.id | Instance ID of the host machine. | keyword | ||
| cloud.provider | Name of the cloud provider. Example values are aws, azure, gcp, or digitalocean. | keyword | ||
| cloud.region | Region in which this host, resource, or service is located. | keyword | ||
| container.id | Unique container id. | keyword | ||
| data_stream.dataset | Data stream dataset. | constant_keyword | ||
| data_stream.namespace | Data stream namespace. | constant_keyword | ||
| data_stream.type | Data stream type. | constant_keyword | ||
| host.name | Name of the host. It can contain what hostname returns on Unix systems, the fully qualified domain name (FQDN), or a name specified by the user. The recommended value is the lowercase FQDN of the host. | keyword | ||
| service.address | Address where data about this service was collected from. This should be a URI, network address (ipv4:port or [ipv6]:port) or a resource path (sockets). | keyword |
This is the Request data stream. This data stream collects metrics related to request count, and amount of data received and sent.
Example
{
    "@timestamp": "2023-07-06T06:18:00.930Z",
    "agent": {
        "ephemeral_id": "e291bf4e-e4fc-42c4-bb98-8acddc2e7af1",
        "id": "c78eadae-edd0-4b88-ab24-f2fb84a98229",
        "name": "docker-fleet-agent",
        "type": "metricbeat",
        "version": "8.8.0"
    },
    "apache_tomcat": {
        "request": {
            "count": 2,
            "error": {
                "count": 0
            },
            "nio_connector": "http-nio-8080",
            "received": {
                "bytes": 0
            },
            "sent": {
                "bytes": 22430
            },
            "time": {
                "max": 942,
                "total": 942
            }
        }
    },
    "data_stream": {
        "dataset": "apache_tomcat.request",
        "namespace": "ep",
        "type": "metrics"
    },
    "ecs": {
        "version": "8.11.0"
    },
    "elastic_agent": {
        "id": "c78eadae-edd0-4b88-ab24-f2fb84a98229",
        "snapshot": false,
        "version": "8.8.0"
    },
    "event": {
        "agent_id_status": "verified",
        "category": [
            "web"
        ],
        "dataset": "apache_tomcat.request",
        "duration": 266759936,
        "ingested": "2023-07-06T06:18:04Z",
        "kind": "metric",
        "module": "apache_tomcat",
        "type": [
            "info"
        ]
    },
    "host": {
        "architecture": "aarch64",
        "containerized": false,
        "hostname": "docker-fleet-agent",
        "id": "e8978f2086c14e13b7a0af9ed0011d19",
        "ip": [
            "172.27.0.7"
        ],
        "mac": [
            "02-42-AC-1B-00-07"
        ],
        "name": "docker-fleet-agent",
        "os": {
            "codename": "focal",
            "family": "debian",
            "kernel": "3.10.0-1160.90.1.el7.x86_64",
            "name": "Ubuntu",
            "platform": "ubuntu",
            "type": "linux",
            "version": "20.04.6 LTS (Focal Fossa)"
        }
    },
    "metricset": {
        "name": "collector",
        "period": 10000
    },
    "service": {
        "address": "http://elastic-package-service-apache_tomcat-1:9090/metrics",
        "type": "prometheus"
    },
    "tags": [
        "apache_tomcat-request"
    ]
}
ECS Field Reference
Please refer to the following document for detailed information on ECS fields.
Exported fields
| Field | Description | Type | Unit | Metric Type |
|---|---|---|---|---|
| @timestamp | Event timestamp. | date | ||
| agent.id | Unique identifier of this agent (if one exists). Example: For Beats this would be beat.id. | keyword | ||
| apache_tomcat.request.count | Number of requests processed. | double | counter | |
| apache_tomcat.request.error.count | Number of errors. | double | gauge | |
| apache_tomcat.request.nio_connector | Name of NIO Connector. | keyword | ||
| apache_tomcat.request.received.bytes | Amount of data received, in bytes. | double | byte | counter |
| apache_tomcat.request.sent.bytes | Amount of data sent, in bytes. | double | byte | counter |
| apache_tomcat.request.time.max | Maximum time(ms) to process a request. | double | ms | counter |
| apache_tomcat.request.time.total | Total time(ms) to process the requests. | double | ms | counter |
| cloud.account.id | The cloud account or organization id used to identify different entities in a multi-tenant environment. Examples: AWS account id, Google Cloud ORG Id, or other unique identifier. | keyword | ||
| cloud.availability_zone | Availability zone in which this host, resource, or service is located. | keyword | ||
| cloud.instance.id | Instance ID of the host machine. | keyword | ||
| cloud.provider | Name of the cloud provider. Example values are aws, azure, gcp, or digitalocean. | keyword | ||
| cloud.region | Region in which this host, resource, or service is located. | keyword | ||
| container.id | Unique container id. | keyword | ||
| data_stream.dataset | Data stream dataset. | constant_keyword | ||
| data_stream.namespace | Data stream namespace. | constant_keyword | ||
| data_stream.type | Data stream type. | constant_keyword | ||
| host.name | Name of the host. It can contain what hostname returns on Unix systems, the fully qualified domain name (FQDN), or a name specified by the user. The recommended value is the lowercase FQDN of the host. | keyword | ||
| service.address | Address where data about this service was collected from. This should be a URI, network address (ipv4:port or [ipv6]:port) or a resource path (sockets). | keyword |
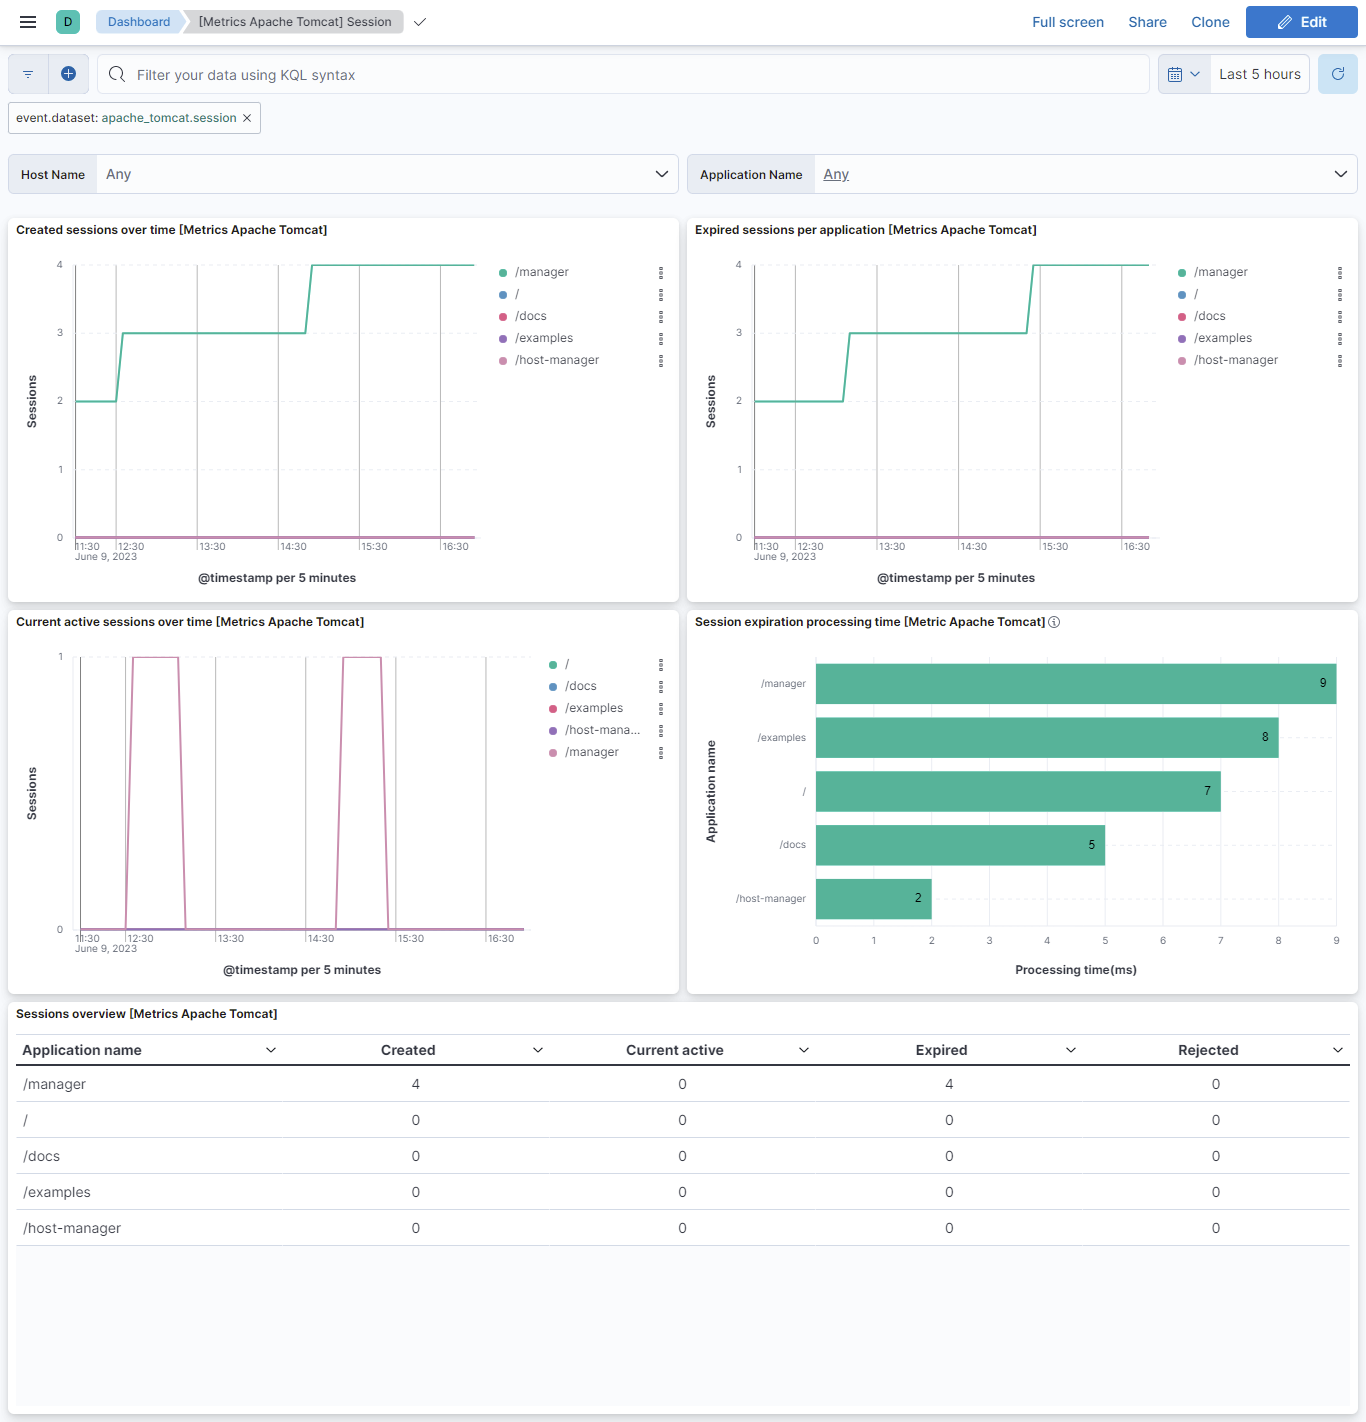
This is the session data stream. This data stream collects metrics related to created, active, expired and rejected sessions, alive and processing time for sessions.
Example
{
    "@timestamp": "2023-09-27T19:16:54.670Z",
    "agent": {
        "ephemeral_id": "e227fa37-0bd2-4d8f-9397-d2ebf1247710",
        "id": "86a82f91-ff66-4d28-ab7c-eb9350f317ed",
        "name": "docker-fleet-agent",
        "type": "metricbeat",
        "version": "8.10.1"
    },
    "apache_tomcat": {
        "session": {
            "active": {
                "allowed": {
                    "max": -1
                },
                "max": 0,
                "total": 0
            },
            "alive_time": {
                "avg": 0,
                "max": 0
            },
            "application_name": "/",
            "create": {
                "rate": 0,
                "total": 0
            },
            "duplicate_ids": {
                "count": 0
            },
            "expire": {
                "rate": 0,
                "total": 0
            },
            "persist_authentication": false,
            "process_expires_frequency": {
                "count": 6
            },
            "processing_time": 0,
            "rejected": {
                "count": 0
            }
        }
    },
    "data_stream": {
        "dataset": "apache_tomcat.session",
        "namespace": "ep",
        "type": "metrics"
    },
    "ecs": {
        "version": "8.11.0"
    },
    "elastic_agent": {
        "id": "86a82f91-ff66-4d28-ab7c-eb9350f317ed",
        "snapshot": false,
        "version": "8.10.1"
    },
    "event": {
        "agent_id_status": "verified",
        "category": [
            "web"
        ],
        "dataset": "apache_tomcat.session",
        "duration": 146910709,
        "ingested": "2023-09-27T19:16:57Z",
        "kind": "metric",
        "module": "apache_tomcat",
        "type": [
            "info"
        ]
    },
    "host": {
        "architecture": "aarch64",
        "containerized": false,
        "hostname": "docker-fleet-agent",
        "id": "ddbe644fa129402e9d5cf6452db1422d",
        "ip": [
            "172.31.0.7"
        ],
        "mac": [
            "02-42-AC-1F-00-07"
        ],
        "name": "docker-fleet-agent",
        "os": {
            "codename": "focal",
            "family": "debian",
            "kernel": "5.15.49-linuxkit",
            "name": "Ubuntu",
            "platform": "ubuntu",
            "type": "linux",
            "version": "20.04.6 LTS (Focal Fossa)"
        }
    },
    "metricset": {
        "name": "collector",
        "period": 10000
    },
    "service": {
        "address": "http://elastic-package-service-apache_tomcat-1:9090/metrics",
        "type": "prometheus"
    },
    "tags": [
        "apache_tomcat-session"
    ]
}
ECS Field Reference
Please refer to the following document for detailed information on ECS fields.
Exported fields
| Field | Description | Type | Unit | Metric Type |
|---|---|---|---|---|
| @timestamp | Event timestamp. | date | ||
| agent.id | Unique identifier of this agent (if one exists). Example: For Beats this would be beat.id. | keyword | ||
| apache_tomcat.session.active.allowed.max | The maximum number of active sessions allowed, or -1 for no limit. | double | gauge | |
| apache_tomcat.session.active.max | Maximum number of active sessions so far. | double | counter | |
| apache_tomcat.session.active.total | Number of active sessions at this moment. | double | gauge | |
| apache_tomcat.session.alive_time.avg | Average time an expired session had been alive. | double | gauge | |
| apache_tomcat.session.alive_time.max | Longest time an expired session had been alive. | double | counter | |
| apache_tomcat.session.application_name | Name of the Apache Tomcat application. | keyword | ||
| apache_tomcat.session.create.rate | Session creation rate in sessions per minute. | double | gauge | |
| apache_tomcat.session.create.total | Total number of sessions created by the manager. | double | counter | |
| apache_tomcat.session.duplicate_ids.count | Number of duplicated session ids generated. | double | gauge | |
| apache_tomcat.session.expire.rate | Session expiration rate in sessions per minute. | double | gauge | |
| apache_tomcat.session.expire.total | Number of sessions that expired (doesn't include explicit invalidations). | double | gauge | |
| apache_tomcat.session.persist_authentication | Indicates whether sessions shall persist authentication information when being persisted (e.g. across application restarts). | boolean | ||
| apache_tomcat.session.process_expires_frequency.count | The frequency of the manager checks (expiration and passivation). | double | gauge | |
| apache_tomcat.session.processing_time | Time spent doing housekeeping and expiration. | double | ms | gauge |
| apache_tomcat.session.rejected.count | Number of sessions we rejected due to maxActive being reached. | double | gauge | |
| cloud.account.id | The cloud account or organization id used to identify different entities in a multi-tenant environment. Examples: AWS account id, Google Cloud ORG Id, or other unique identifier. | keyword | ||
| cloud.availability_zone | Availability zone in which this host, resource, or service is located. | keyword | ||
| cloud.instance.id | Instance ID of the host machine. | keyword | ||
| cloud.provider | Name of the cloud provider. Example values are aws, azure, gcp, or digitalocean. | keyword | ||
| cloud.region | Region in which this host, resource, or service is located. | keyword | ||
| container.id | Unique container id. | keyword | ||
| data_stream.dataset | Data stream dataset. | constant_keyword | ||
| data_stream.namespace | Data stream namespace. | constant_keyword | ||
| data_stream.type | Data stream type. | constant_keyword | ||
| host.name | Name of the host. It can contain what hostname returns on Unix systems, the fully qualified domain name (FQDN), or a name specified by the user. The recommended value is the lowercase FQDN of the host. | keyword | ||
| service.address | Address where data about this service was collected from. This should be a URI, network address (ipv4:port or [ipv6]:port) or a resource path (sockets). | keyword |
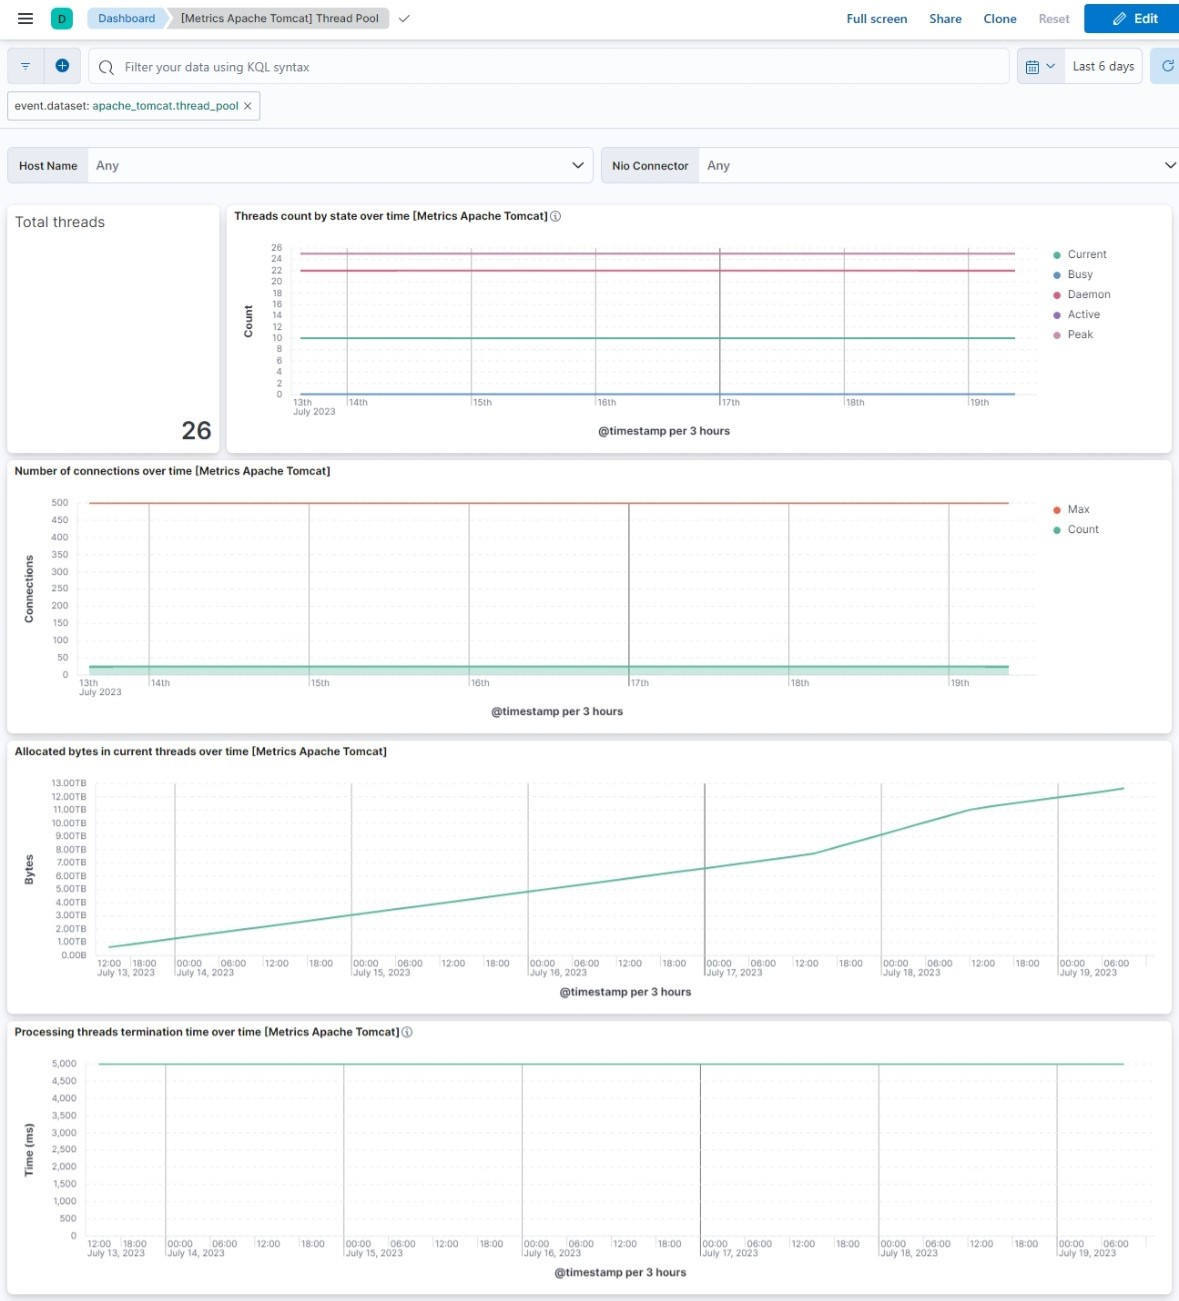
This is the thread pool data stream. This data stream collects metrics related to the total, active, current, daemon, busy and peak threads, CPU time and processing termination time of the threads.
Example
{
    "@timestamp": "2023-09-27T19:18:14.080Z",
    "agent": {
        "ephemeral_id": "9e30f9c3-c9e5-4366-b899-29ee8f99bd67",
        "id": "86a82f91-ff66-4d28-ab7c-eb9350f317ed",
        "name": "docker-fleet-agent",
        "type": "metricbeat",
        "version": "8.10.1"
    },
    "apache_tomcat": {
        "thread_pool": {
            "contention": {
                "monitoring_enabled": false
            },
            "thread": {
                "active": {
                    "count": 26
                },
                "allocated_memory": {
                    "enabled": true,
                    "supported": true
                },
                "current": {
                    "allocated": {
                        "bytes": 3155872
                    },
                    "cpu": {
                        "time": {
                            "enabled": true,
                            "ms": 34786168
                        }
                    },
                    "user": {
                        "time": {
                            "ms": 30000000
                        }
                    }
                },
                "daemon": {
                    "count": 23
                },
                "peak": {
                    "count": 26
                },
                "supported": {
                    "contention_monitoring": true,
                    "cpu": {
                        "current": {
                            "time": true
                        }
                    },
                    "usage": {
                        "object_monitor": true,
                        "synchronizer": true
                    }
                },
                "total": 27
            }
        }
    },
    "data_stream": {
        "dataset": "apache_tomcat.thread_pool",
        "namespace": "ep",
        "type": "metrics"
    },
    "ecs": {
        "version": "8.11.0"
    },
    "elastic_agent": {
        "id": "86a82f91-ff66-4d28-ab7c-eb9350f317ed",
        "snapshot": false,
        "version": "8.10.1"
    },
    "event": {
        "agent_id_status": "verified",
        "category": [
            "web"
        ],
        "dataset": "apache_tomcat.thread_pool",
        "duration": 167367708,
        "ingested": "2023-09-27T19:18:17Z",
        "kind": "metric",
        "module": "apache_tomcat",
        "type": [
            "info"
        ]
    },
    "host": {
        "architecture": "aarch64",
        "containerized": false,
        "hostname": "docker-fleet-agent",
        "id": "ddbe644fa129402e9d5cf6452db1422d",
        "ip": [
            "172.31.0.7"
        ],
        "mac": [
            "02-42-AC-1F-00-07"
        ],
        "name": "docker-fleet-agent",
        "os": {
            "codename": "focal",
            "family": "debian",
            "kernel": "5.15.49-linuxkit",
            "name": "Ubuntu",
            "platform": "ubuntu",
            "type": "linux",
            "version": "20.04.6 LTS (Focal Fossa)"
        }
    },
    "metricset": {
        "name": "collector",
        "period": 10000
    },
    "service": {
        "address": "http://elastic-package-service-apache_tomcat-1:9090/metrics",
        "type": "prometheus"
    },
    "tags": [
        "apache_tomcat-thread_pool"
    ]
}
ECS Field Reference
Please refer to the following document for detailed information on ECS fields.
Exported fields
| Field | Description | Type | Unit | Metric Type |
|---|---|---|---|---|
| @timestamp | Event timestamp. | date | ||
| agent.id | Unique identifier of this agent (if one exists). Example: For Beats this would be beat.id. | keyword | ||
| apache_tomcat.thread_pool.connection.count | Count of all connections. | double | counter | |
| apache_tomcat.thread_pool.connection.linger | The number of seconds during which the sockets used by this connector will linger when they are closed. | double | s | gauge |
| apache_tomcat.thread_pool.connection.max | The total number of concurrent connections that the server will accept and process. | double | gauge | |
| apache_tomcat.thread_pool.connection.timeout | Thread connection timeout. | double | counter | |
| apache_tomcat.thread_pool.contention.monitoring_enabled | This is used to determine if a Java virtual machine enables thread contention monitoring. | boolean | ||
| apache_tomcat.thread_pool.executor_termination.timeout.ms | The time that the private internal executor will wait for request processing threads to terminate before continuing with the process of stopping the connector. If not set, the default is 5000 (5 seconds). | double | ms | gauge |
| apache_tomcat.thread_pool.initiated_connector.state | State of bound when the connector is initiated. | boolean | ||
| apache_tomcat.thread_pool.keep_alive.count | Total keep alive on the ThreadPool. | double | gauge | |
| apache_tomcat.thread_pool.keep_alive.max_requests | Maximum number of request keep alive in ThreadPool. | double | gauge | |
| apache_tomcat.thread_pool.keep_alive.timeout | Keep alive timeout on the ThreadPool. | double | gauge | |
| apache_tomcat.thread_pool.nio_connector | Name of NIO Connector. | keyword | ||
| apache_tomcat.thread_pool.ssl_enabled | SSL enable status. | boolean | ||
| apache_tomcat.thread_pool.tcp_no_delay | Status of tcp no delay option used to improves performance under most circumstances. | boolean | ||
| apache_tomcat.thread_pool.thread.accept.count | Count of all threads accepted. | double | counter | |
| apache_tomcat.thread_pool.thread.active.count | Current active threads at JVM level (from java.lang:type=Threading). | double | gauge | |
| apache_tomcat.thread_pool.thread.allocated_memory.enabled | Allocated memory enabled in thread. | boolean | ||
| apache_tomcat.thread_pool.thread.allocated_memory.supported | Allocated memory supported in thread. | boolean | ||
| apache_tomcat.thread_pool.thread.current.allocated.bytes | Allocated bytes in current thread. | double | byte | counter |
| apache_tomcat.thread_pool.thread.current.busy | Current busy threads from the ThreadPool. | double | gauge | |
| apache_tomcat.thread_pool.thread.current.count | Current number of threads, taken from the ThreadPool. | double | gauge | |
| apache_tomcat.thread_pool.thread.current.cpu.time.enabled | CPU time for the current thread. | boolean | ||
| apache_tomcat.thread_pool.thread.current.cpu.time.ms | CPU time in milliseconds. | double | ms | gauge |
| apache_tomcat.thread_pool.thread.current.user.time.ms | User time in milliseconds. | double | ms | gauge |
| apache_tomcat.thread_pool.thread.daemon.count | Daemon count for the current thread. | double | gauge | |
| apache_tomcat.thread_pool.thread.daemon.status | The status which states whether the thread is daemon or not. | boolean | ||
| apache_tomcat.thread_pool.thread.paused | Pause state of Thread. | boolean | ||
| apache_tomcat.thread_pool.thread.peak.count | Peak number of threads at JVM level (from java.lang:type=Threading). | double | gauge | |
| apache_tomcat.thread_pool.thread.port.default | Default port of thread in Apache Tomcat. | long | gauge | |
| apache_tomcat.thread_pool.thread.port.offset | The offset to apply to port of thread. | long | gauge | |
| apache_tomcat.thread_pool.thread.port.value | Port of thread. | long | gauge | |
| apache_tomcat.thread_pool.thread.port.with_offset | Port of thread with offset. | long | gauge | |
| apache_tomcat.thread_pool.thread.priority.acceptor | The priority of the acceptor thread. | double | gauge | |
| apache_tomcat.thread_pool.thread.priority.count | Priority of thread. | double | gauge | |
| apache_tomcat.thread_pool.thread.priority.poller | The priority of the poller threads. | double | gauge | |
| apache_tomcat.thread_pool.thread.requests.max | Max threads from the ThreadPool, to be created by the connector and made available for requests. | double | counter | |
| apache_tomcat.thread_pool.thread.running.min | The minimum number of threads always kept running. | double | gauge | |
| apache_tomcat.thread_pool.thread.running.value | The status which states whether the thread is running or not. | boolean | ||
| apache_tomcat.thread_pool.thread.selector.timeout | Selector thread's timeout. | double | gauge | |
| apache_tomcat.thread_pool.thread.sni_parse_limit | SNI parsing limit of thread. | double | gauge | |
| apache_tomcat.thread_pool.thread.supported.contention_monitoring | This is used to determine if a Java virtual machine supports thread contention monitoring. | boolean | ||
| apache_tomcat.thread_pool.thread.supported.cpu.current.time | CPU time that the current thread has executed in user mode is supported or not. | boolean | ||
| apache_tomcat.thread_pool.thread.supported.usage.object_monitor | Support of object monitor usage of thread. | boolean | ||
| apache_tomcat.thread_pool.thread.supported.usage.synchronizer | Support of synchronizer usage. | boolean | ||
| apache_tomcat.thread_pool.thread.total | Total threads at the JVM level (from java.lang:type=Threading). | double | gauge | |
| apache_tomcat.thread_pool.use_inherited_channel | Returns the channel inherited from the entity that created this Java virtual machine. | boolean | ||
| apache_tomcat.thread_pool.use_send_file | Use of sendfile will disable any compression that Tomcat may otherwise have performed on the response. | boolean | ||
| cloud.account.id | The cloud account or organization id used to identify different entities in a multi-tenant environment. Examples: AWS account id, Google Cloud ORG Id, or other unique identifier. | keyword | ||
| cloud.availability_zone | Availability zone in which this host, resource, or service is located. | keyword | ||
| cloud.instance.id | Instance ID of the host machine. | keyword | ||
| cloud.provider | Name of the cloud provider. Example values are aws, azure, gcp, or digitalocean. | keyword | ||
| cloud.region | Region in which this host, resource, or service is located. | keyword | ||
| container.id | Unique container id. | keyword | ||
| data_stream.dataset | Data stream dataset. | constant_keyword | ||
| data_stream.namespace | Data stream namespace. | constant_keyword | ||
| data_stream.type | Data stream type. | constant_keyword | ||
| host.name | Name of the host. It can contain what hostname returns on Unix systems, the fully qualified domain name (FQDN), or a name specified by the user. The recommended value is the lowercase FQDN of the host. | keyword | ||
| service.address | Address where data about this service was collected from. This should be a URI, network address (ipv4:port or [ipv6]:port) or a resource path (sockets). | keyword |
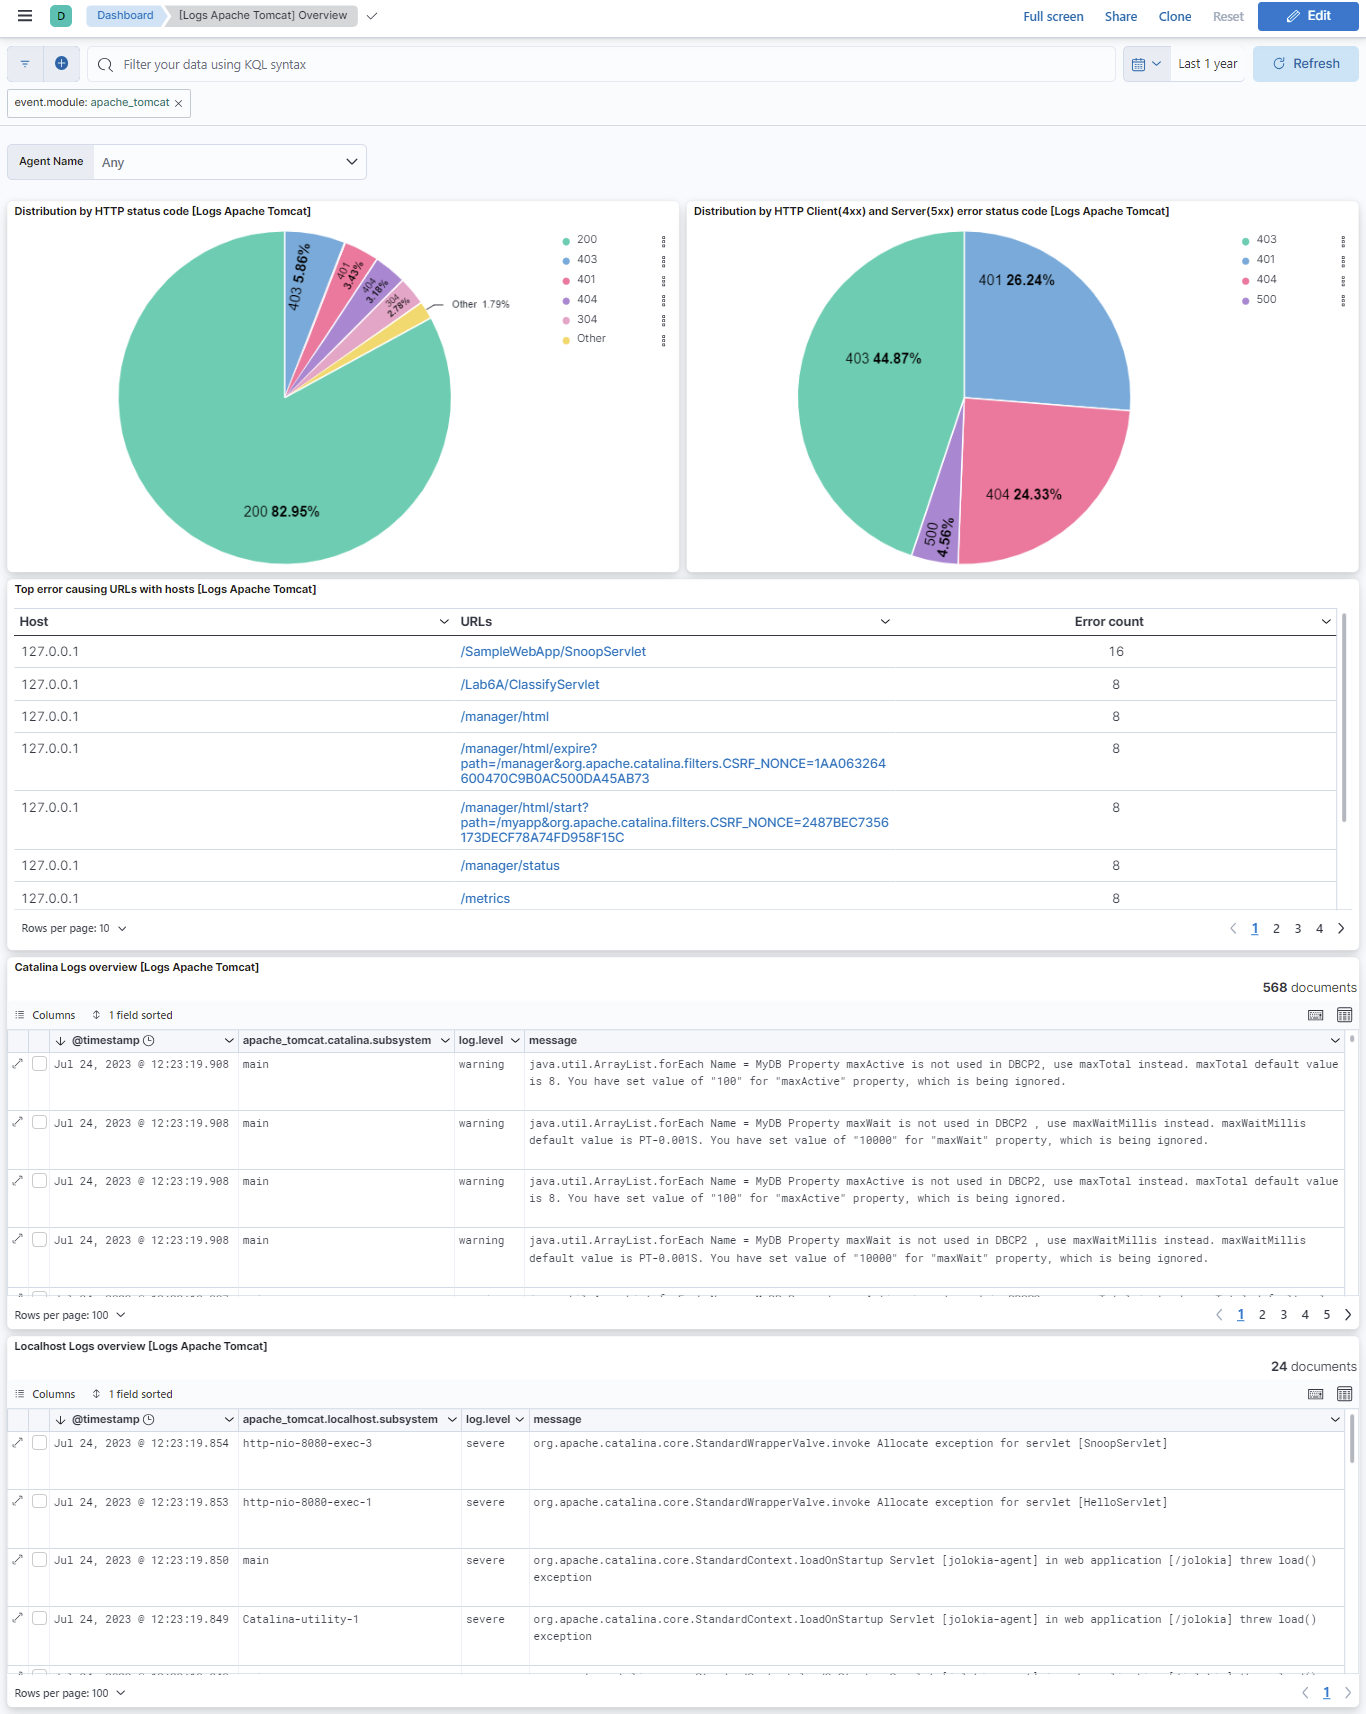
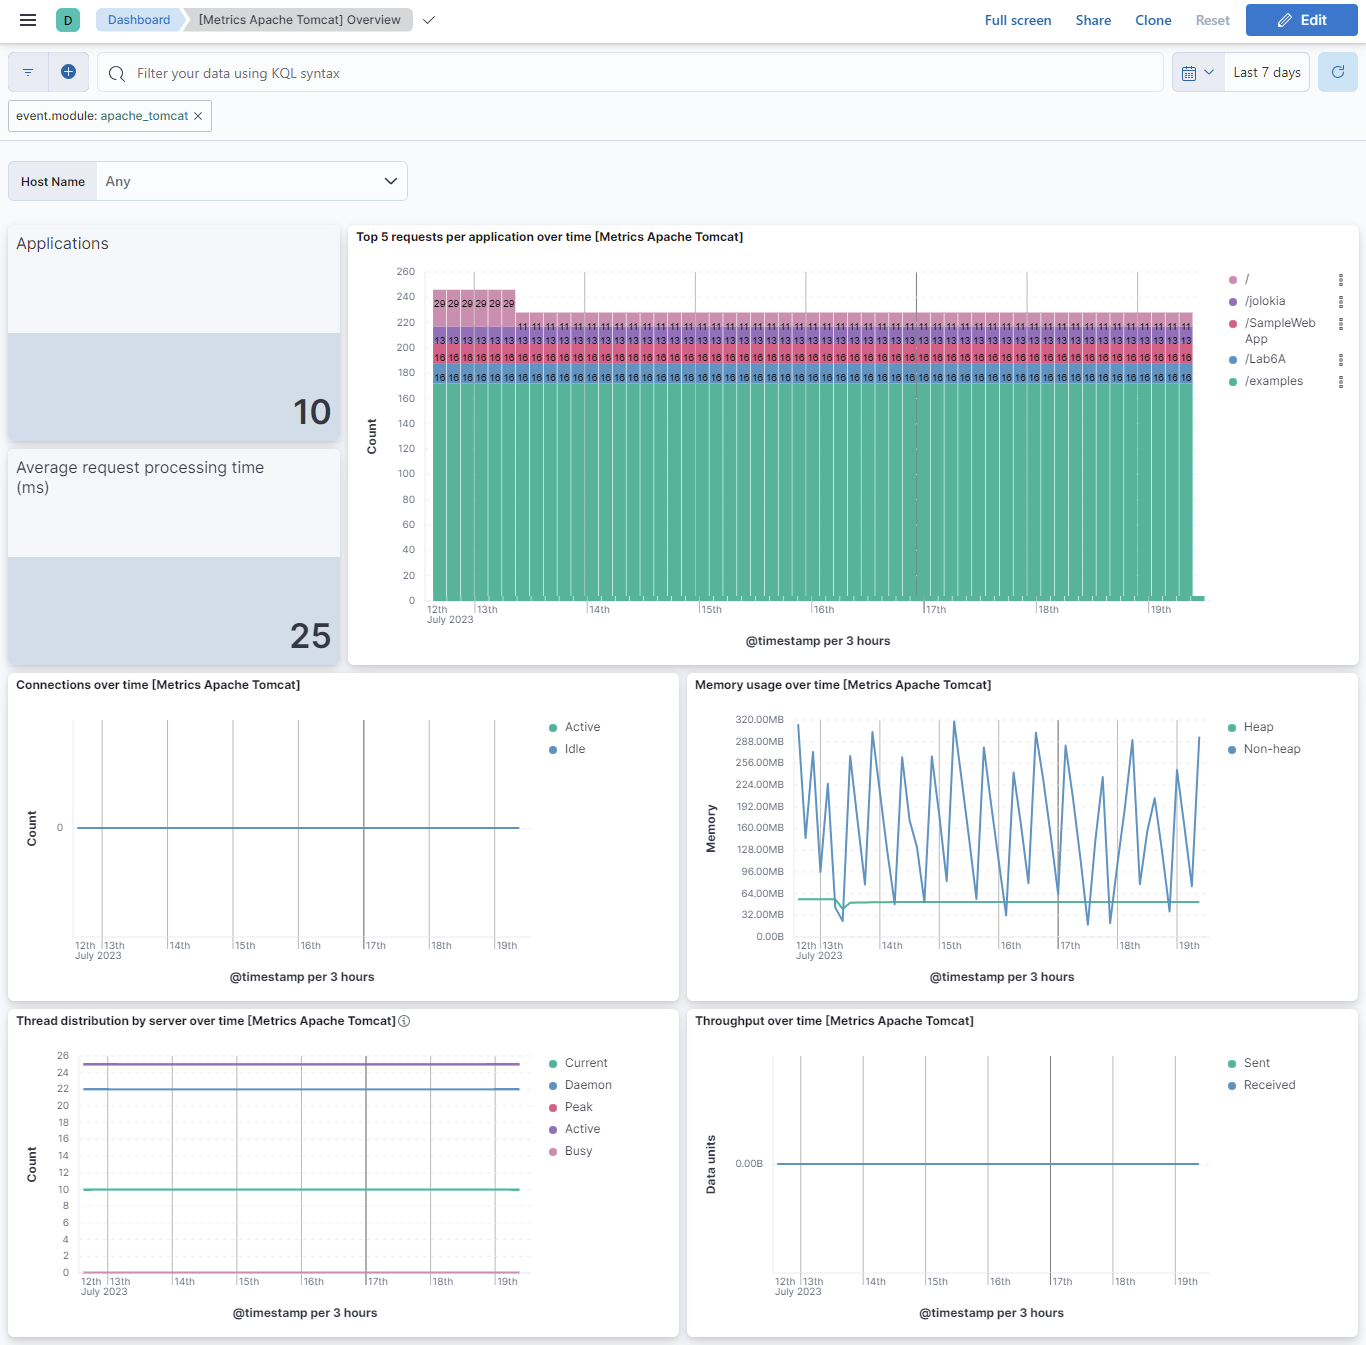
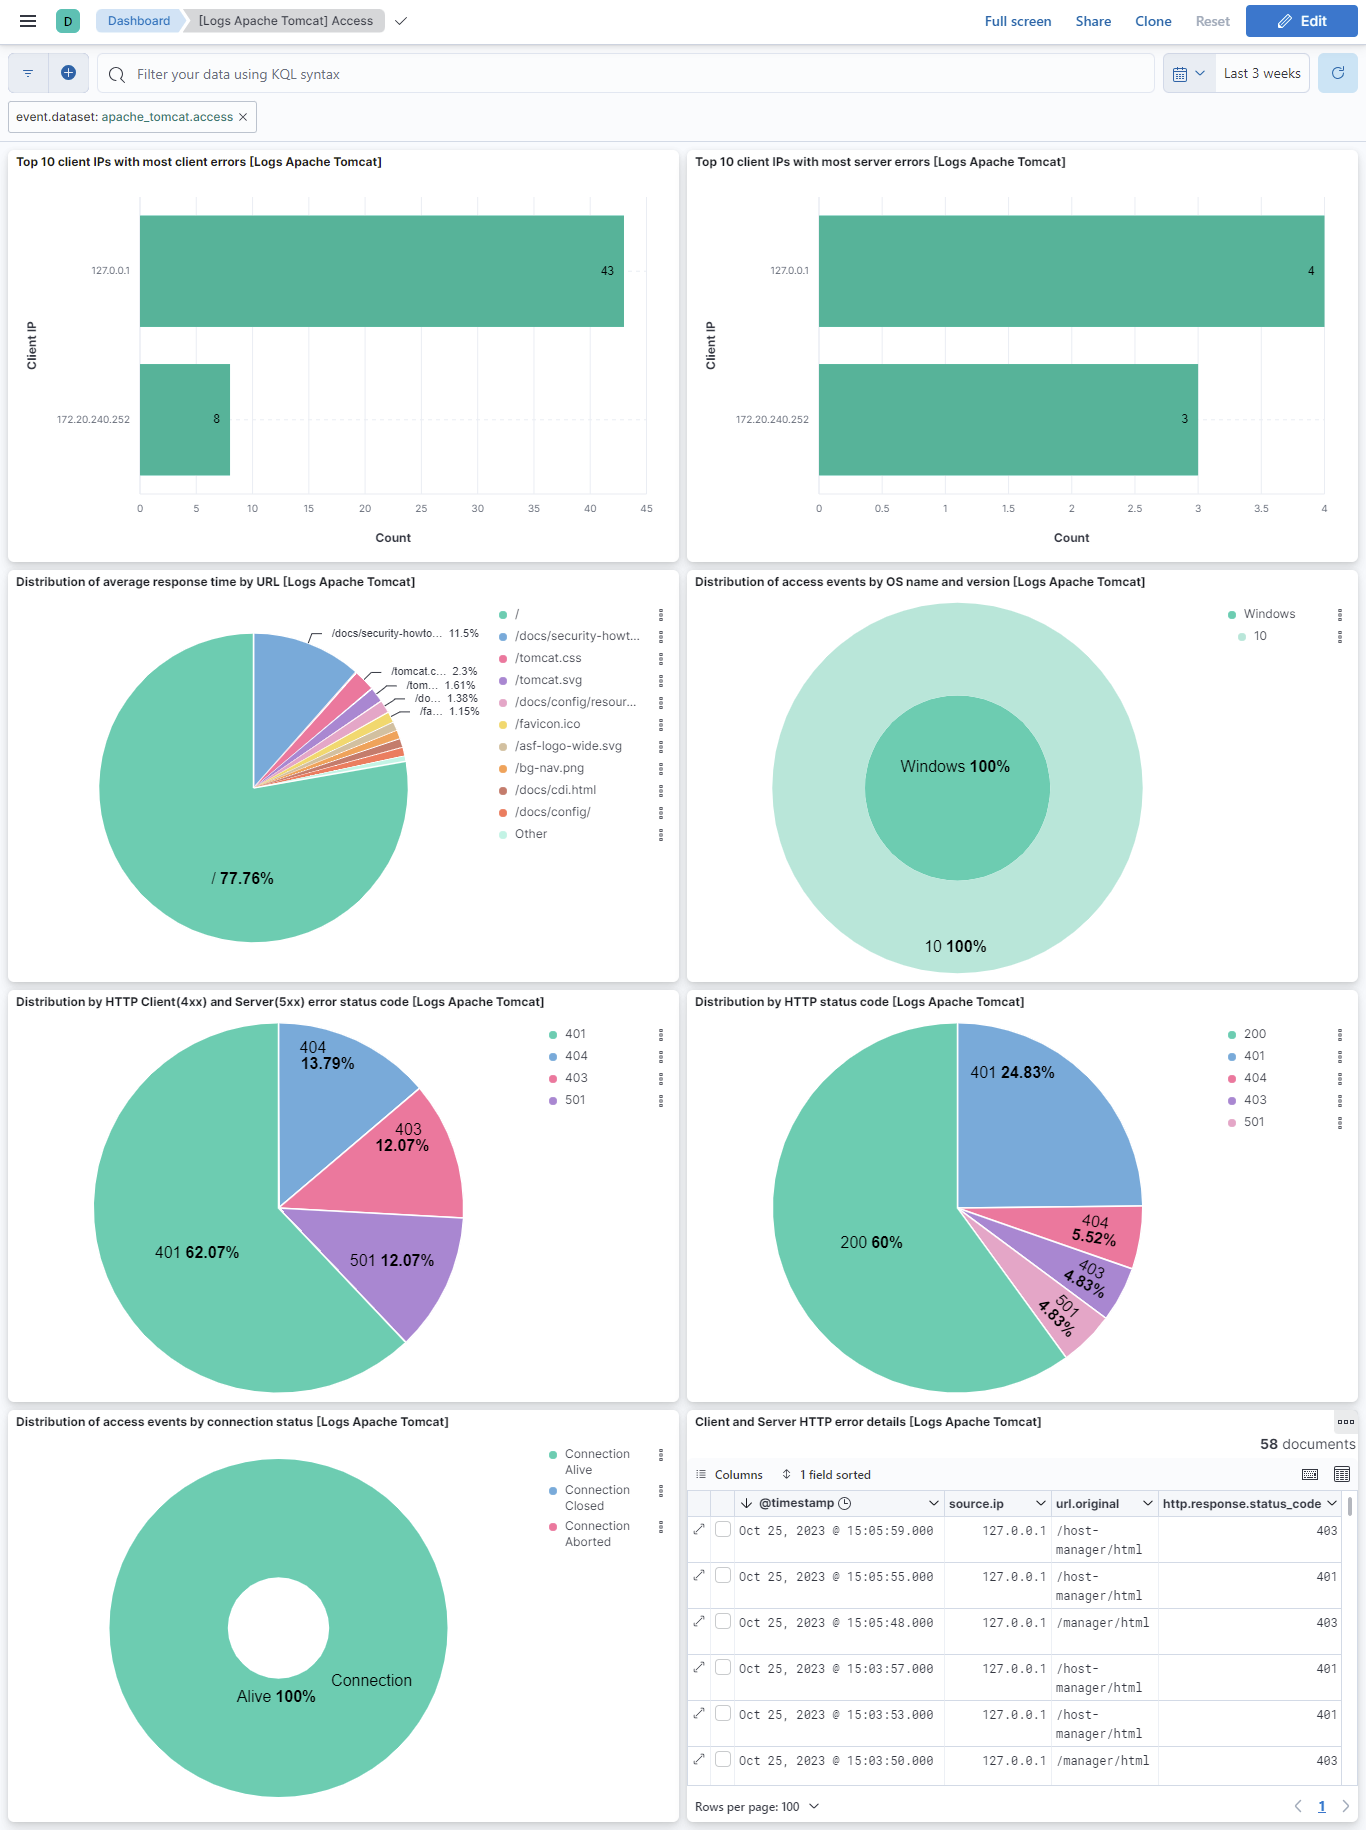
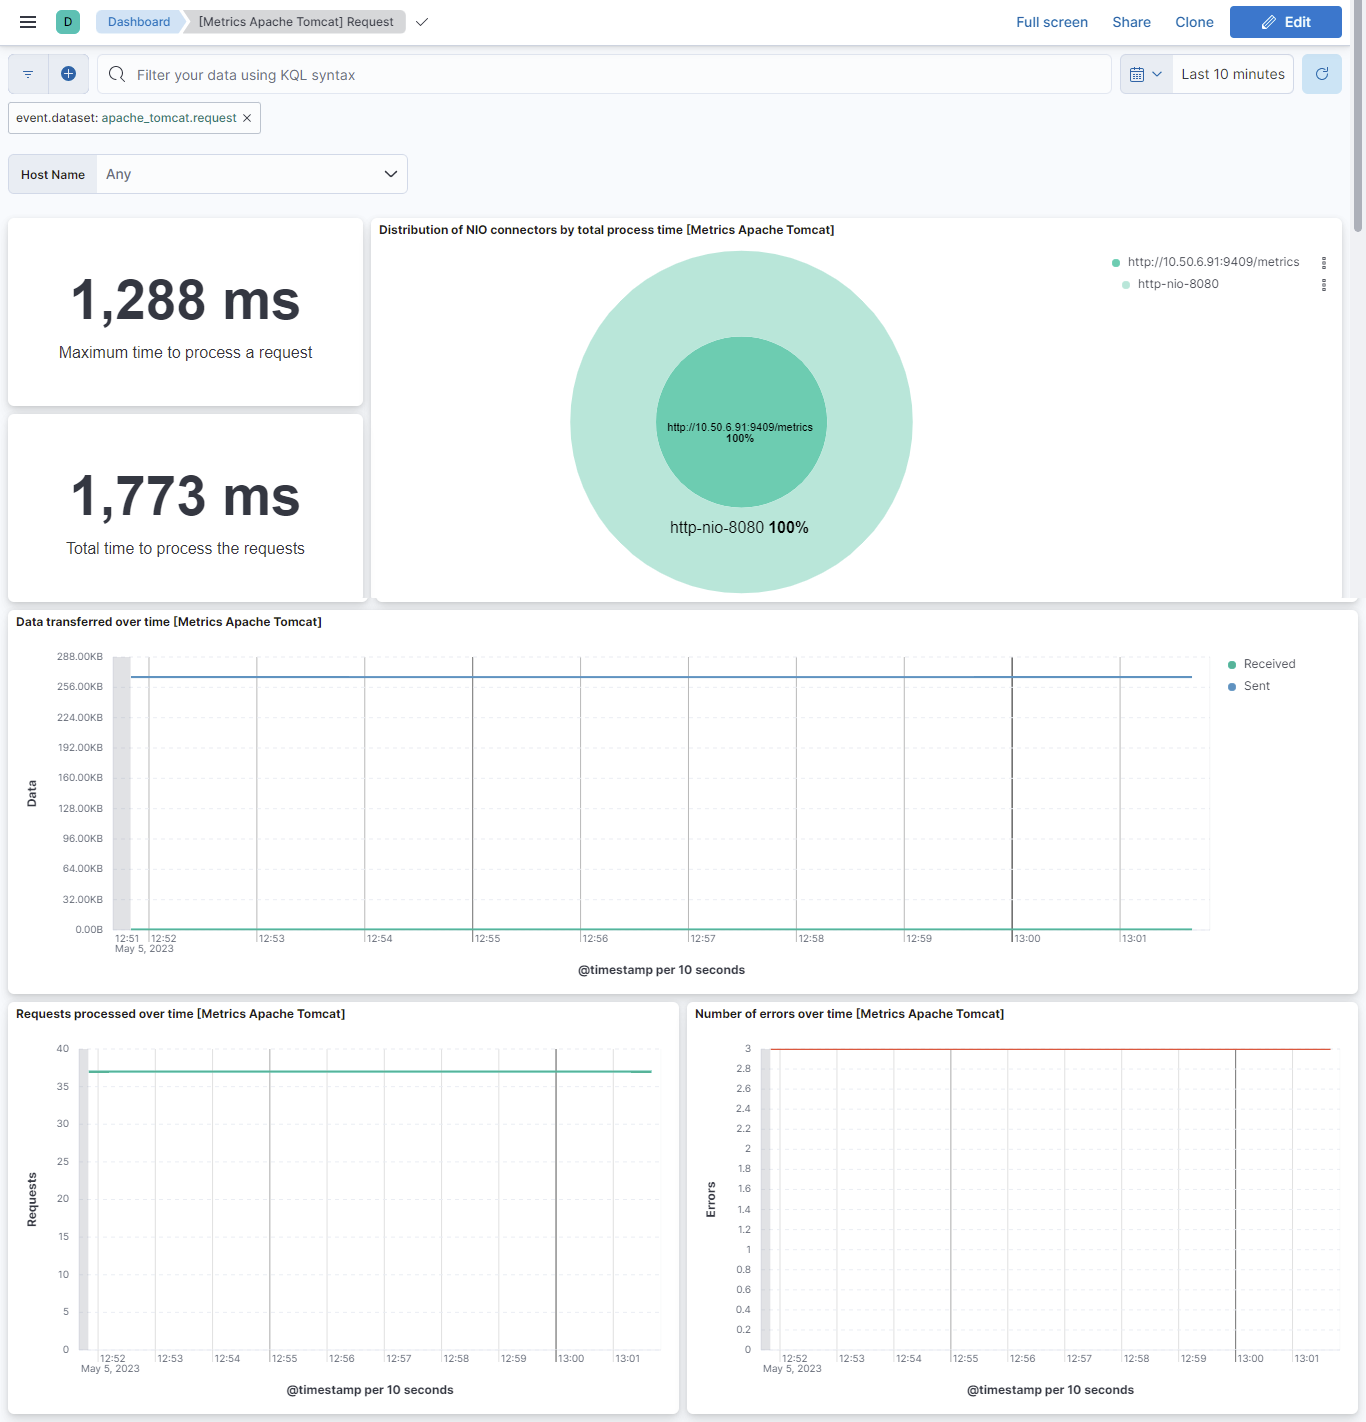
This integration includes one or more Kibana dashboards that visualizes the data collected by the integration. The screenshots below illustrate how the ingested data is displayed.
Changelog
| Version | Details | Minimum Kibana version |
|---|---|---|
| 1.13.0 | Enhancement (View pull request) Added 'custom' configuration field to log data streams |
9.0.0 8.13.0 |
| 1.12.1 | Bug fix (View pull request) Fix IP seperator regex for access logs |
9.0.0 8.13.0 |
| 1.12.0 | Enhancement (View pull request) Improve documentation |
9.0.0 8.13.0 |
| 1.11.0 | Enhancement (View pull request) Add support for defining Conditions |
9.0.0 8.13.0 |
| 1.10.0 | Enhancement (View pull request) Added support for %D attribute in access logs |
9.0.0 8.13.0 |
| 1.9.1 | Bug fix (View pull request) Added description to ssl nodes including links to documentation. |
9.0.0 8.13.0 |
| 1.9.0 | Enhancement (View pull request) Add support for Kibana 9.0.0. |
9.0.0 8.13.0 |
| 1.8.3 | Bug fix (View pull request) Make http.version field optional. |
8.13.0 |
| 1.8.2 | Bug fix (View pull request) Update links to getting started docs |
8.13.0 |
| 1.8.1 | Bug fix (View pull request) Fix 400 bad request within access log causing pipeline failure. |
8.13.0 |
| 1.8.0 | Enhancement (View pull request) Allow @custom pipeline access to event.original without setting preserve_original_event. |
8.13.0 |
| 1.7.0 | Enhancement (View pull request) ECS version updated to 8.11.0. Removed import_mappings. Update the kibana constraint to ^8.13.0. Modified the field definitions to remove ECS fields made redundant by the ecs@mappings component template. |
8.13.0 |
| 1.6.0 | Enhancement (View pull request) Add global filter on data_stream.dataset to improve performance. |
8.12.0 |
| 1.5.1 | Bug fix (View pull request) Fix "Harvester Limit" and "File Handle Closure duration" configuration parameters. |
8.12.0 |
| 1.5.0 | Enhancement (View pull request) Add the configuration option for harvester_limit |
8.12.0 |
| 1.4.0 | Enhancement (View pull request) Enable secrets for sensitive fields. For more details, refer https://www.elastic.co/guide/en/fleet/current/agent-policy.html#agent-policy-secret-values |
8.12.0 |
| 1.3.3 | Bug fix (View pull request) Fix event.outcome for redirection status_codes 3xx. |
8.8.0 |
| 1.3.2 | Bug fix (View pull request) Fix non-matching grok patterns in access log pipeline for 302 errors. |
8.8.0 |
| 1.3.1 | Bug fix (View pull request) Disable secrets for older stack versions due to errors. |
8.8.0 |
| 1.3.0 | Enhancement (View pull request) Enable 'secret' for the sensitive fields, supported from 8.12. |
8.8.0 |
| 1.2.0 | Enhancement (View pull request) Improve apache_tomcat.access pipeline performance |
8.8.0 |
| 1.1.1 | Enhancement (View pull request) Improve wording on milliseconds in apache_tomcat time field |
8.8.0 |
| 1.1.0 | Enhancement (View pull request) Improve apache_tomcat.access pipeline performance |
8.8.0 |
| 1.0.0 | Enhancement (View pull request) Make Apache Tomcat GA. |
8.8.0 |
| 0.17.2 | Enhancement (View pull request) Update description in README.md. |
8.8.0 |
| 0.17.1 | Bug fix (View pull request) Fix pipeline test and rename header_forwarder field to client.ip. |
8.8.0 |
| 0.17.0 | Enhancement (View pull request) Make parsers configurable for catalina and localhost logs |
8.8.0 |
| 0.16.0 | Enhancement (View pull request) Support of additional log format in access logs |
8.8.0 |
| 0.15.0 | Enhancement (View pull request) Add support of TSDB enablement to request and cache data streams. |
8.8.0 |
| 0.14.0 | Enhancement (View pull request) Update the package format_version to 3.0.0. |
8.8.0 |
| 0.13.0 | Enhancement (View pull request) Adapt fields for changes in file system info |
8.8.0 |
| 0.12.3 | Bug fix (View pull request) Add null check and ignore_missing check to the rename processor |
8.8.0 |
| 0.12.2 | Bug fix (View pull request) Remove forwarded tag from metrics data streams. |
8.8.0 |
| 0.12.1 | Enhancement (View pull request) Add supported log formats for Catalina and Localhost logs in README. |
8.8.0 |
| 0.12.0 | Enhancement (View pull request) Add overview dashboards for logs and metrics. |
8.8.0 |
| 0.11.0 | Enhancement (View pull request) Apache Tomcat integration package with "connection_pool" data stream. |
8.8.0 |
| 0.10.0 | Enhancement (View pull request) Apache Tomcat integration package with "thread_pool" data stream. |
8.8.0 |
| 0.9.0 | Enhancement (View pull request) Apache Tomcat integration package with "memory" data stream. |
8.8.0 |
| 0.8.0 | Enhancement (View pull request) Update the processor description link. |
8.8.0 |
| 0.7.0 | Enhancement (View pull request) Apache Tomcat integration package with "session" data stream. |
8.8.0 |
| 0.6.0 | Enhancement (View pull request) Rename ownership from obs-service-integrations to obs-infraobs-integrations |
8.7.0 |
| 0.5.1 | Bug fix (View pull request) Remove Localhost dashboard and update saved searches. |
8.7.0 |
| 0.5.0 | Enhancement (View pull request) Apache Tomcat integration package with "access" data stream. |
8.7.0 |
| 0.4.0 | Enhancement (View pull request) Apache Tomcat integration package with "localhost" data stream. |
8.7.0 |
| 0.3.0 | Enhancement (View pull request) Apache Tomcat integration package with "request" data stream. |
8.7.0 |
| 0.2.0 | Enhancement (View pull request) Apache Tomcat integration package with "cache" data stream. |
8.7.0 |
| 0.1.0 | Enhancement (View pull request) Apache Tomcat integration package with "catalina" data stream. |
8.7.0 |
