- Elastic integrations
- Integrations quick reference
- 1Password
- Abnormal Security
- ActiveMQ
- Active Directory Entity Analytics
- Admin By Request EPM integration
- Airflow
- Akamai
- Apache
- API (custom)
- Arbor Peakflow SP Logs
- Arista NG Firewall
- Atlassian
- Auditd
- Auth0
- authentik
- AWS
- Amazon CloudFront
- Amazon DynamoDB
- Amazon EBS
- Amazon EC2
- Amazon ECS
- Amazon EMR
- AWS API Gateway
- Amazon GuardDuty
- AWS Health
- Amazon Kinesis Data Firehose
- Amazon Kinesis Data Stream
- Amazon MQ
- Amazon Managed Streaming for Apache Kafka (MSK)
- Amazon NAT Gateway
- Amazon RDS
- Amazon Redshift
- Amazon S3
- Amazon S3 Storage Lens
- Amazon Security Lake
- Amazon SNS
- Amazon SQS
- Amazon VPC
- Amazon VPN
- AWS Bedrock
- AWS Billing
- AWS CloudTrail
- AWS CloudWatch
- AWS ELB
- AWS Fargate
- AWS Inspector
- AWS Lambda
- AWS Logs (custom)
- AWS Network Firewall
- AWS Route 53
- AWS Security Hub
- AWS Transit Gateway
- AWS Usage
- AWS WAF
- Azure
- Activity logs
- App Service
- Application Gateway
- Application Insights metrics
- Application Insights metrics overview
- Application State Insights metrics
- Azure logs (v2 preview)
- Azure OpenAI
- Billing metrics
- Container instance metrics
- Container registry metrics
- Container service metrics
- Custom Azure Logs
- Custom Blob Storage Input
- Database Account metrics
- Event Hub input
- Firewall logs
- Frontdoor
- Functions
- Microsoft Entra ID
- Monitor metrics
- Network Watcher VNet
- Network Watcher NSG
- Platform logs
- Resource metrics
- Spring Cloud logs
- Storage Account metrics
- Virtual machines metrics
- Virtual machines scaleset metrics
- Barracuda
- BeyondInsight and Password Safe Integration
- BitDefender
- Bitwarden
- blacklens.io
- Blue Coat Director Logs
- BBOT (Bighuge BLS OSINT Tool)
- Box Events
- Bravura Monitor
- Broadcom ProxySG
- Canva
- Cassandra
- CEL Custom API
- Ceph
- Check Point
- Cilium Tetragon
- CISA Known Exploited Vulnerabilities
- Cisco
- Cisco Meraki Metrics
- Citrix
- Claroty CTD
- Cloudflare
- Cloud Asset Inventory
- CockroachDB Metrics
- Common Event Format (CEF)
- Containerd
- CoreDNS
- Corelight
- Couchbase
- CouchDB
- Cribl
- CrowdStrike
- Cyberark
- Cybereason
- CylanceProtect Logs
- Custom Websocket logs
- Darktrace
- Data Exfiltration Detection
- DGA
- Digital Guardian
- Docker
- DomainTools Real Time Unified Feeds
- Elastic APM
- Elastic Fleet Server
- Elastic Security
- Elastic Stack monitoring
- Elasticsearch Service Billing
- Envoy Proxy
- ESET PROTECT
- ESET Threat Intelligence
- etcd
- Falco
- F5
- File Integrity Monitoring
- FireEye Network Security
- First EPSS
- Forcepoint Web Security
- ForgeRock
- Fortinet
- Gigamon
- GitHub
- GitLab
- Golang
- Google Cloud
- Custom GCS Input
- GCP
- GCP Audit logs
- GCP Billing metrics
- GCP Cloud Run metrics
- GCP CloudSQL metrics
- GCP Compute metrics
- GCP Dataproc metrics
- GCP DNS logs
- GCP Firestore metrics
- GCP Firewall logs
- GCP GKE metrics
- GCP Load Balancing metrics
- GCP Metrics Input
- GCP PubSub logs (custom)
- GCP PubSub metrics
- GCP Redis metrics
- GCP Security Command Center
- GCP Storage metrics
- GCP VPC Flow logs
- GCP Vertex AI
- GoFlow2 logs
- Hadoop
- HAProxy
- Hashicorp Vault
- HTTP Endpoint logs (custom)
- IBM MQ
- IIS
- Imperva
- InfluxDb
- Infoblox
- Iptables
- Istio
- Jamf Compliance Reporter
- Jamf Pro
- Jamf Protect
- Jolokia Input
- Journald logs (custom)
- JumpCloud
- Kafka
- Keycloak
- Kubernetes
- LastPass
- Lateral Movement Detection
- Linux Metrics
- Living off the Land Attack Detection
- Logs (custom)
- Lumos
- Lyve Cloud
- Mattermost
- Memcached
- Menlo Security
- Microsoft
- Microsoft 365
- Microsoft Defender for Cloud
- Microsoft Defender for Endpoint
- Microsoft DHCP
- Microsoft DNS Server
- Microsoft Entra ID Entity Analytics
- Microsoft Exchange Online Message Trace
- Microsoft Exchange Server
- Microsoft Graph Activity Logs
- Microsoft M365 Defender
- Microsoft Office 365 Metrics Integration
- Microsoft Sentinel
- Microsoft SQL Server
- Mimecast
- ModSecurity Audit
- MongoDB
- MongoDB Atlas
- MySQL
- Nagios XI
- NATS
- NetFlow Records
- Netskope
- Network Beaconing Identification
- Network Packet Capture
- Nginx
- Okta
- Oracle
- OpenAI
- OpenCanary
- Osquery
- Palo Alto
- pfSense
- PHP-FPM
- PingOne
- PingFederate
- Pleasant Password Server
- PostgreSQL
- Prometheus
- Proofpoint TAP
- Proofpoint On Demand
- Pulse Connect Secure
- Qualys VMDR
- QNAP NAS
- RabbitMQ Logs
- Radware DefensePro Logs
- Rapid7
- Redis
- Rubrik RSC Metrics Integration
- Sailpoint Identity Security Cloud
- Salesforce
- SentinelOne
- ServiceNow
- Slack Logs
- Snort
- Snyk
- SonicWall Firewall
- Sophos
- Spring Boot
- SpyCloud Enterprise Protection
- SQL Input
- Squid Logs
- SRX
- STAN
- Statsd Input
- Sublime Security
- Suricata
- StormShield SNS
- Symantec
- Symantec Endpoint Security
- Sysmon for Linux
- Sysdig
- Syslog Router Integration
- System
- System Audit
- Tanium
- TCP Logs (custom)
- Tenable OT Security
- Teleport
- Tenable
- Threat intelligence
- ThreatConnect
- Threat Map
- Thycotic Secret Server
- Tines
- Traefik
- Trellix
- Trend Micro
- TYCHON Agentless
- UDP Logs (custom)
- Universal Profiling
- Varonis integration
- Vectra Detect
- VMware
- WatchGuard Firebox
- WebSphere Application Server
- Windows
- Wiz
- Zeek
- ZeroFox
- Zero Networks
- ZooKeeper Metrics
- Zoom
- Zscaler
Corelight
editCorelight
editVersion |
0.8.0 [beta] This functionality is in beta and is subject to change. The design and code is less mature than official GA features and is being provided as-is with no warranties. Beta features are not subject to the support SLA of official GA features. (View all) |
Compatible Kibana version(s) |
8.16.0 or higher |
Supported Serverless project types |
Security |
Subscription level |
Basic |
Level of support |
Partner |
Corelight provides network detection and response (NDR) solutions that enhance visibility, threat detection, and incident response by leveraging open-source technologies like Zeek. Its platform integrates with existing security tools to deliver high-fidelity network data, helping organizations detect and respond to threats more effectively across both on-premises and cloud environments.
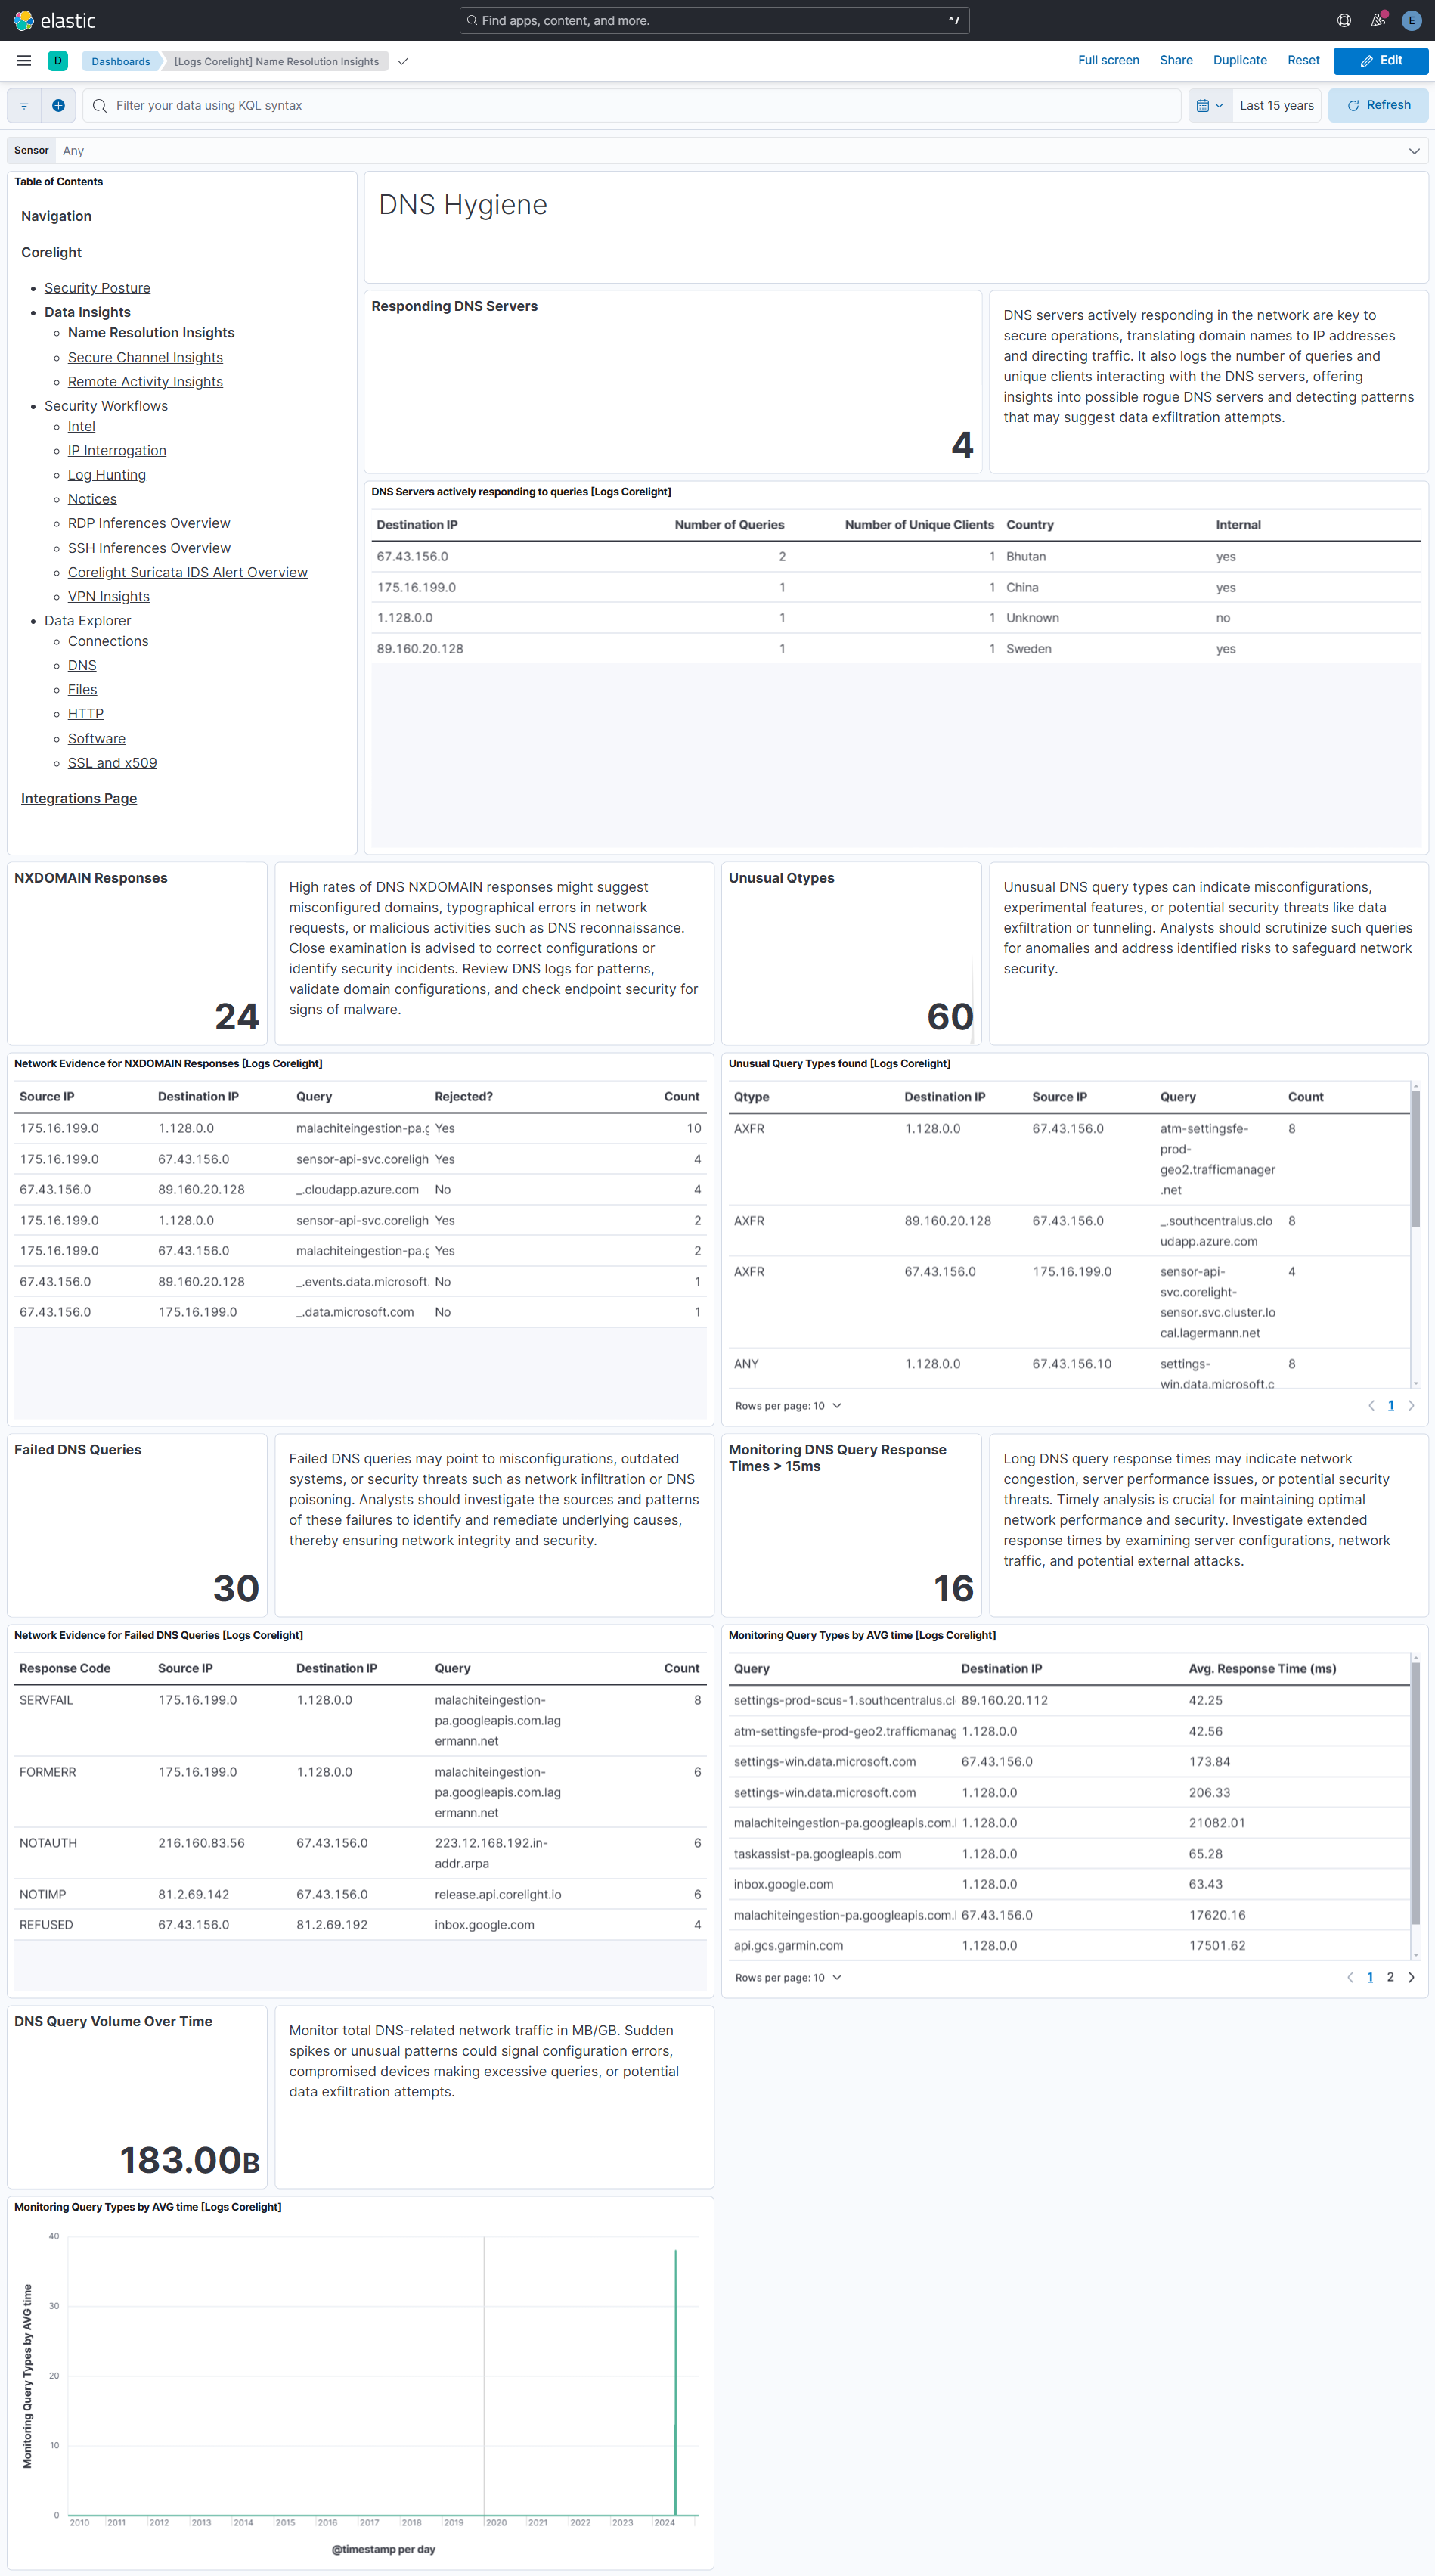
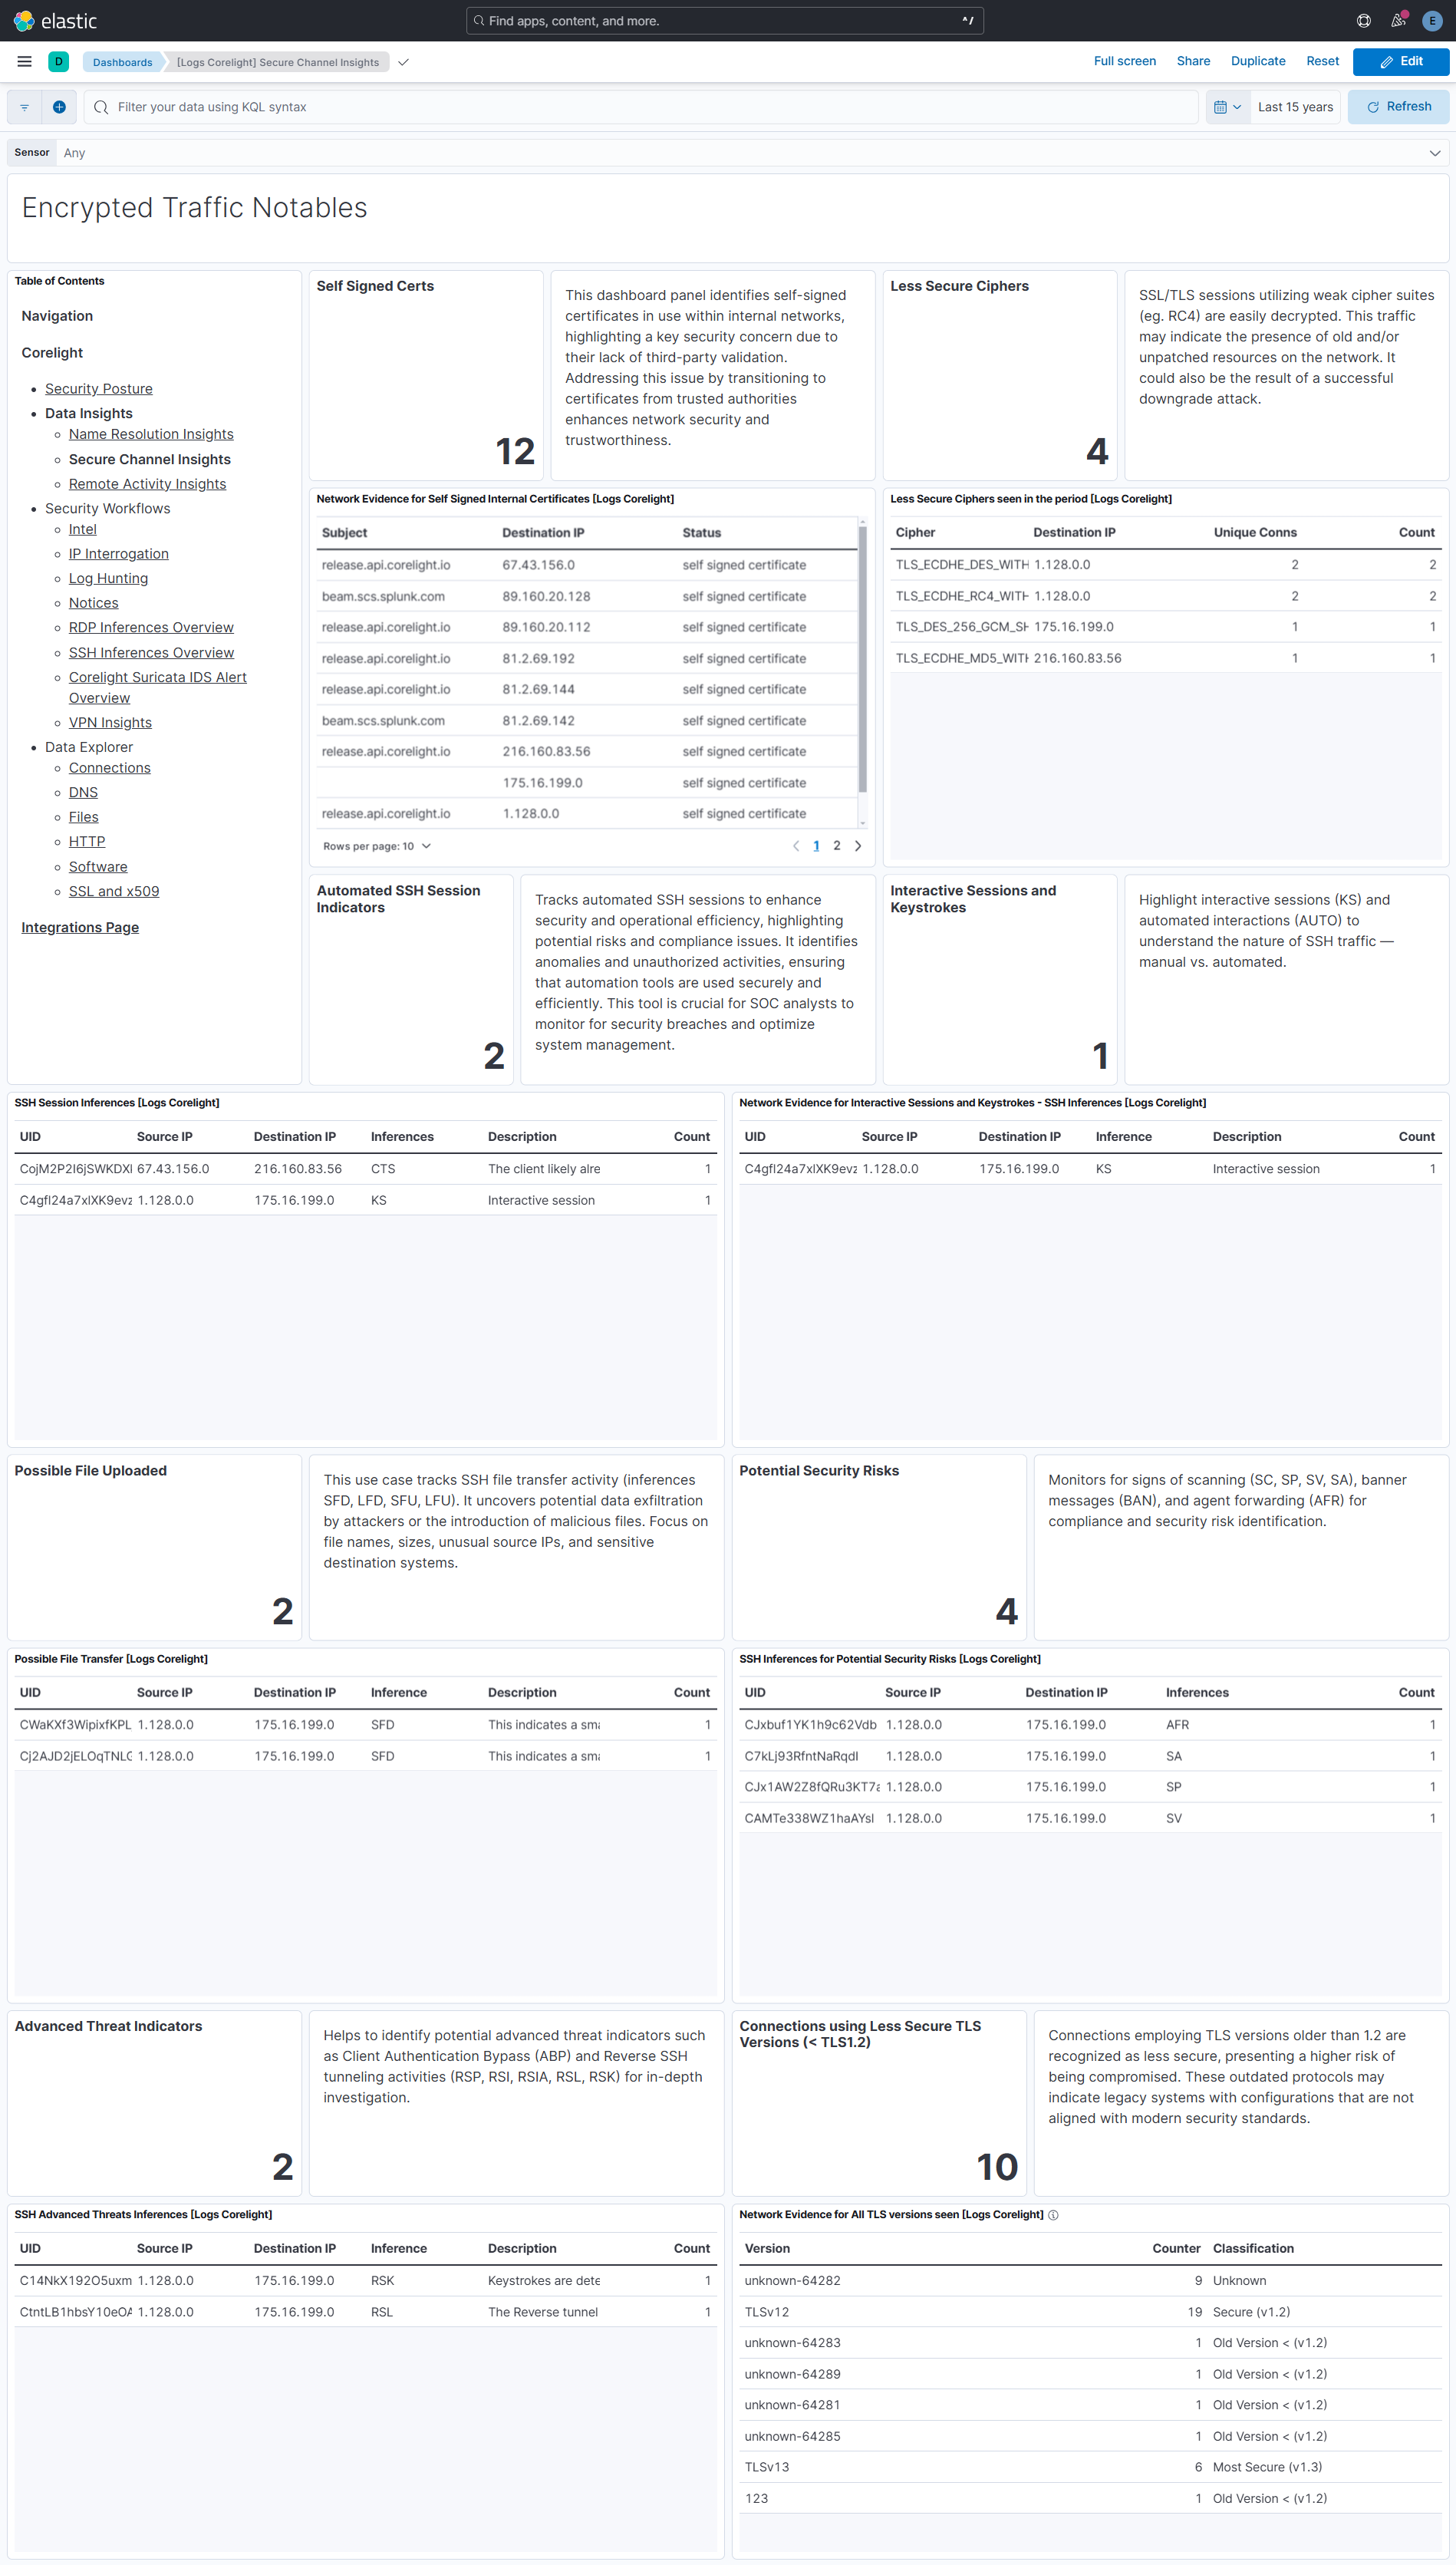
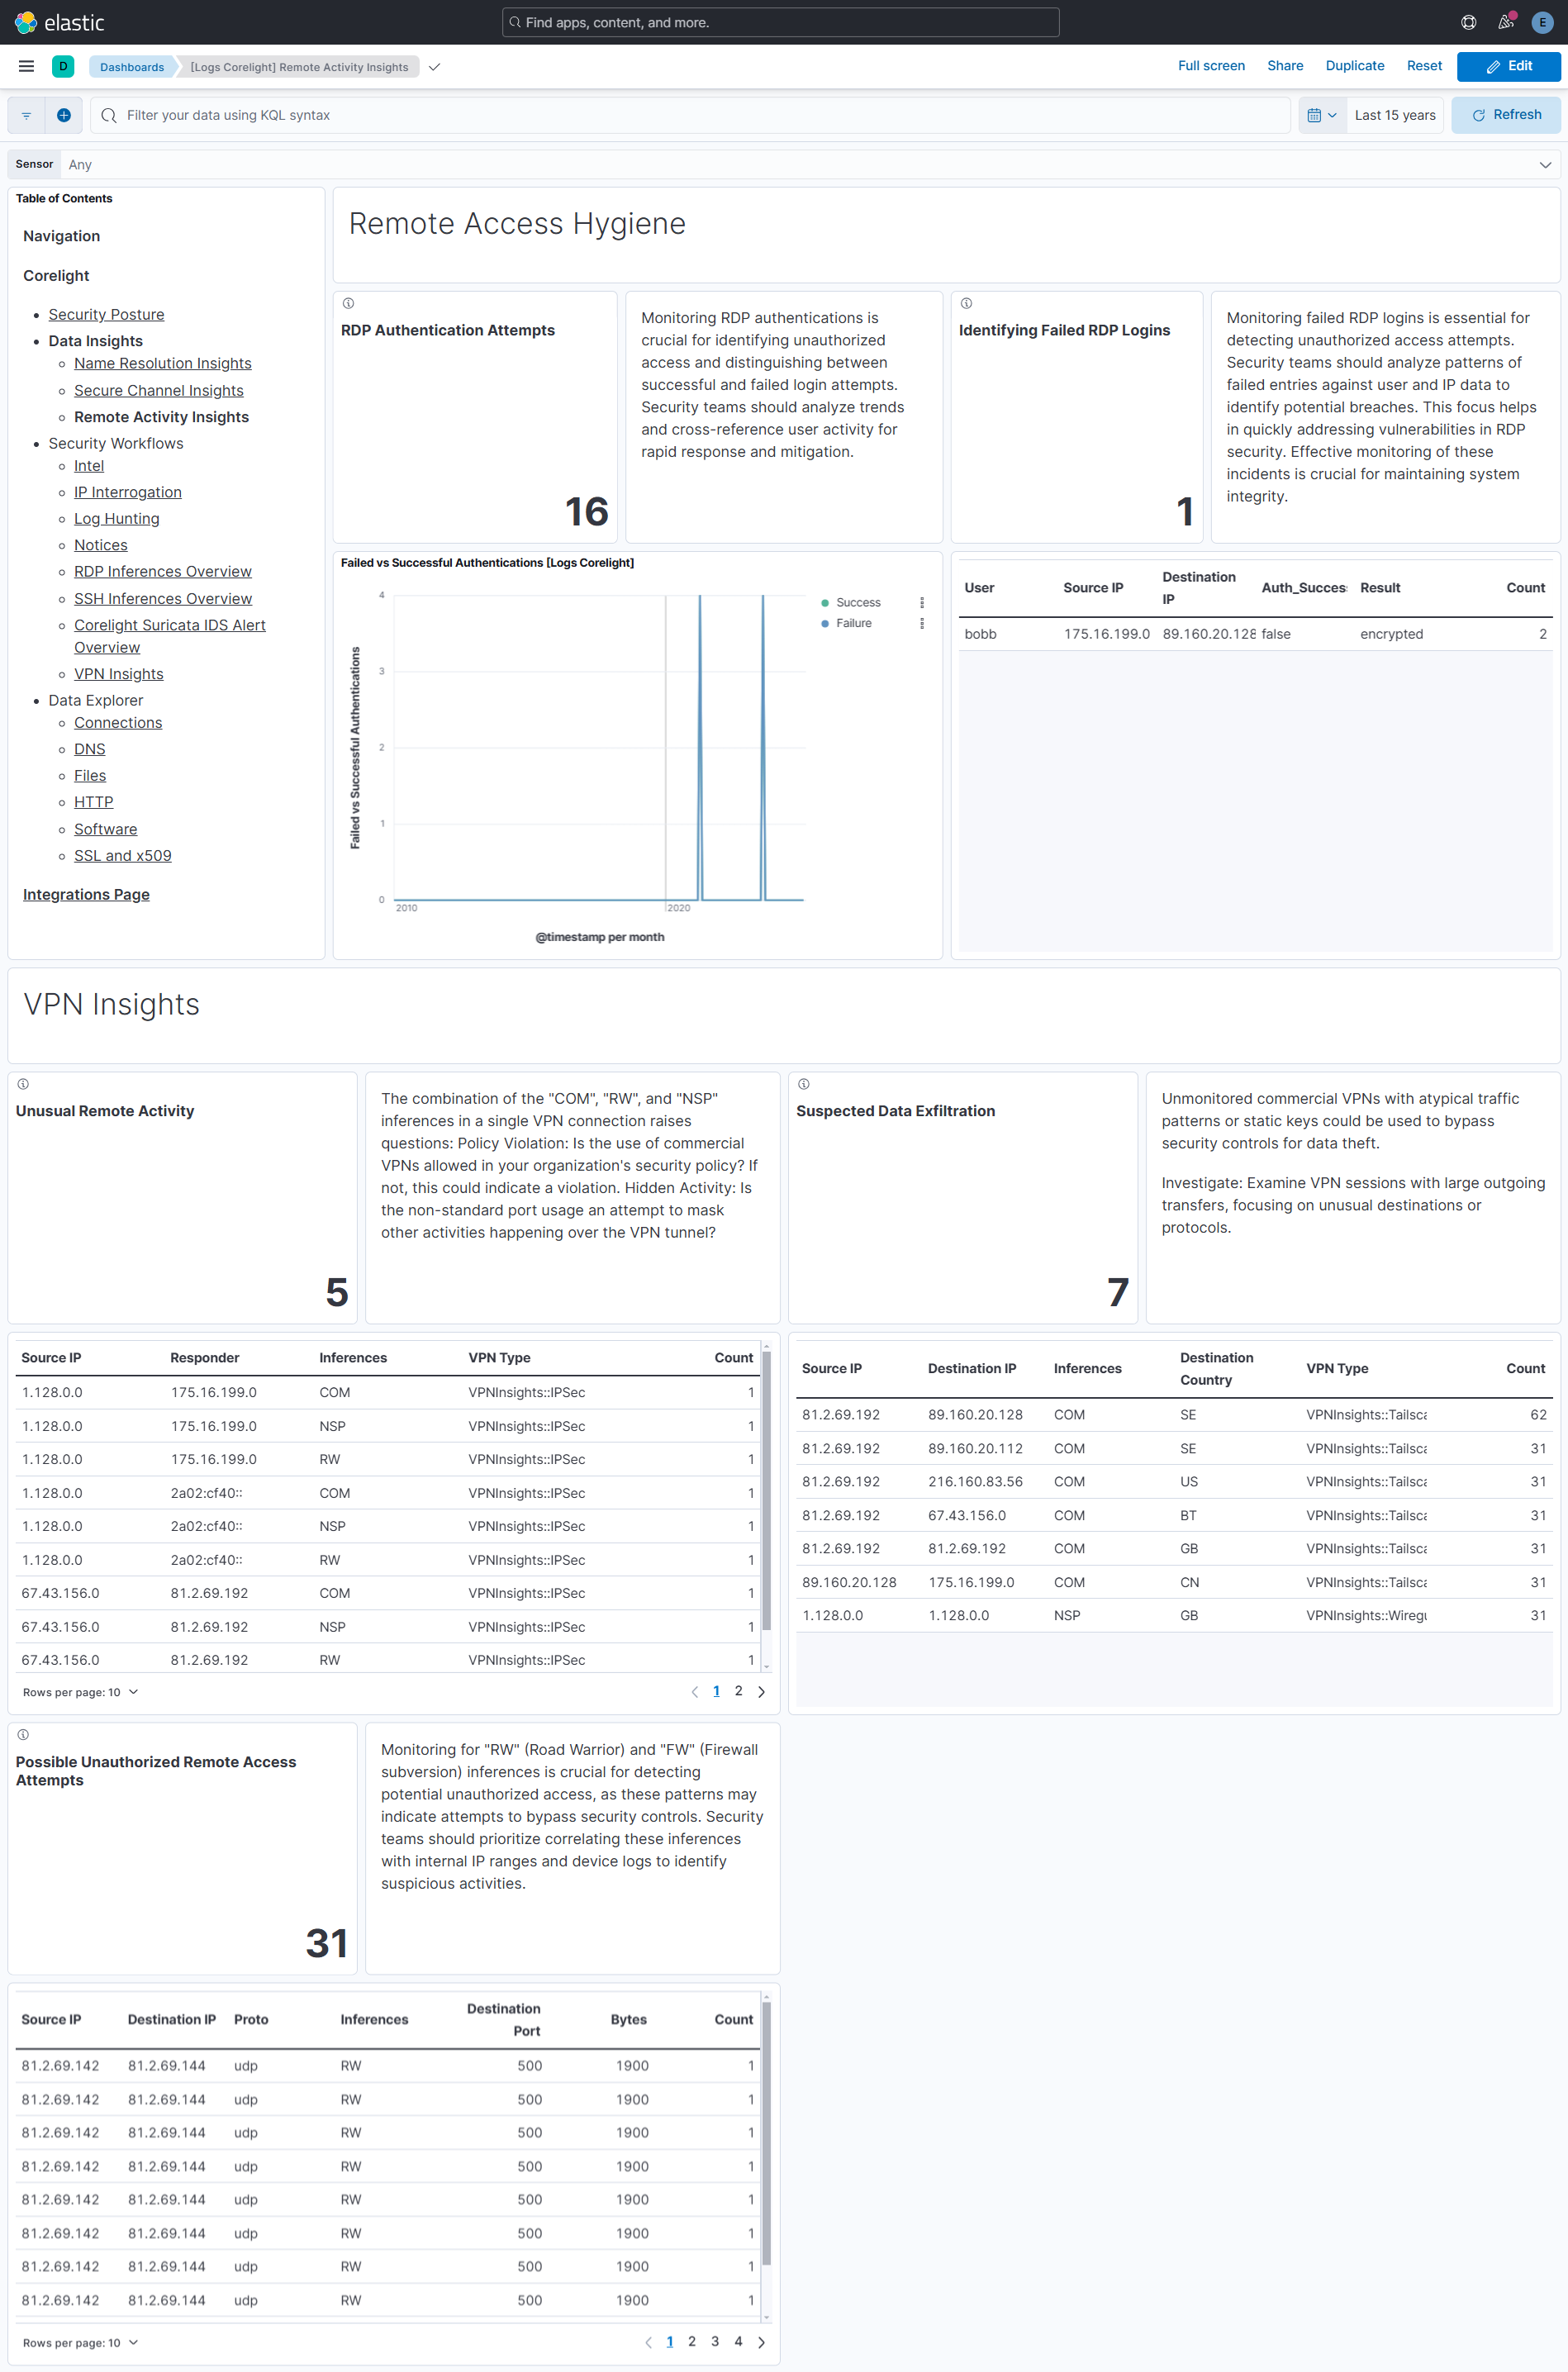
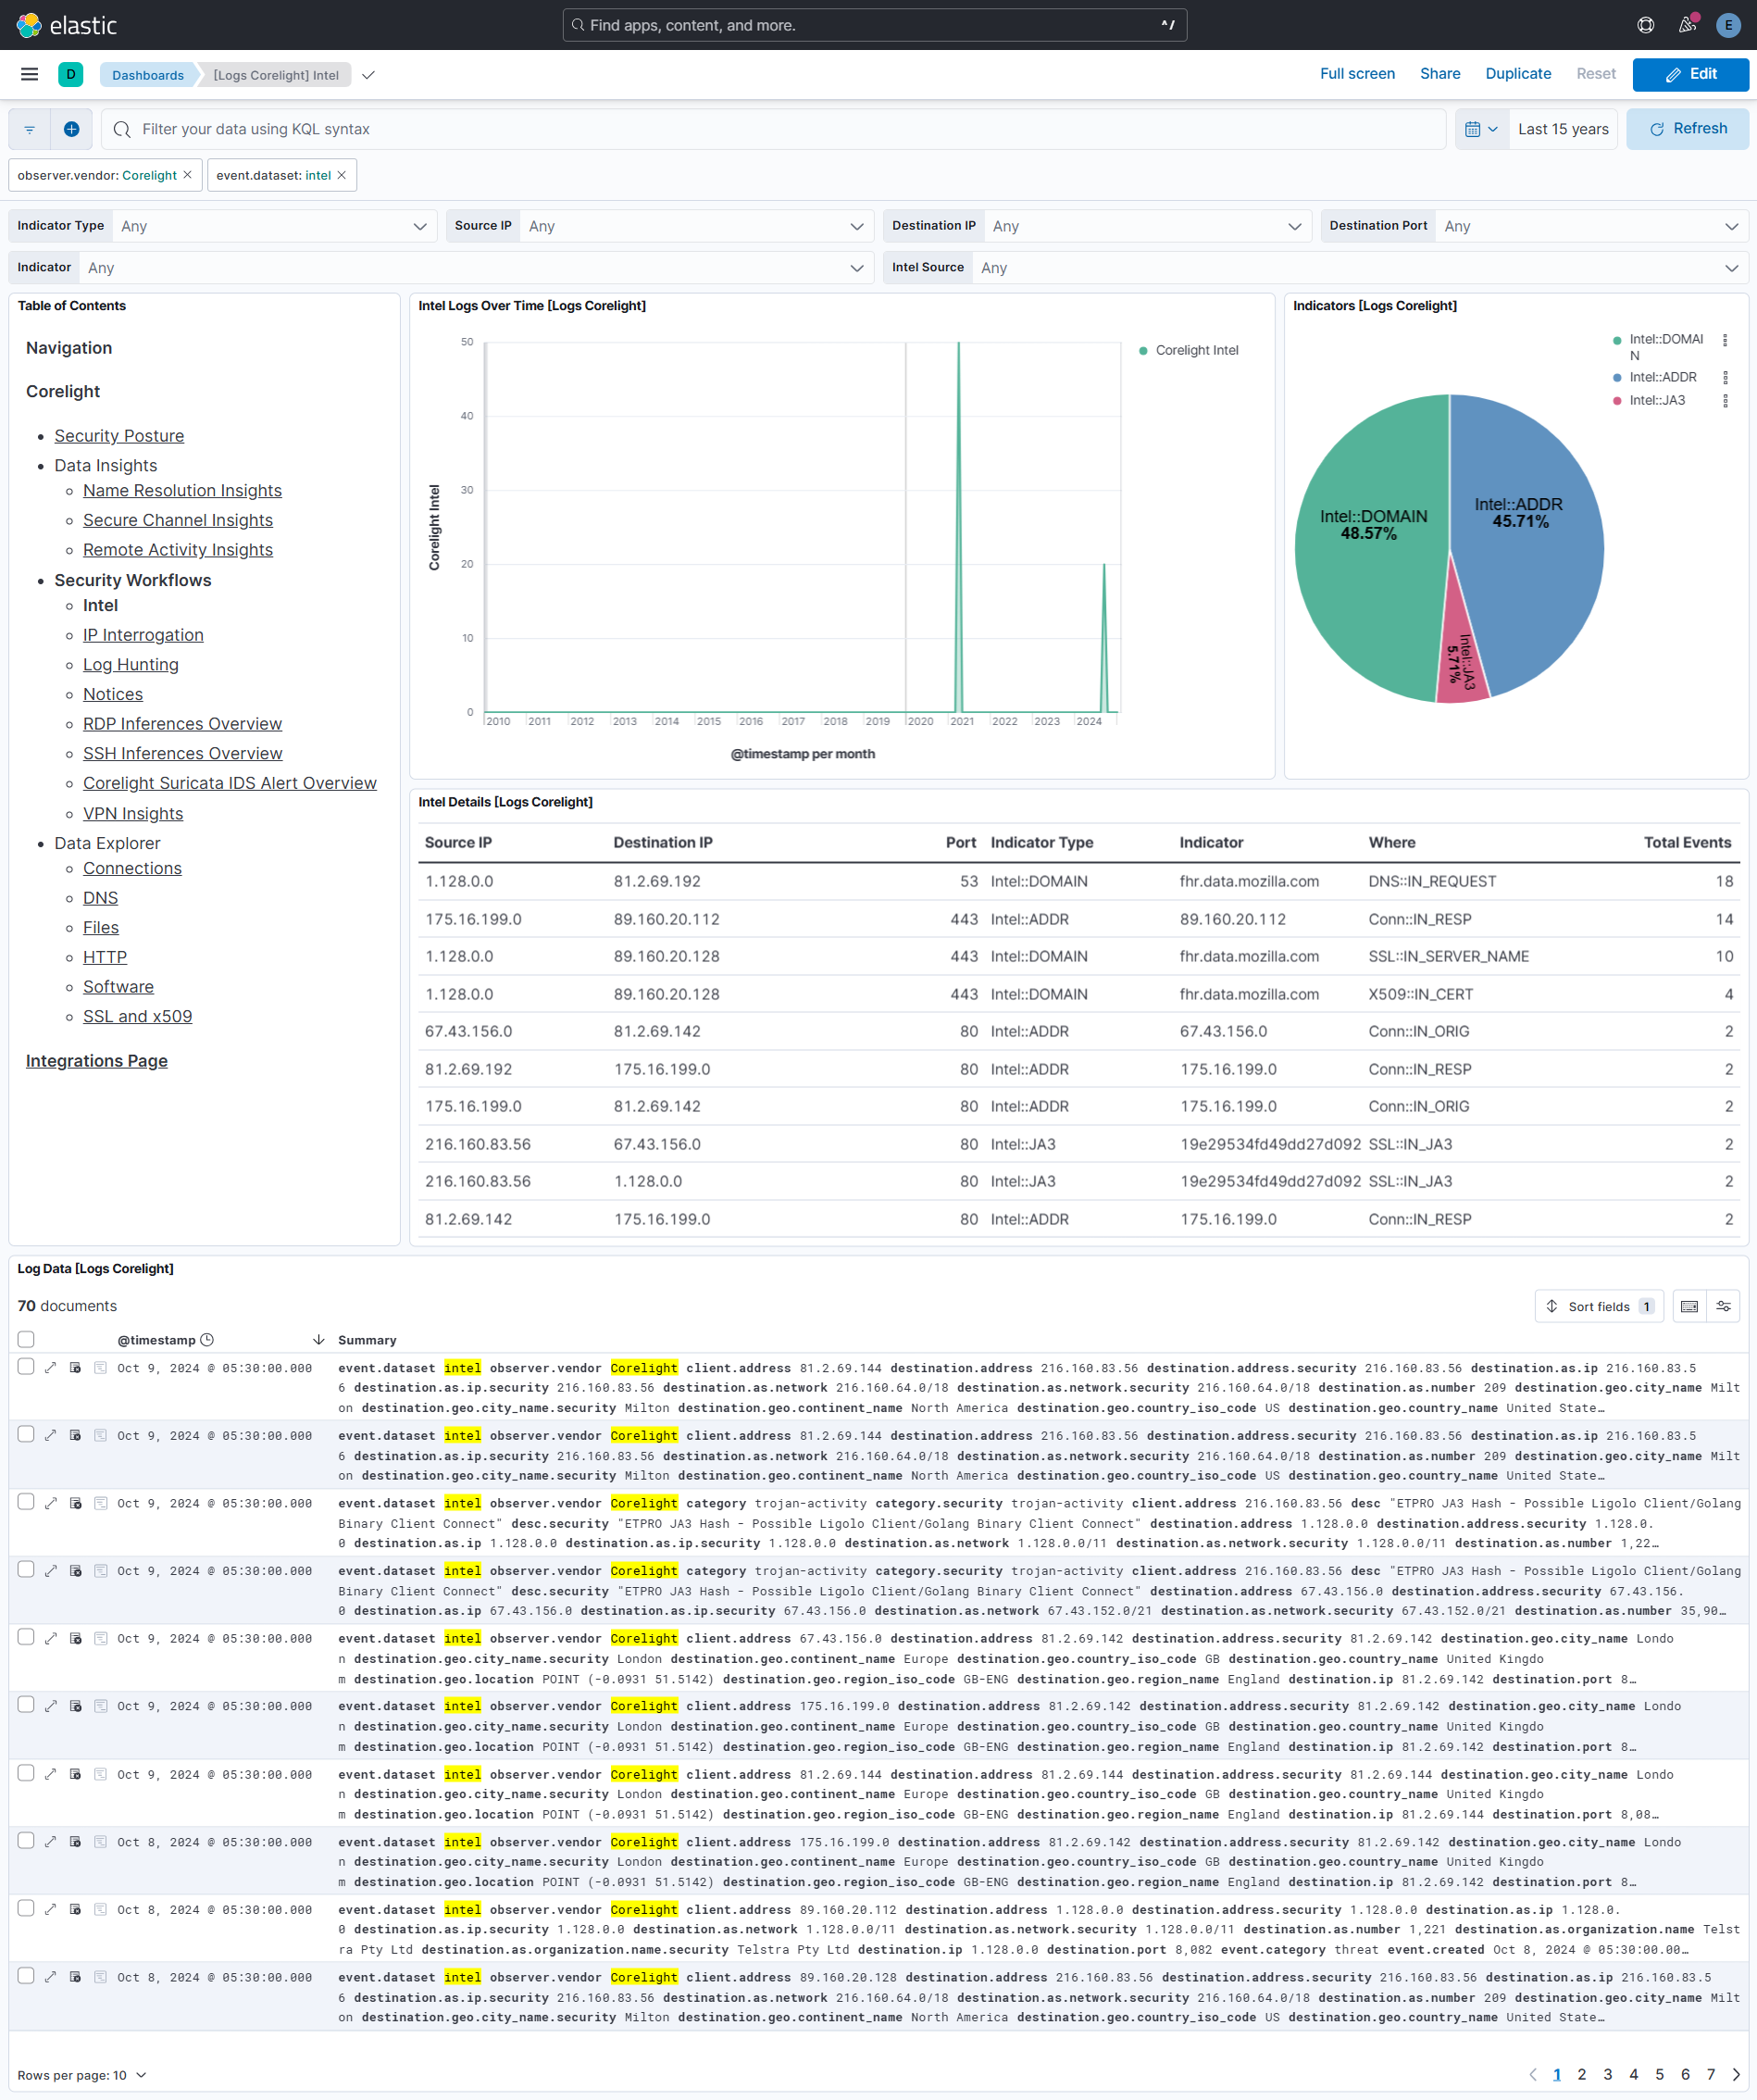
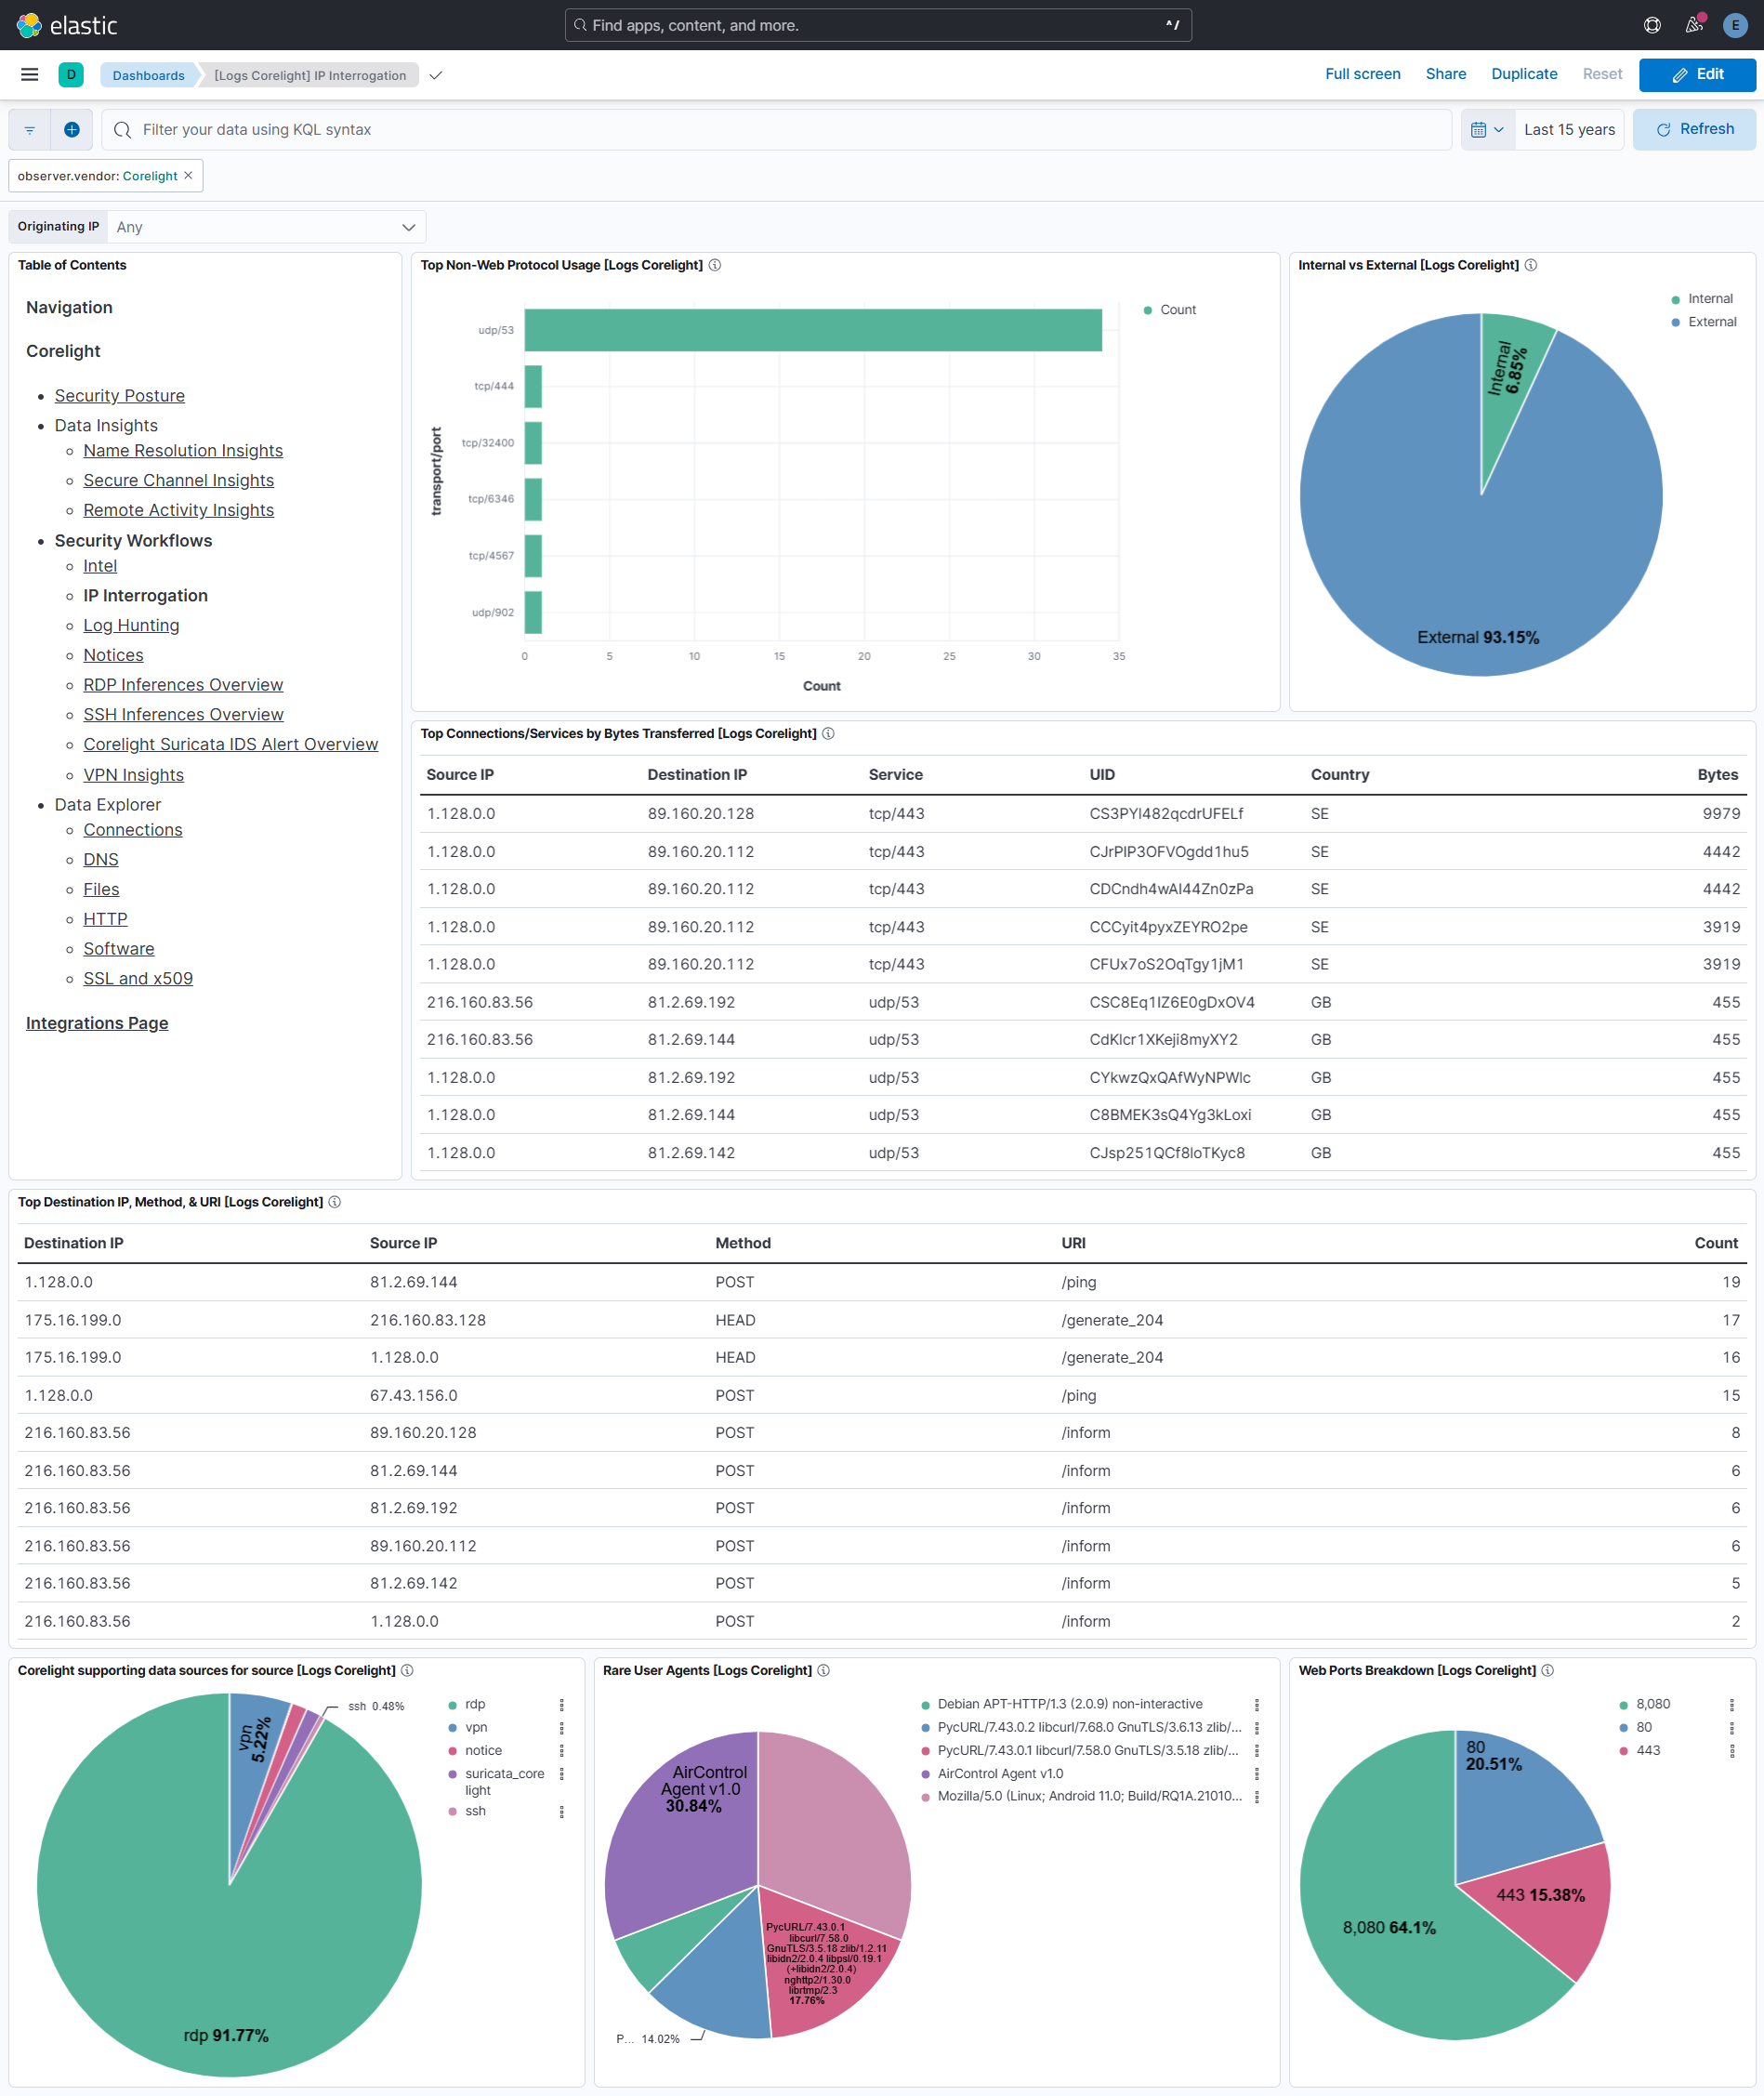
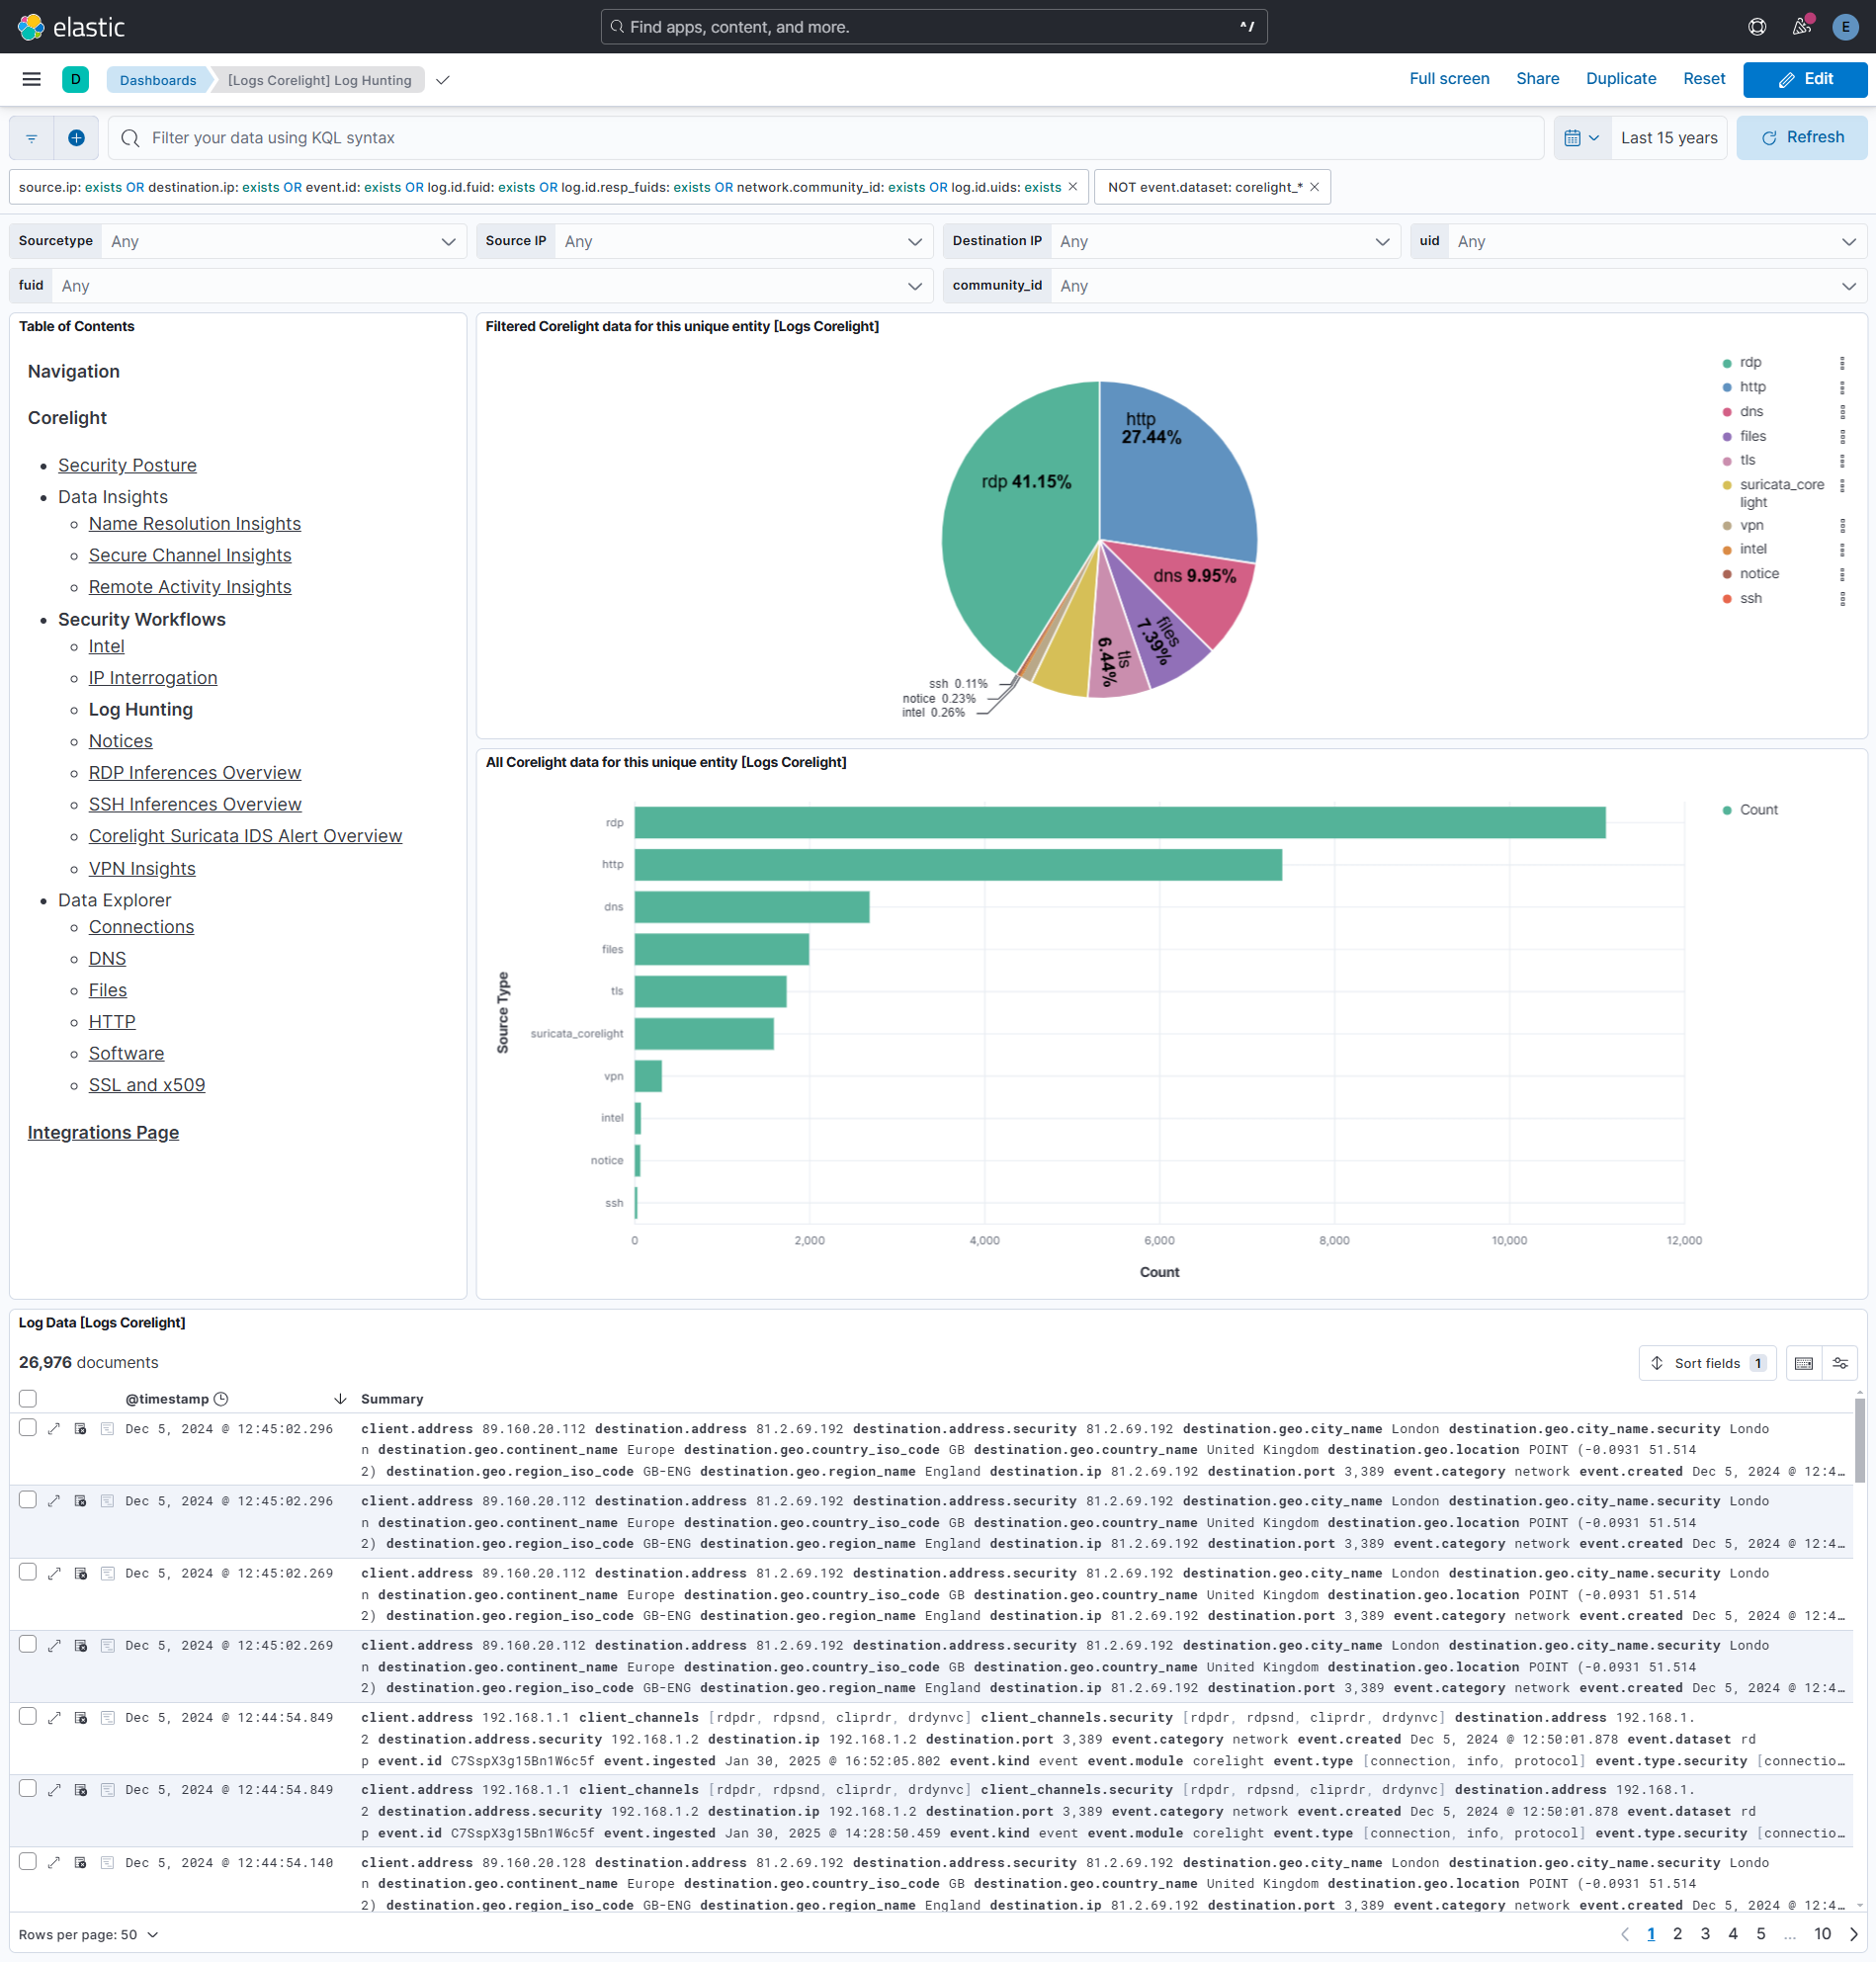
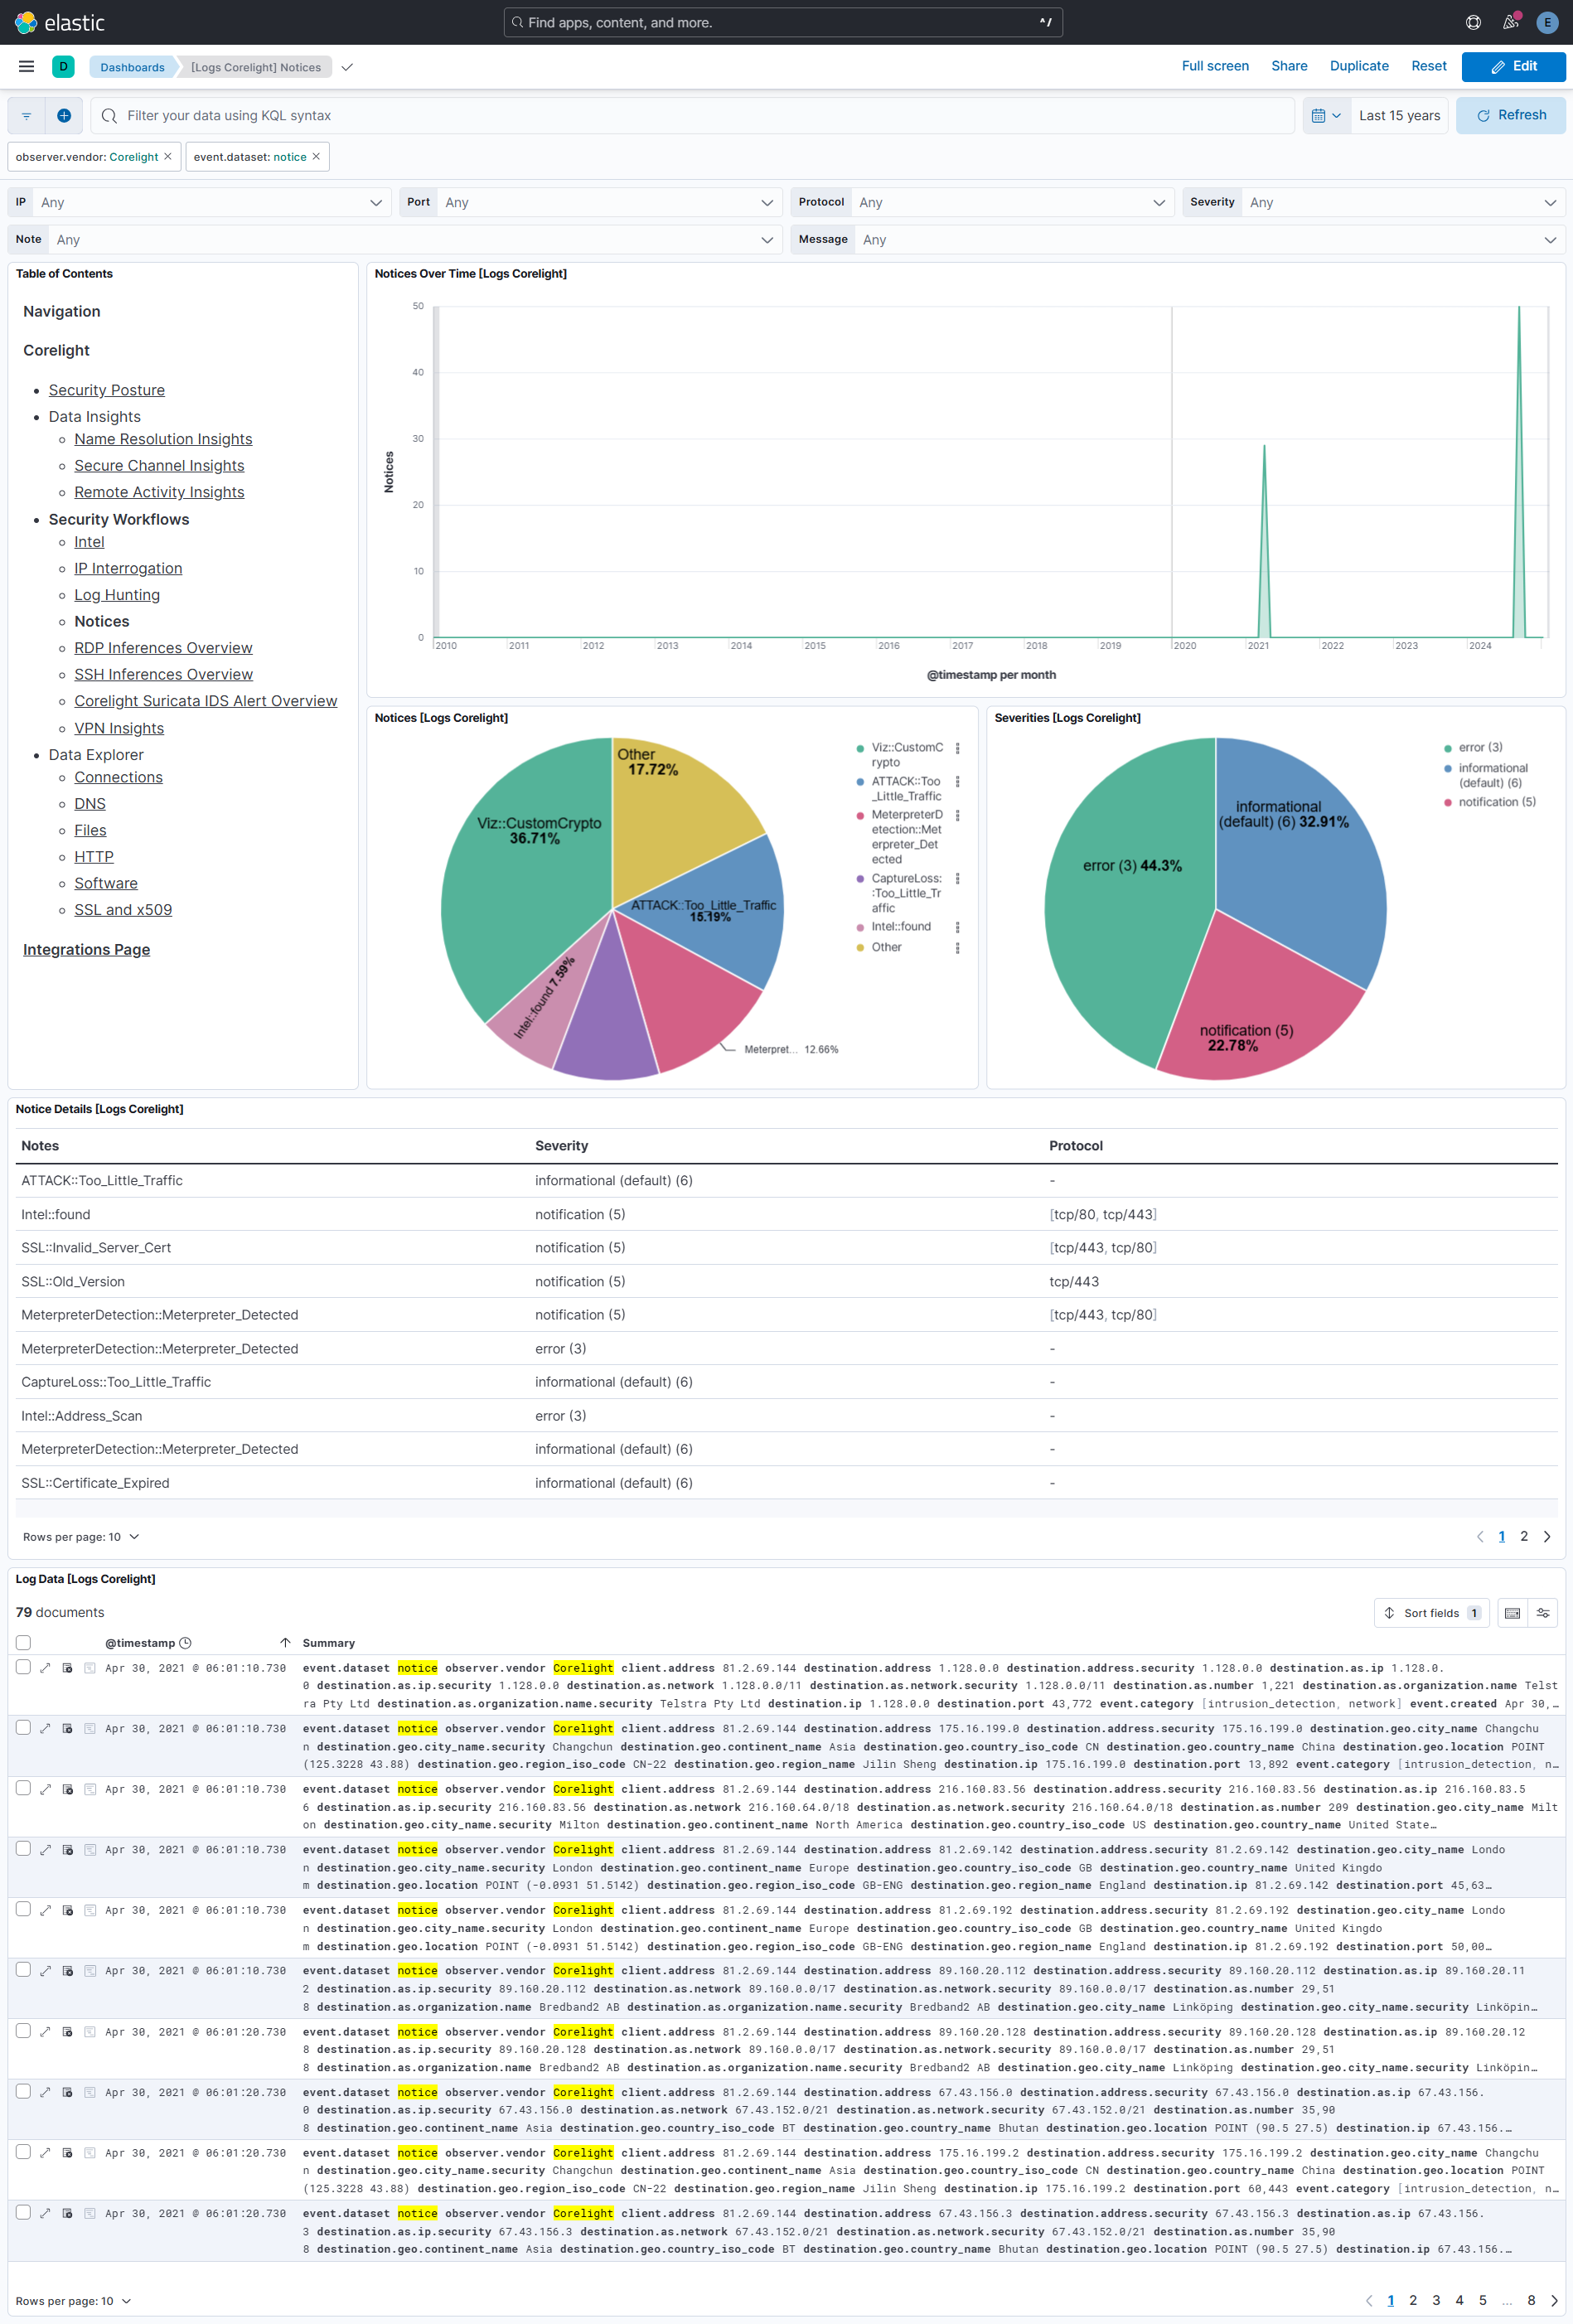
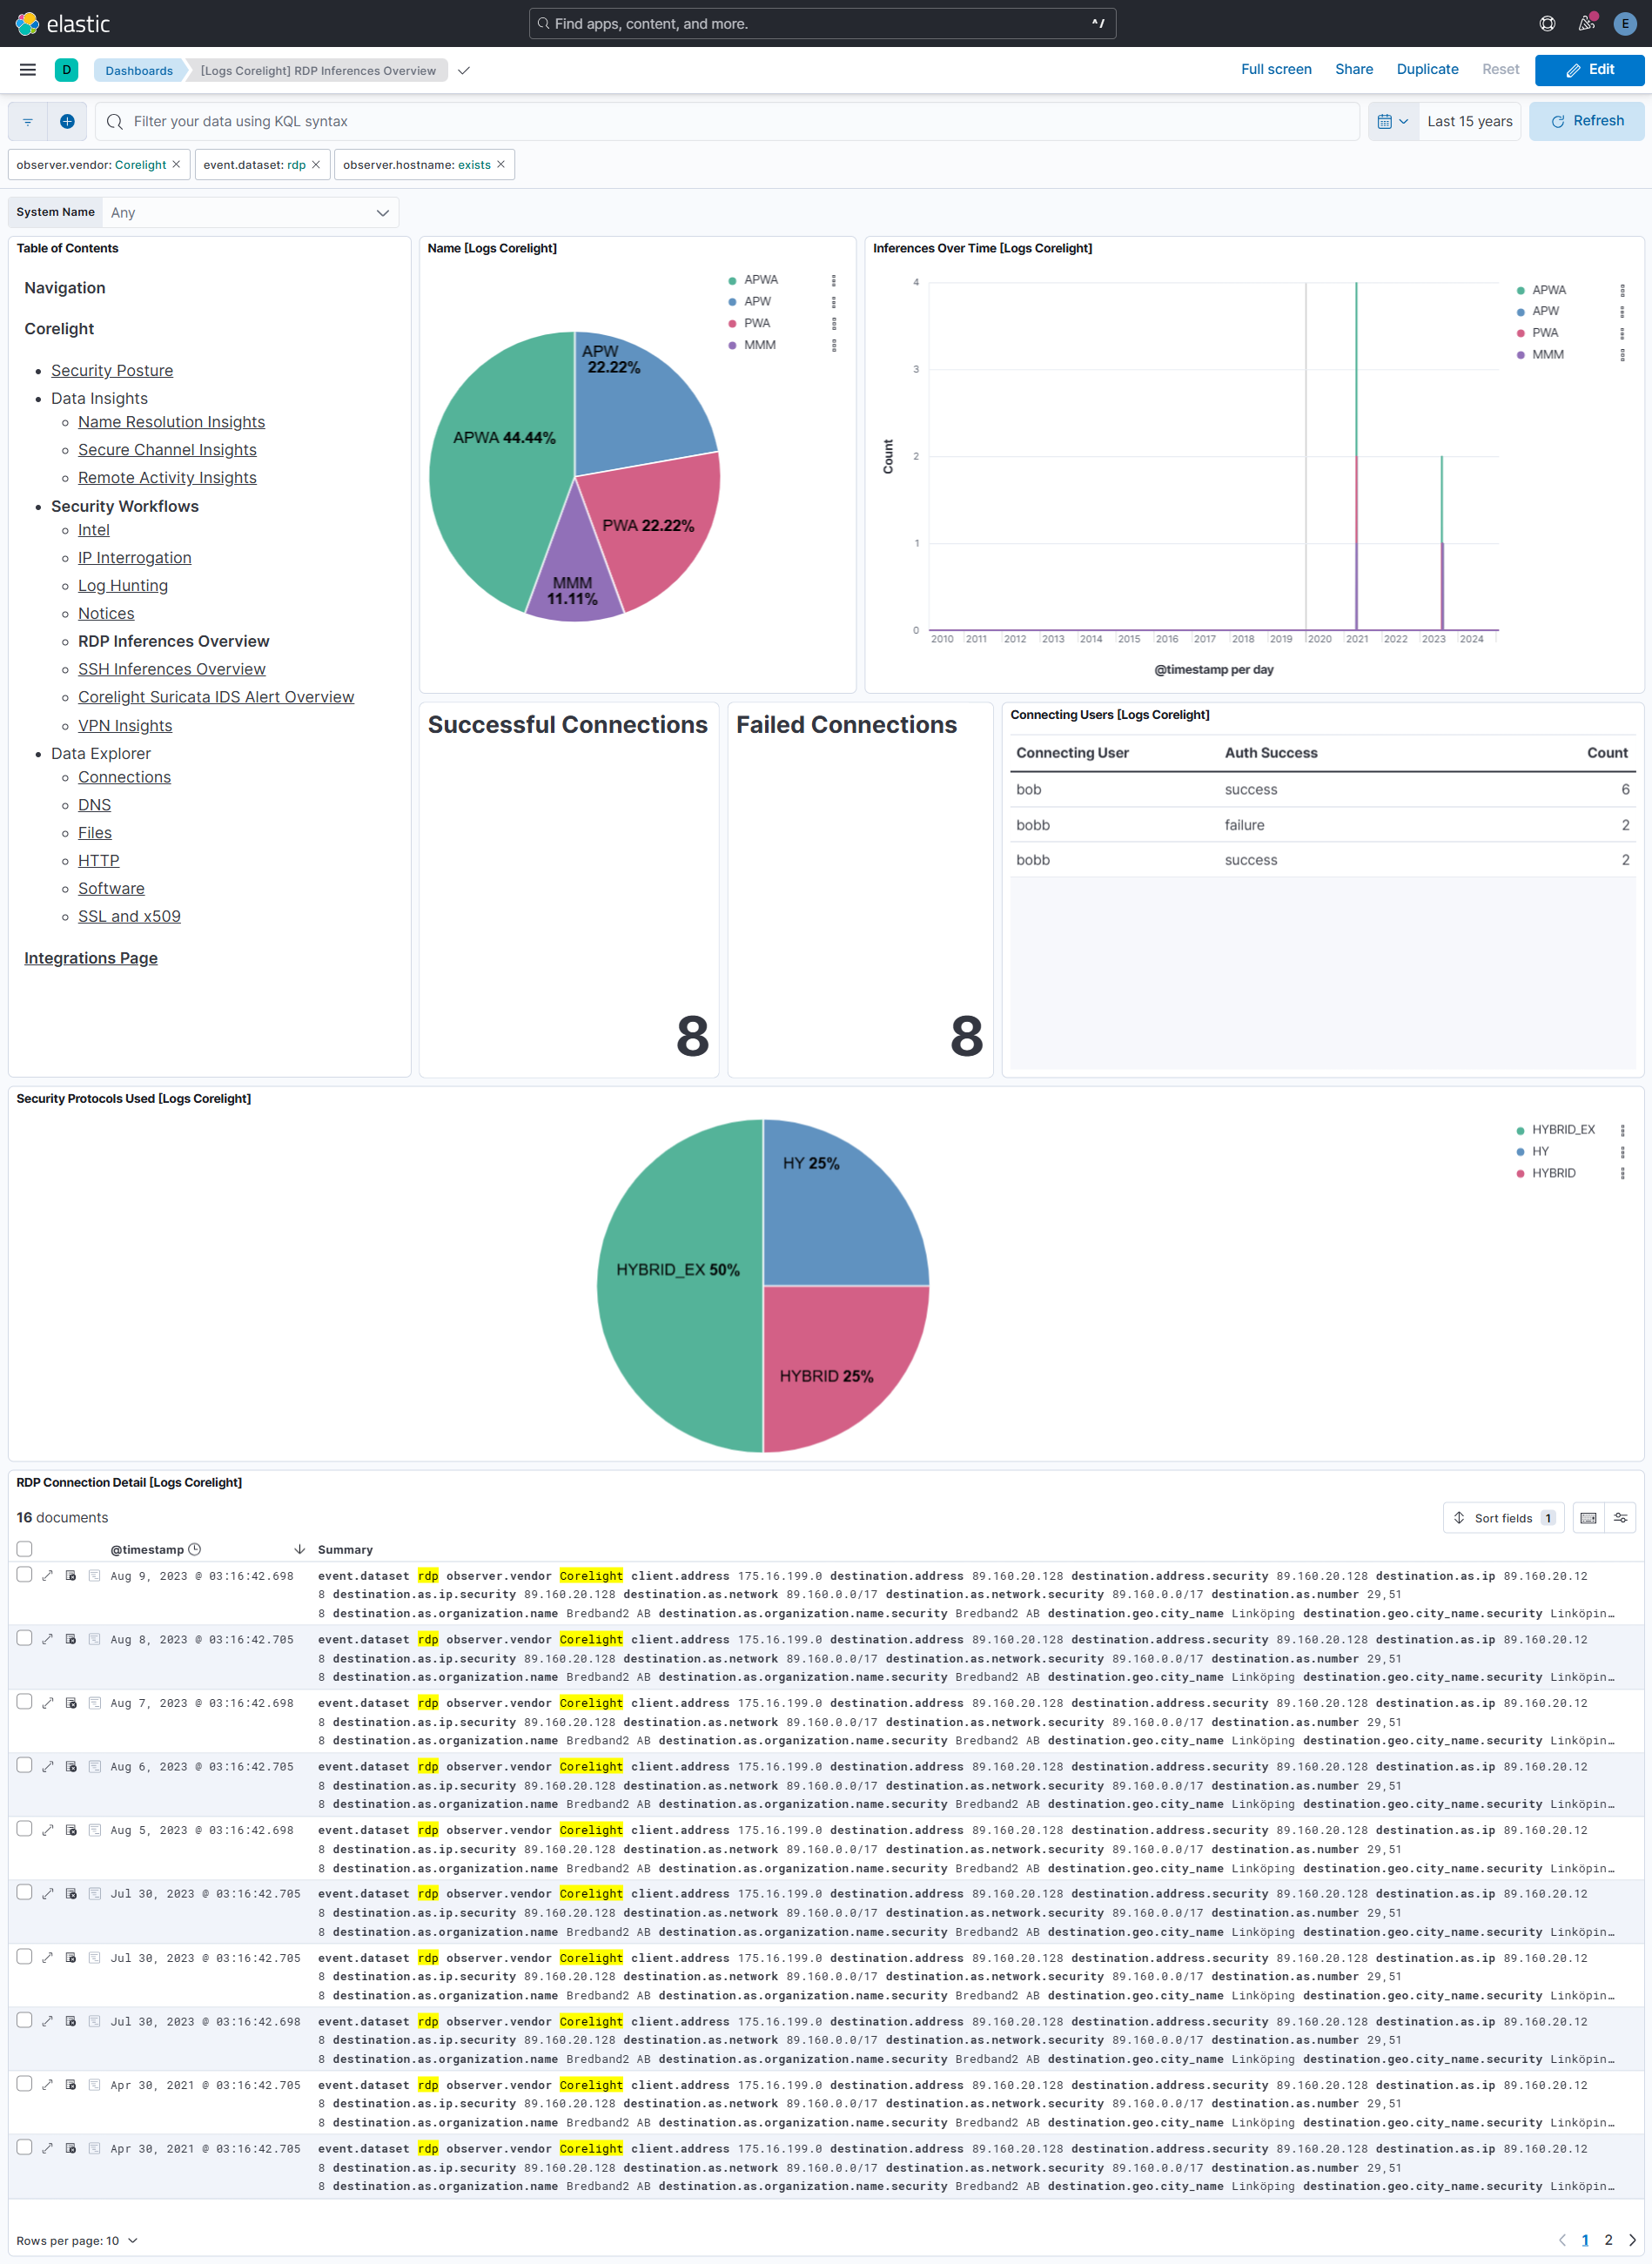
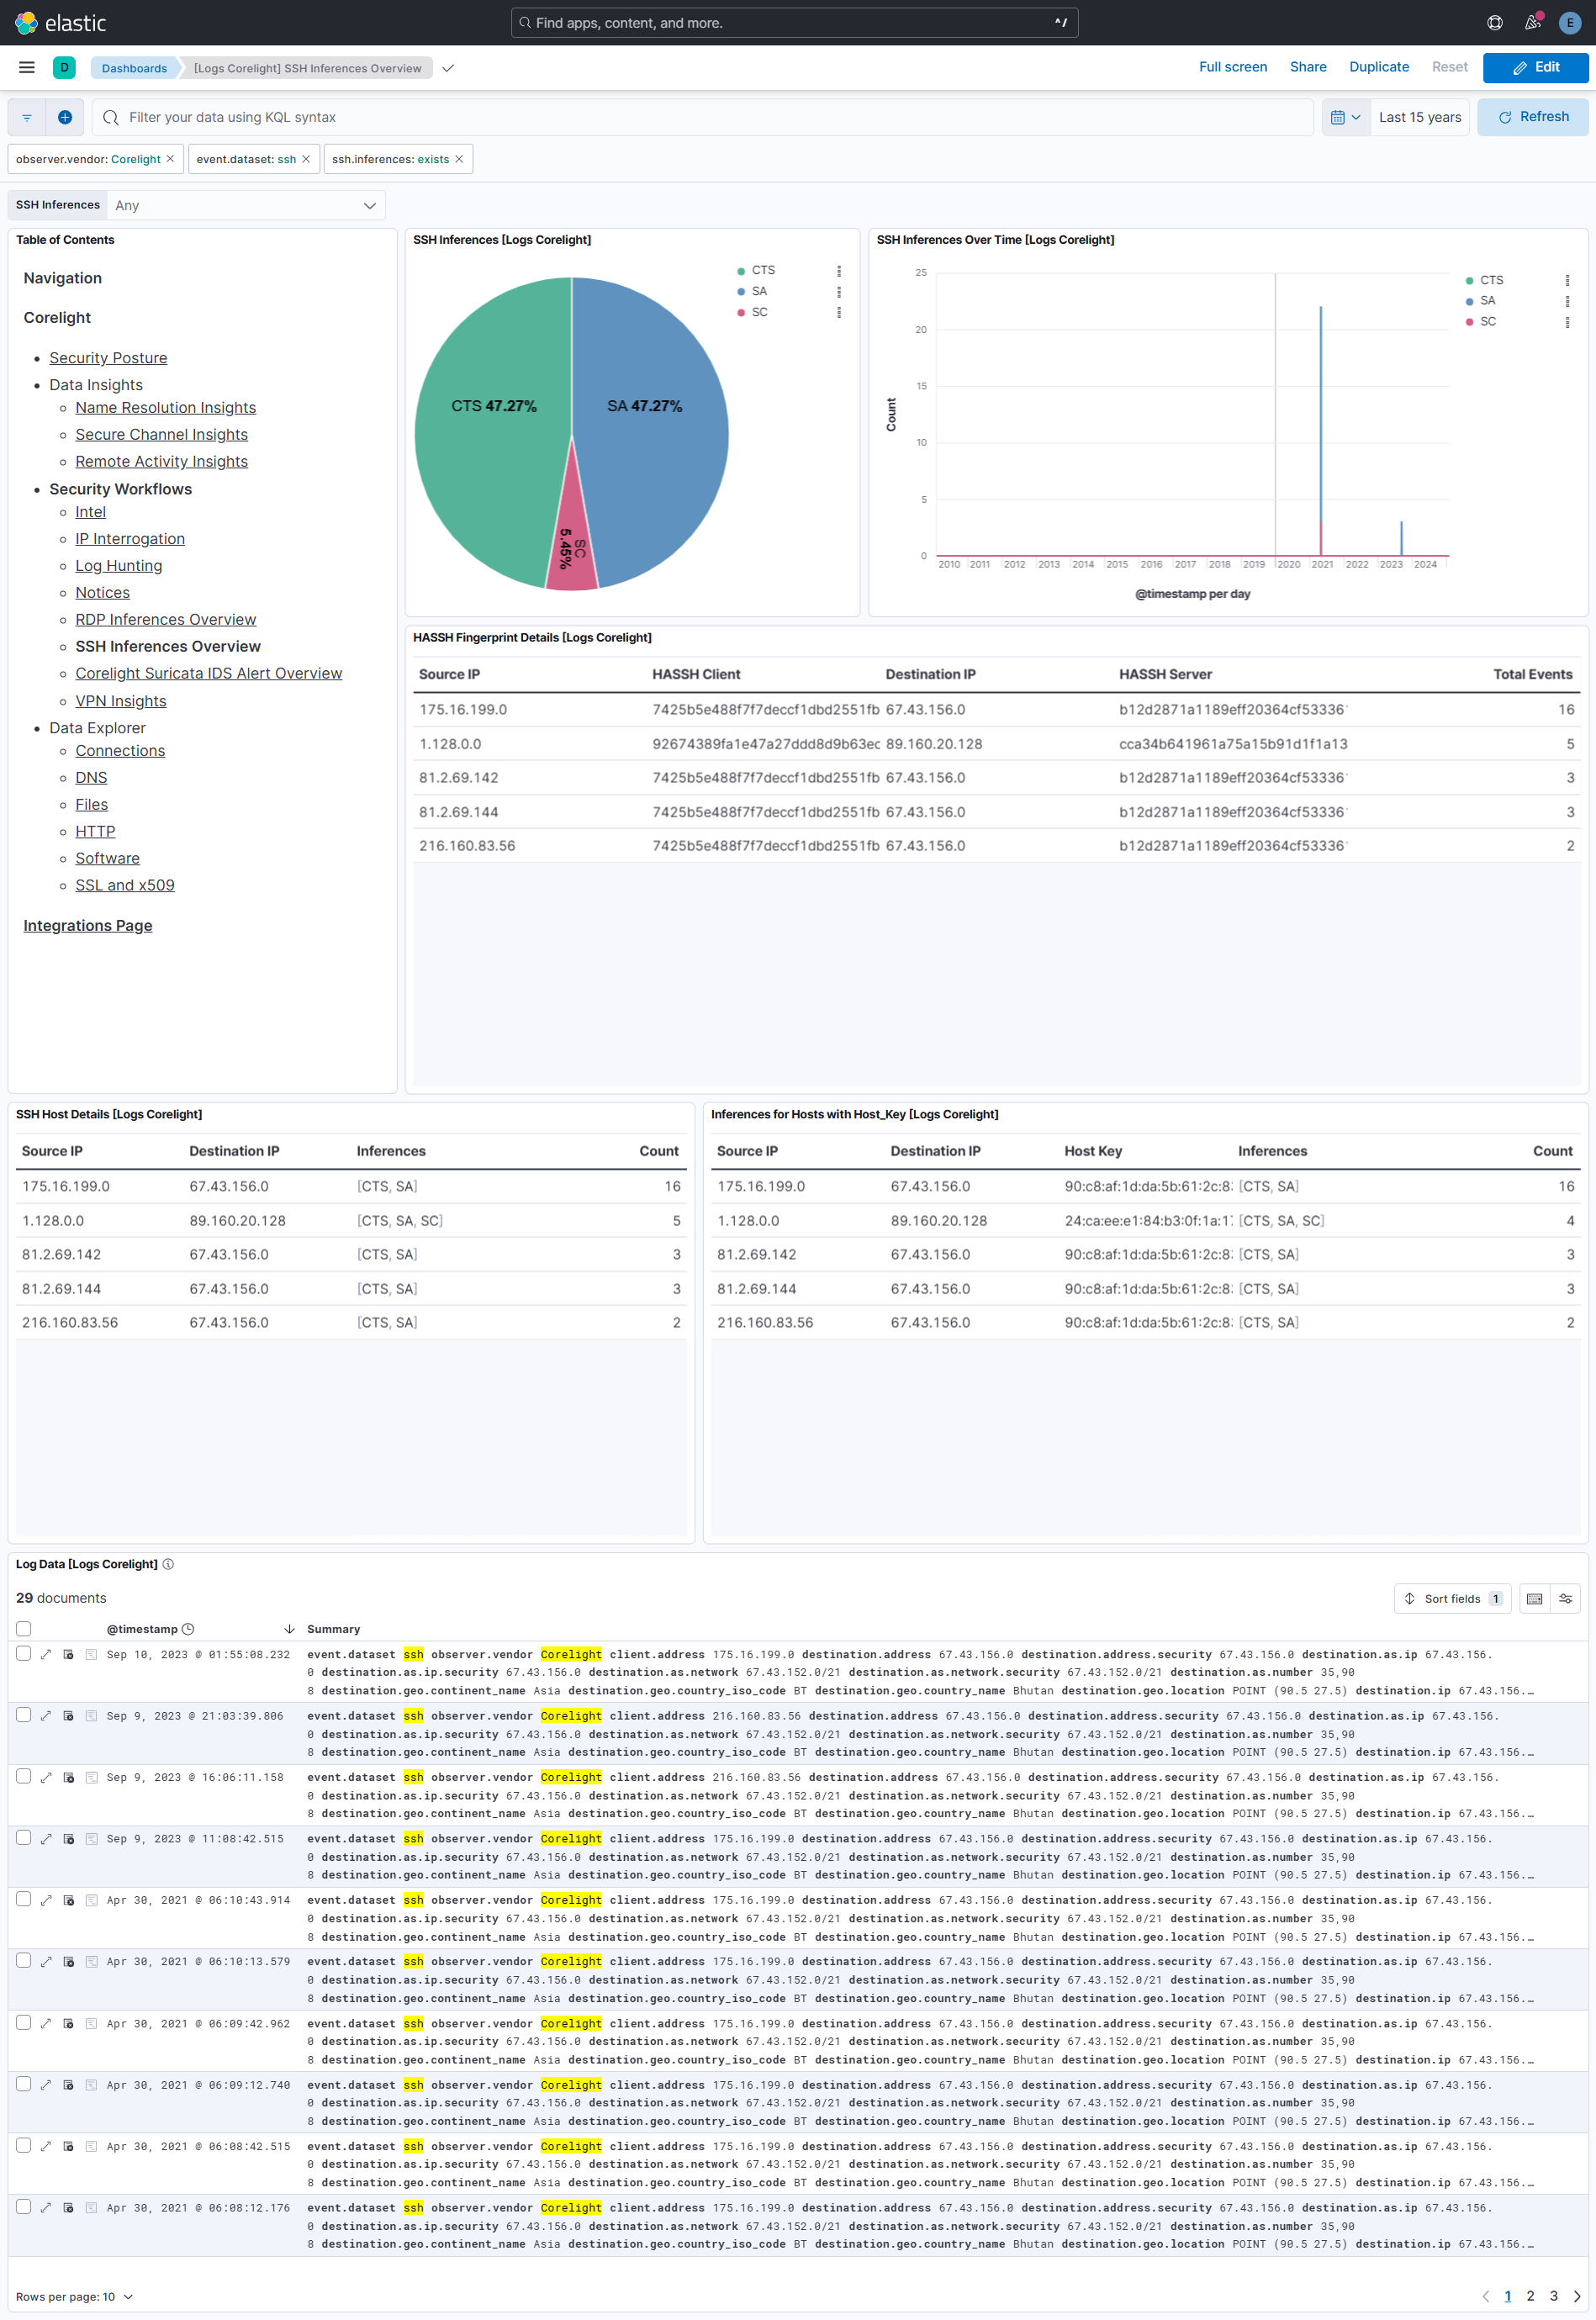
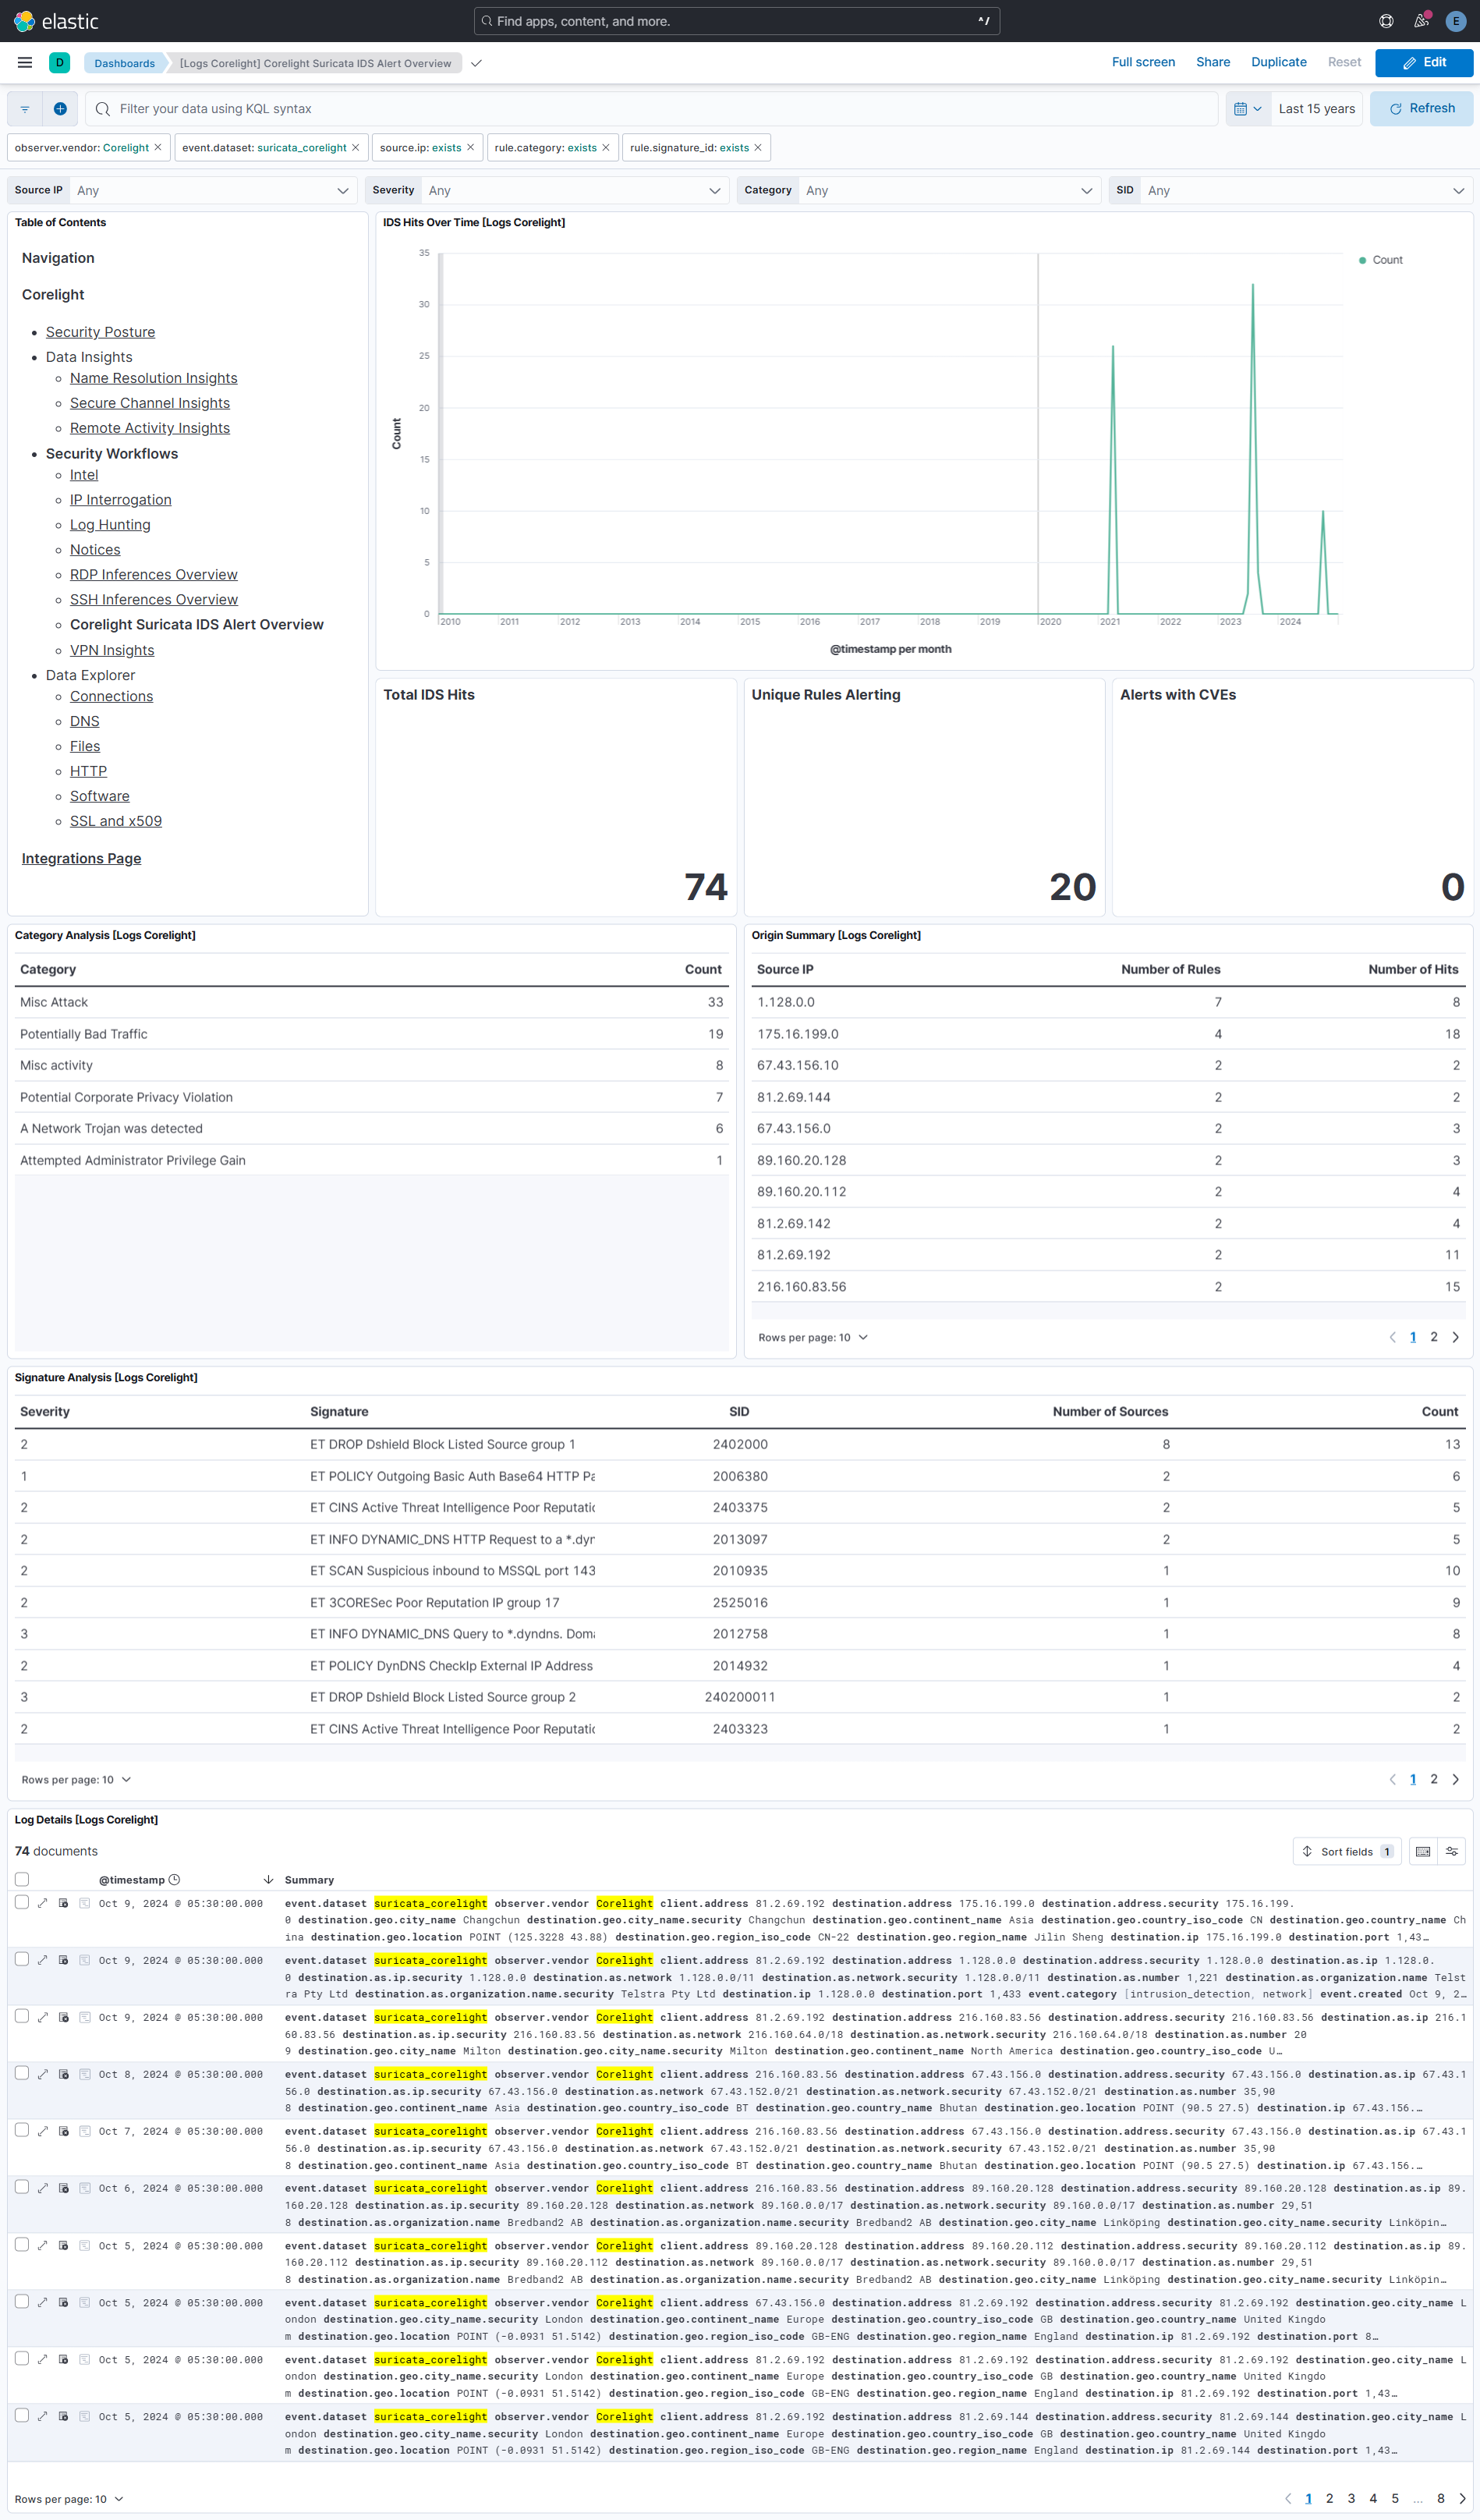
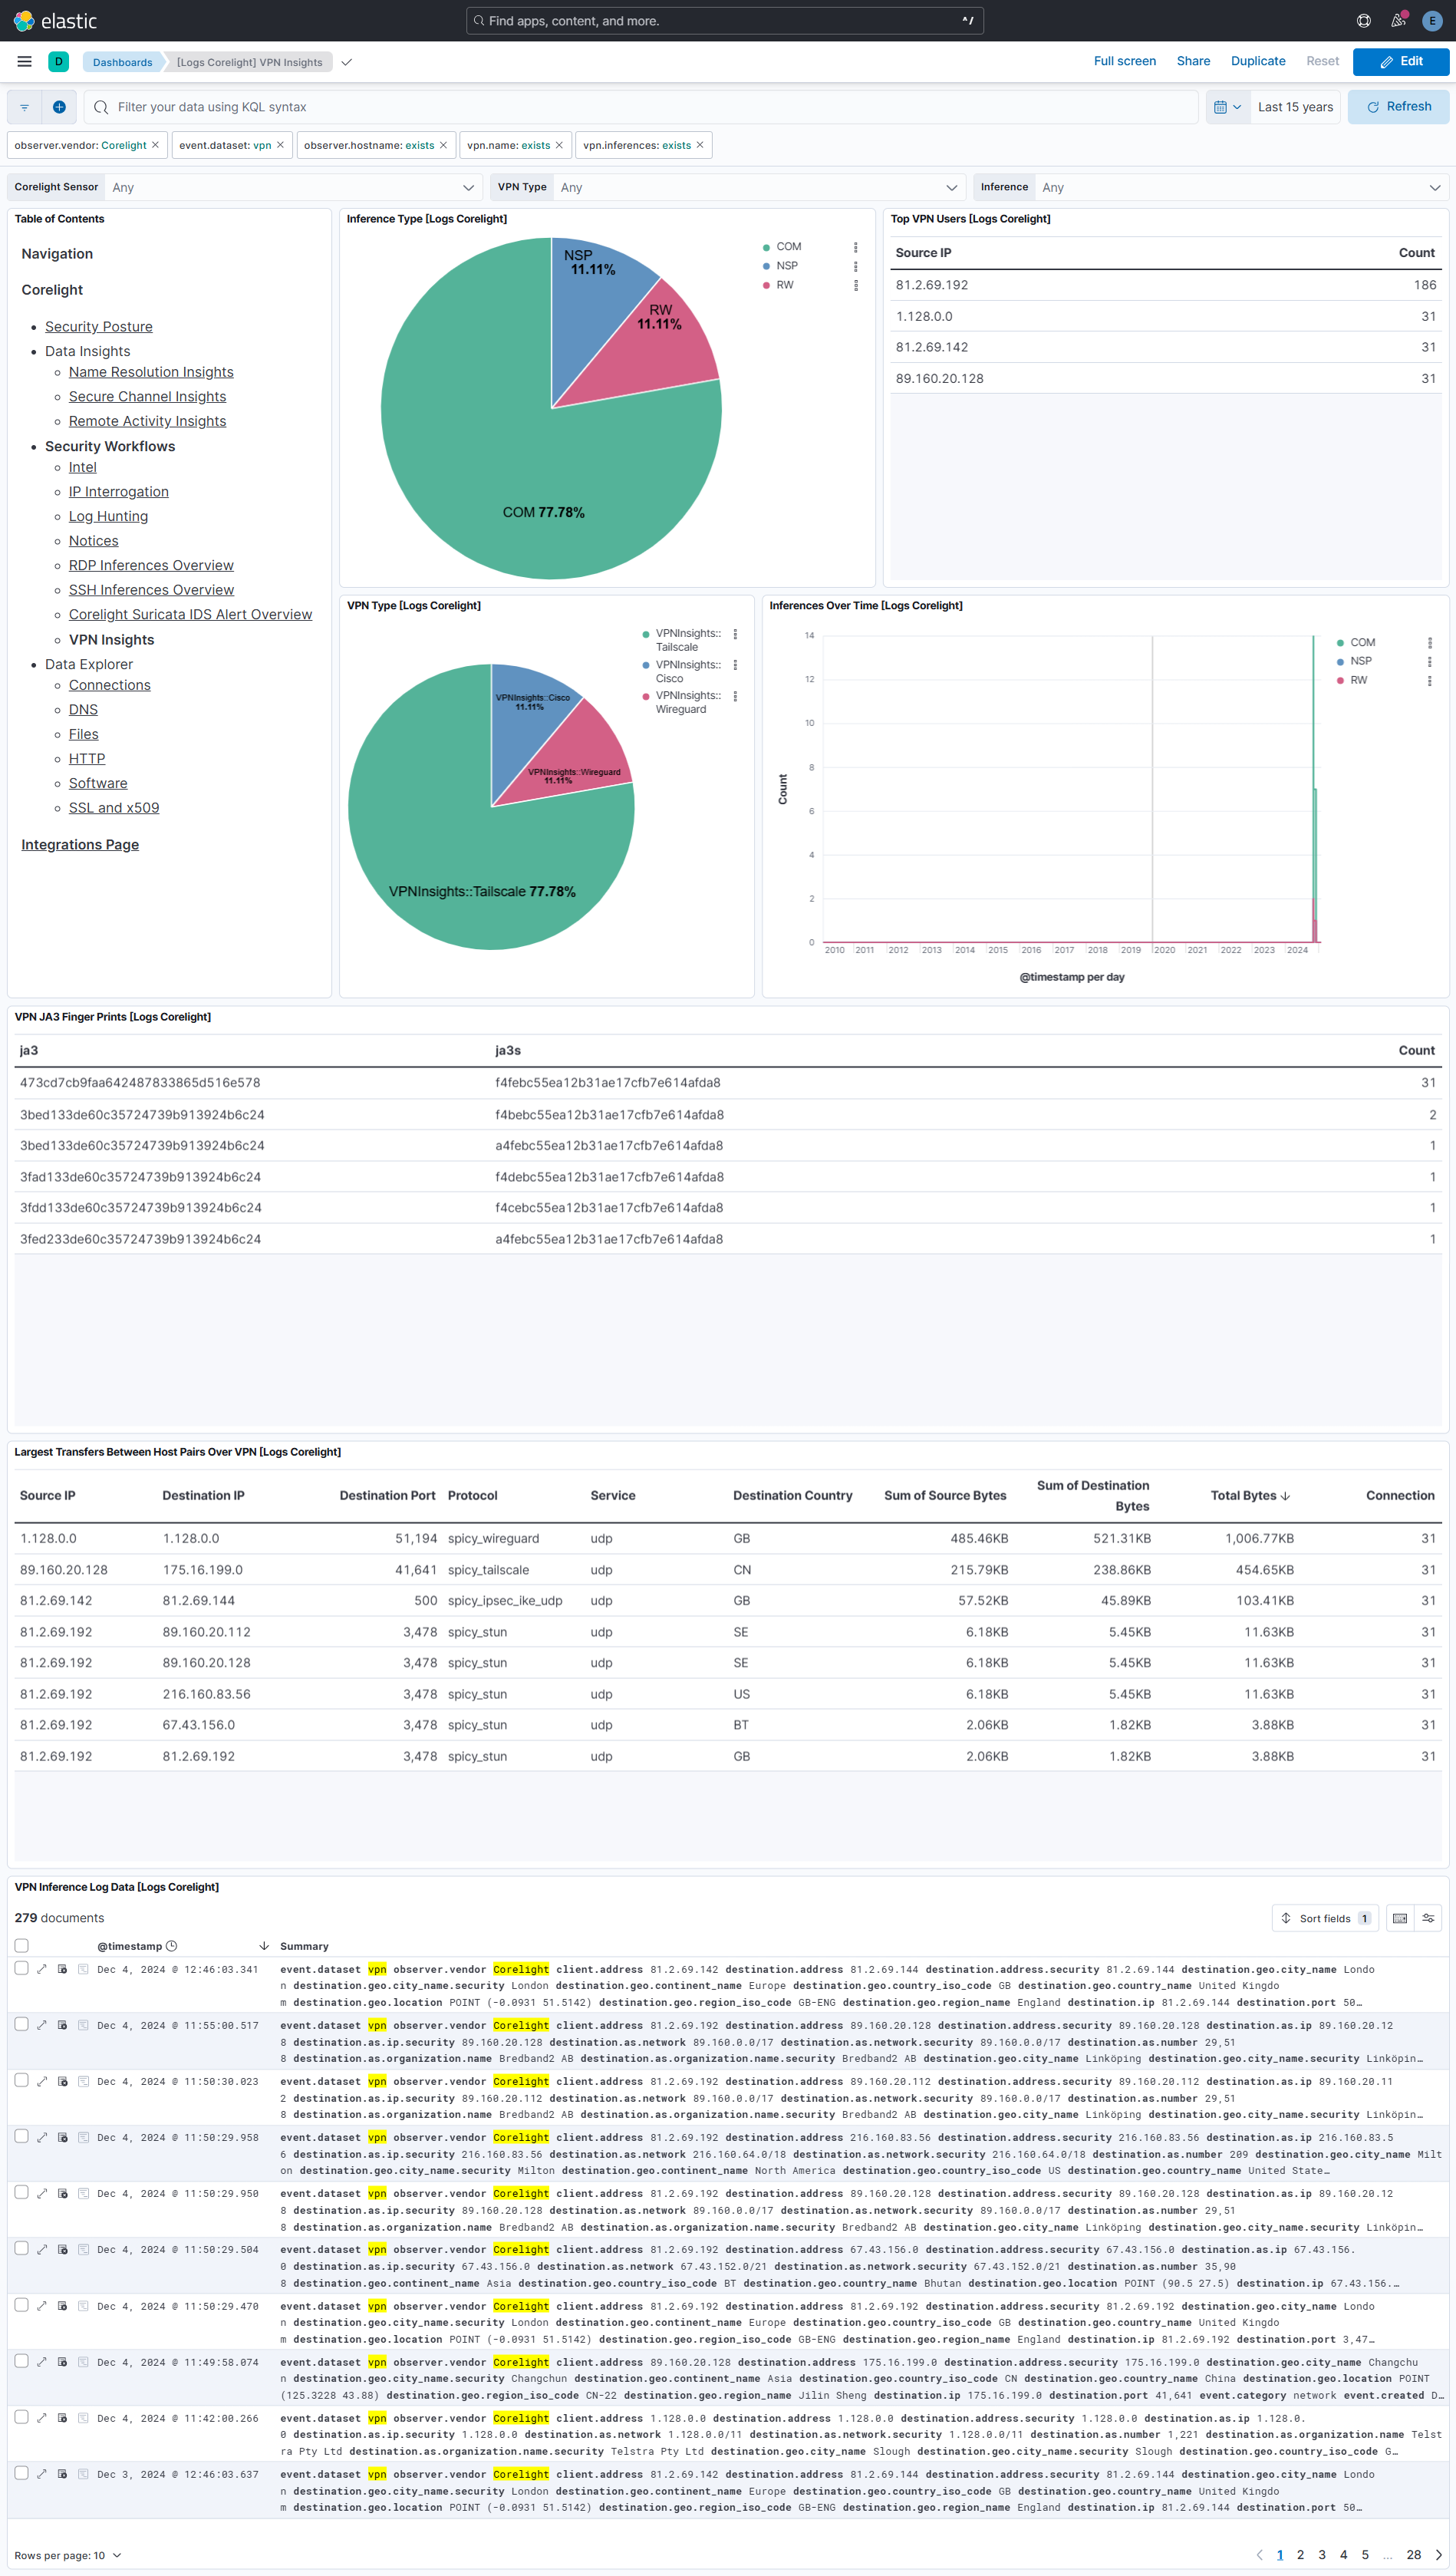
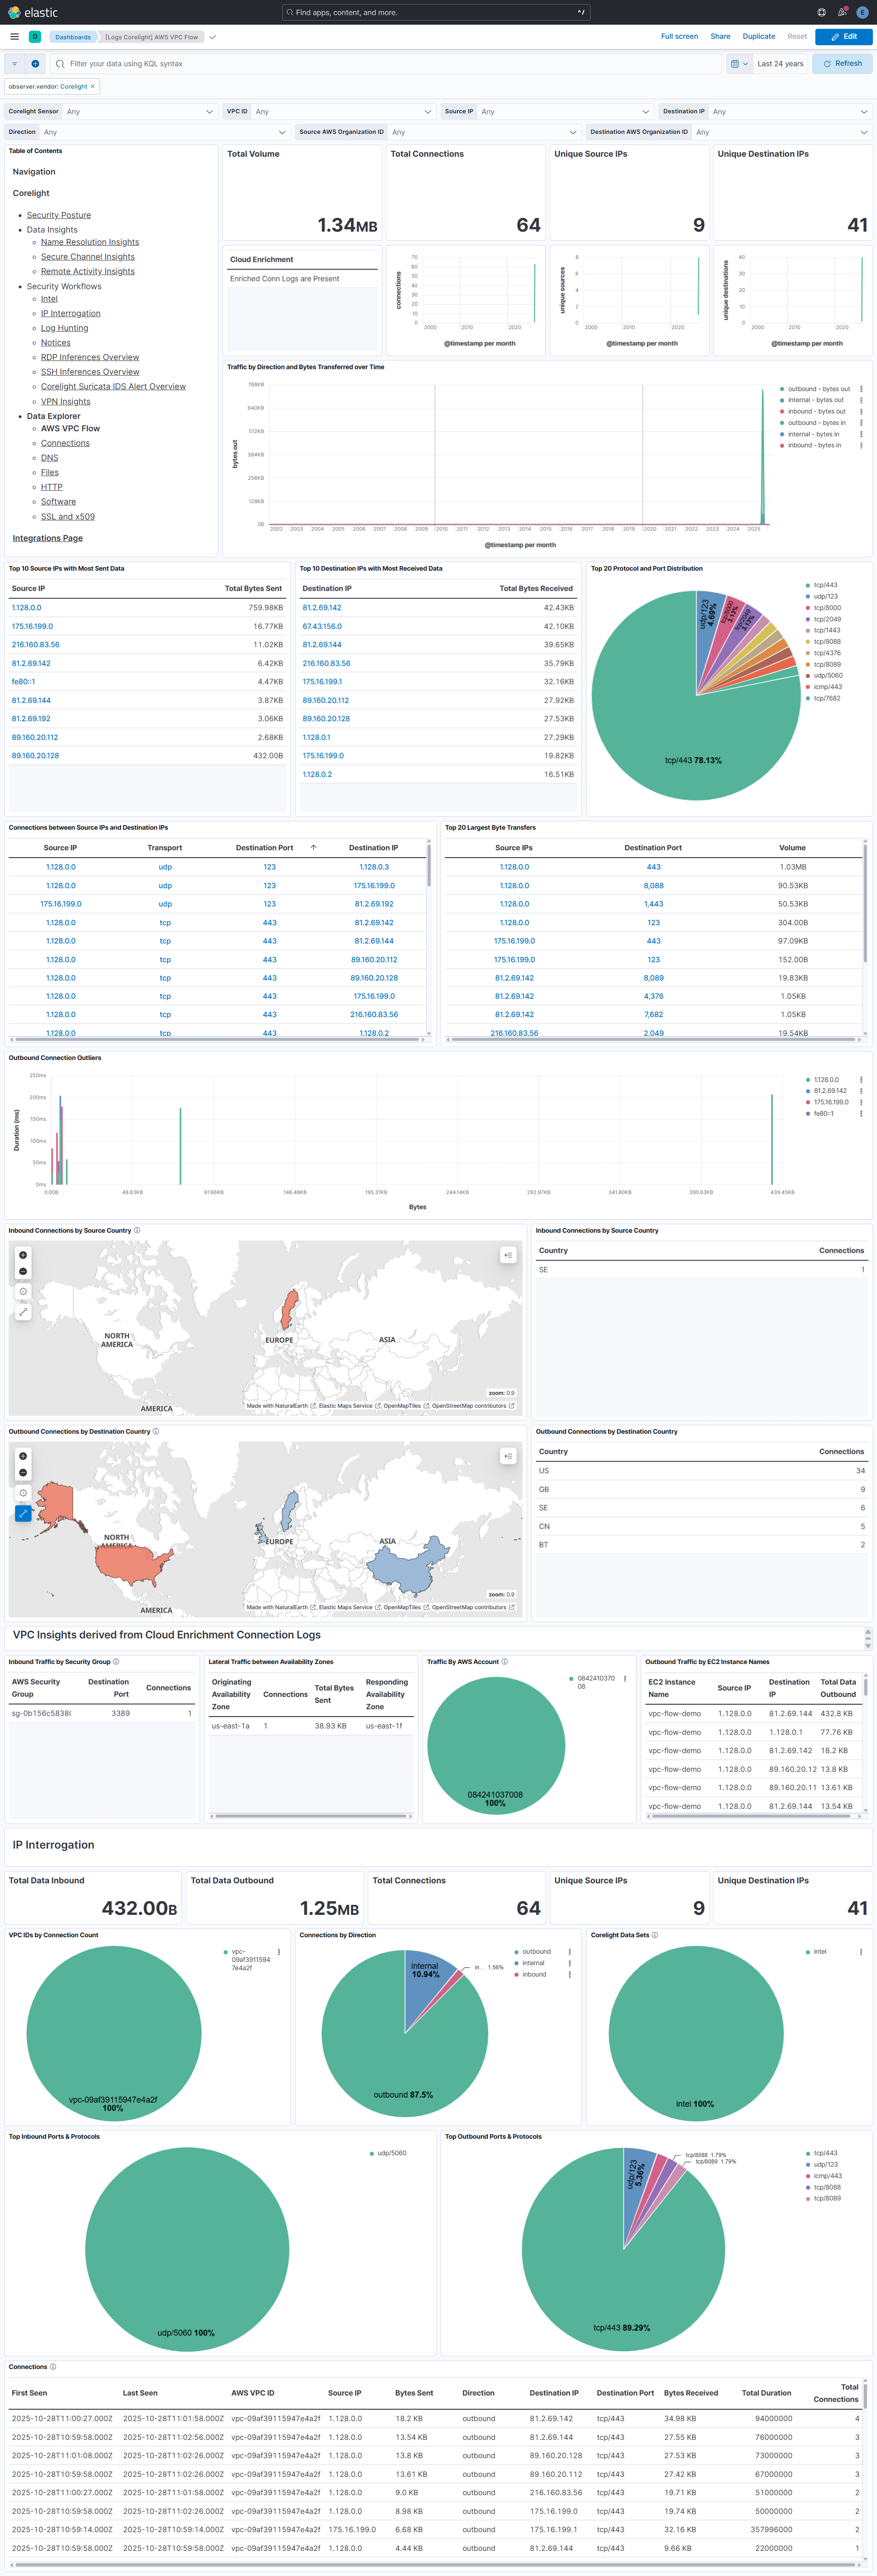
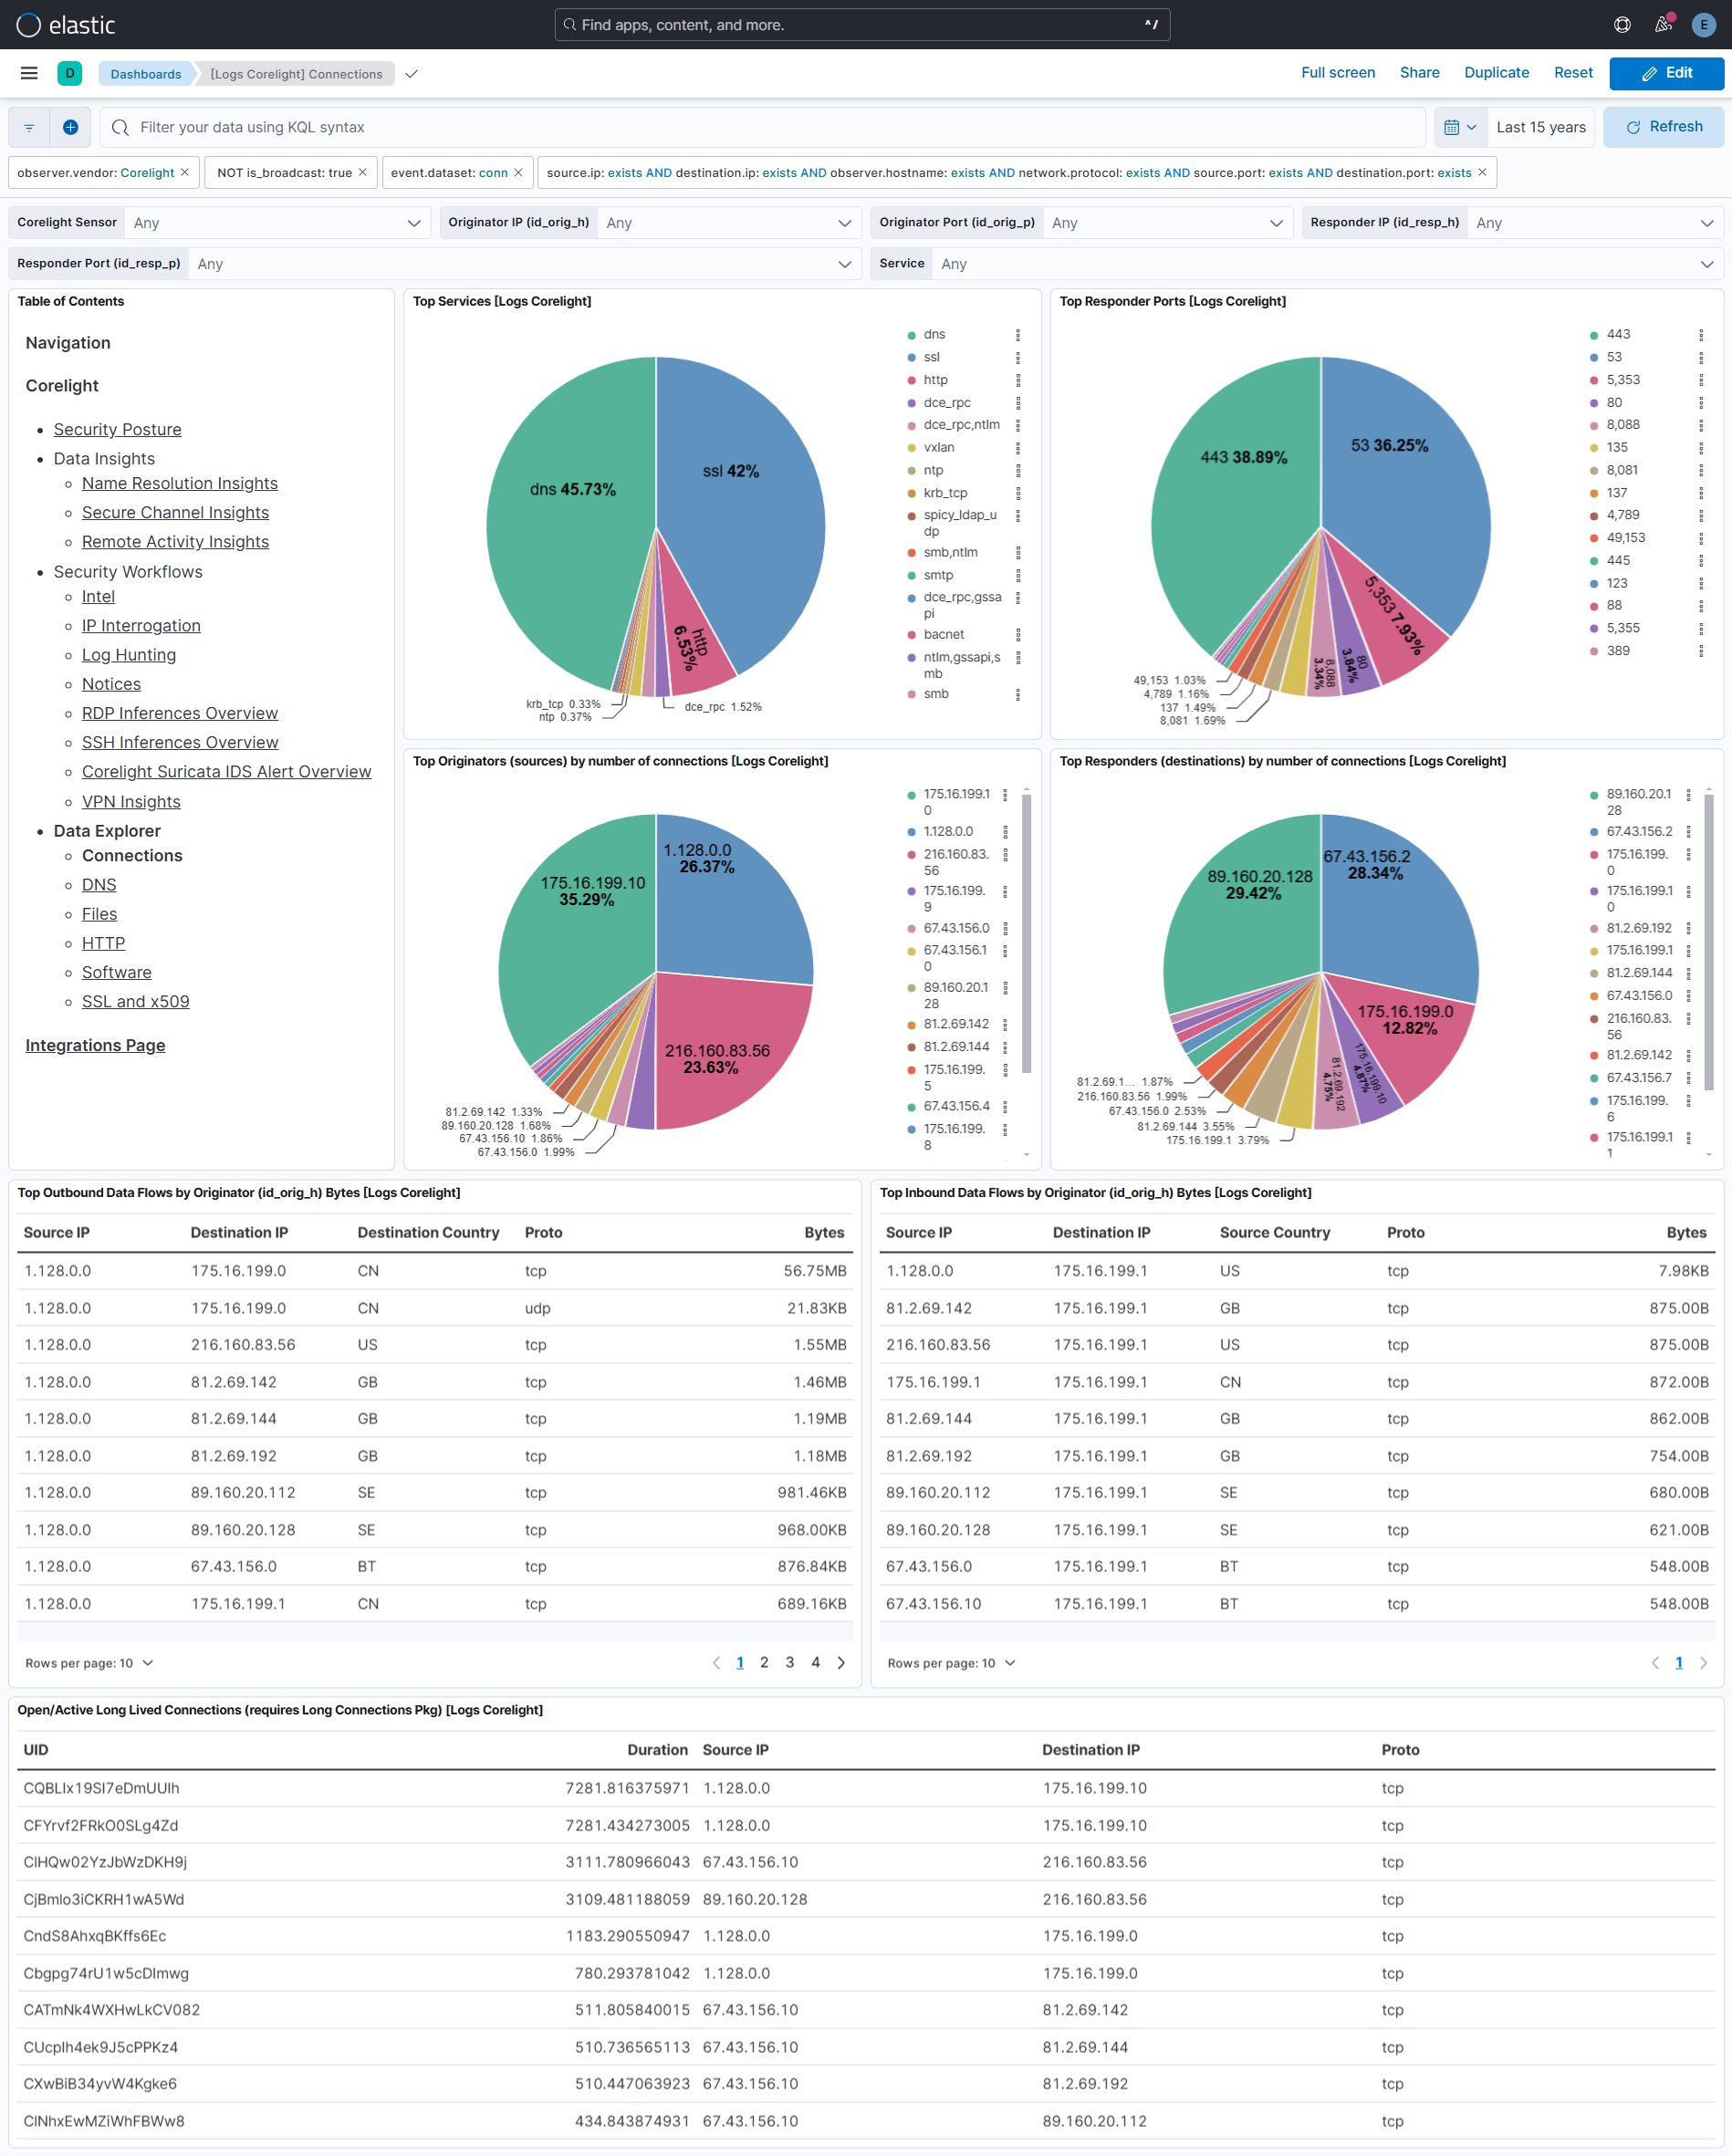
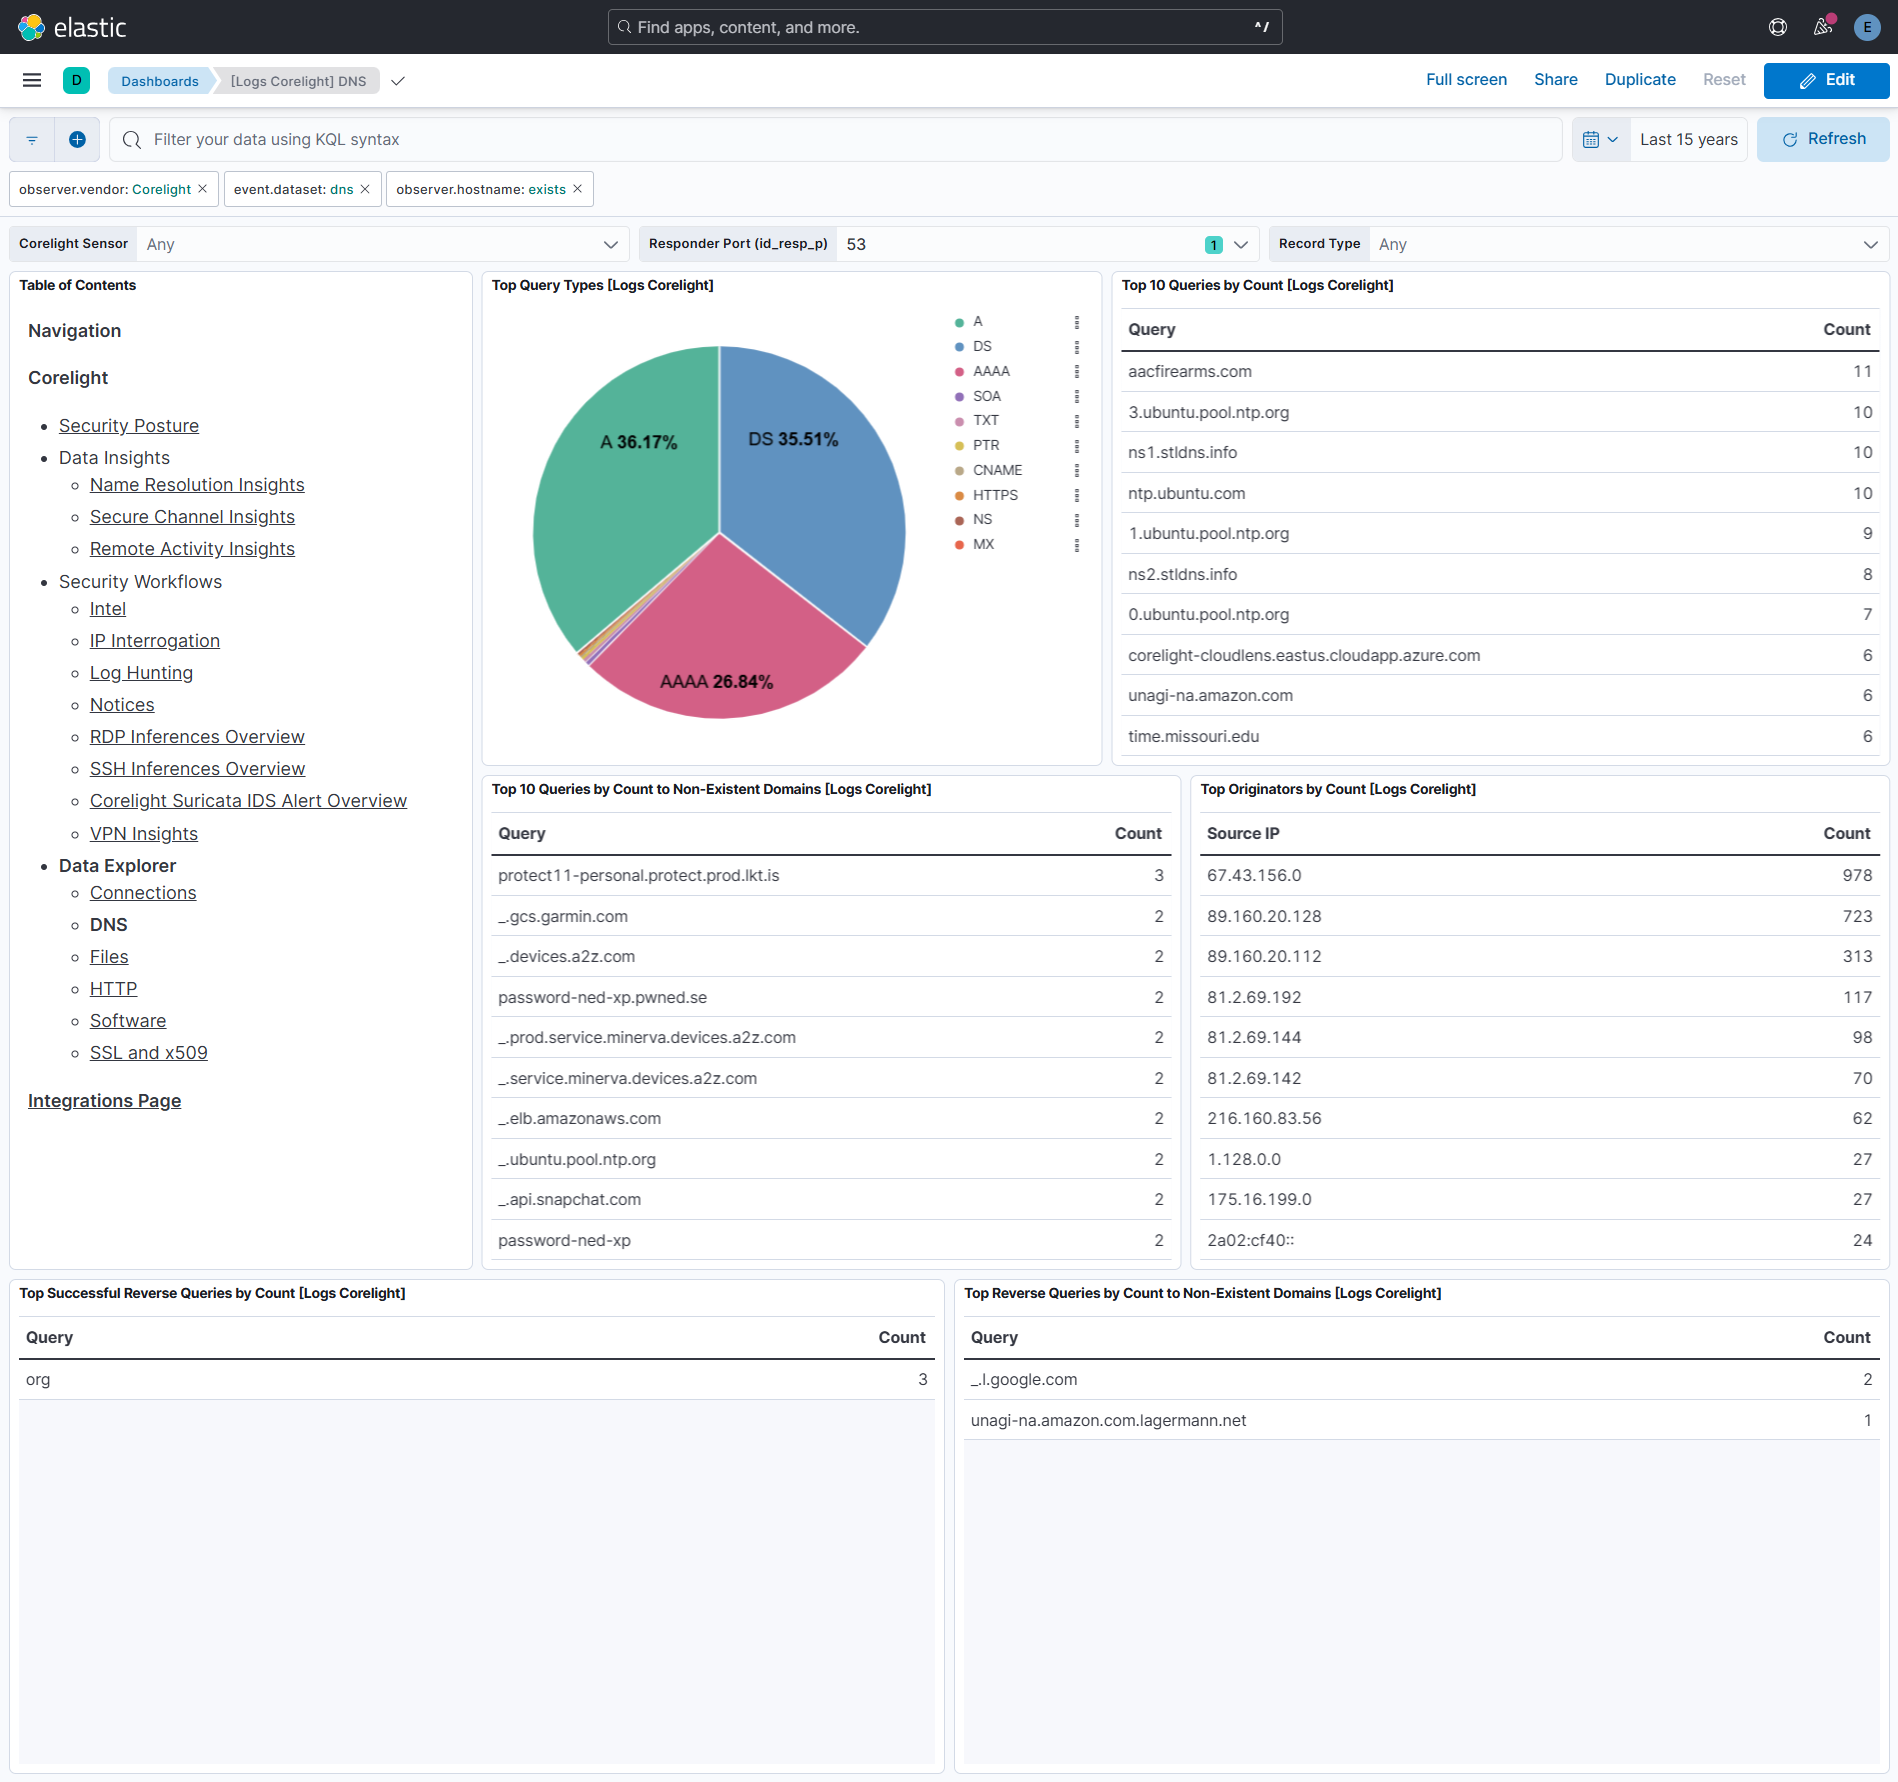
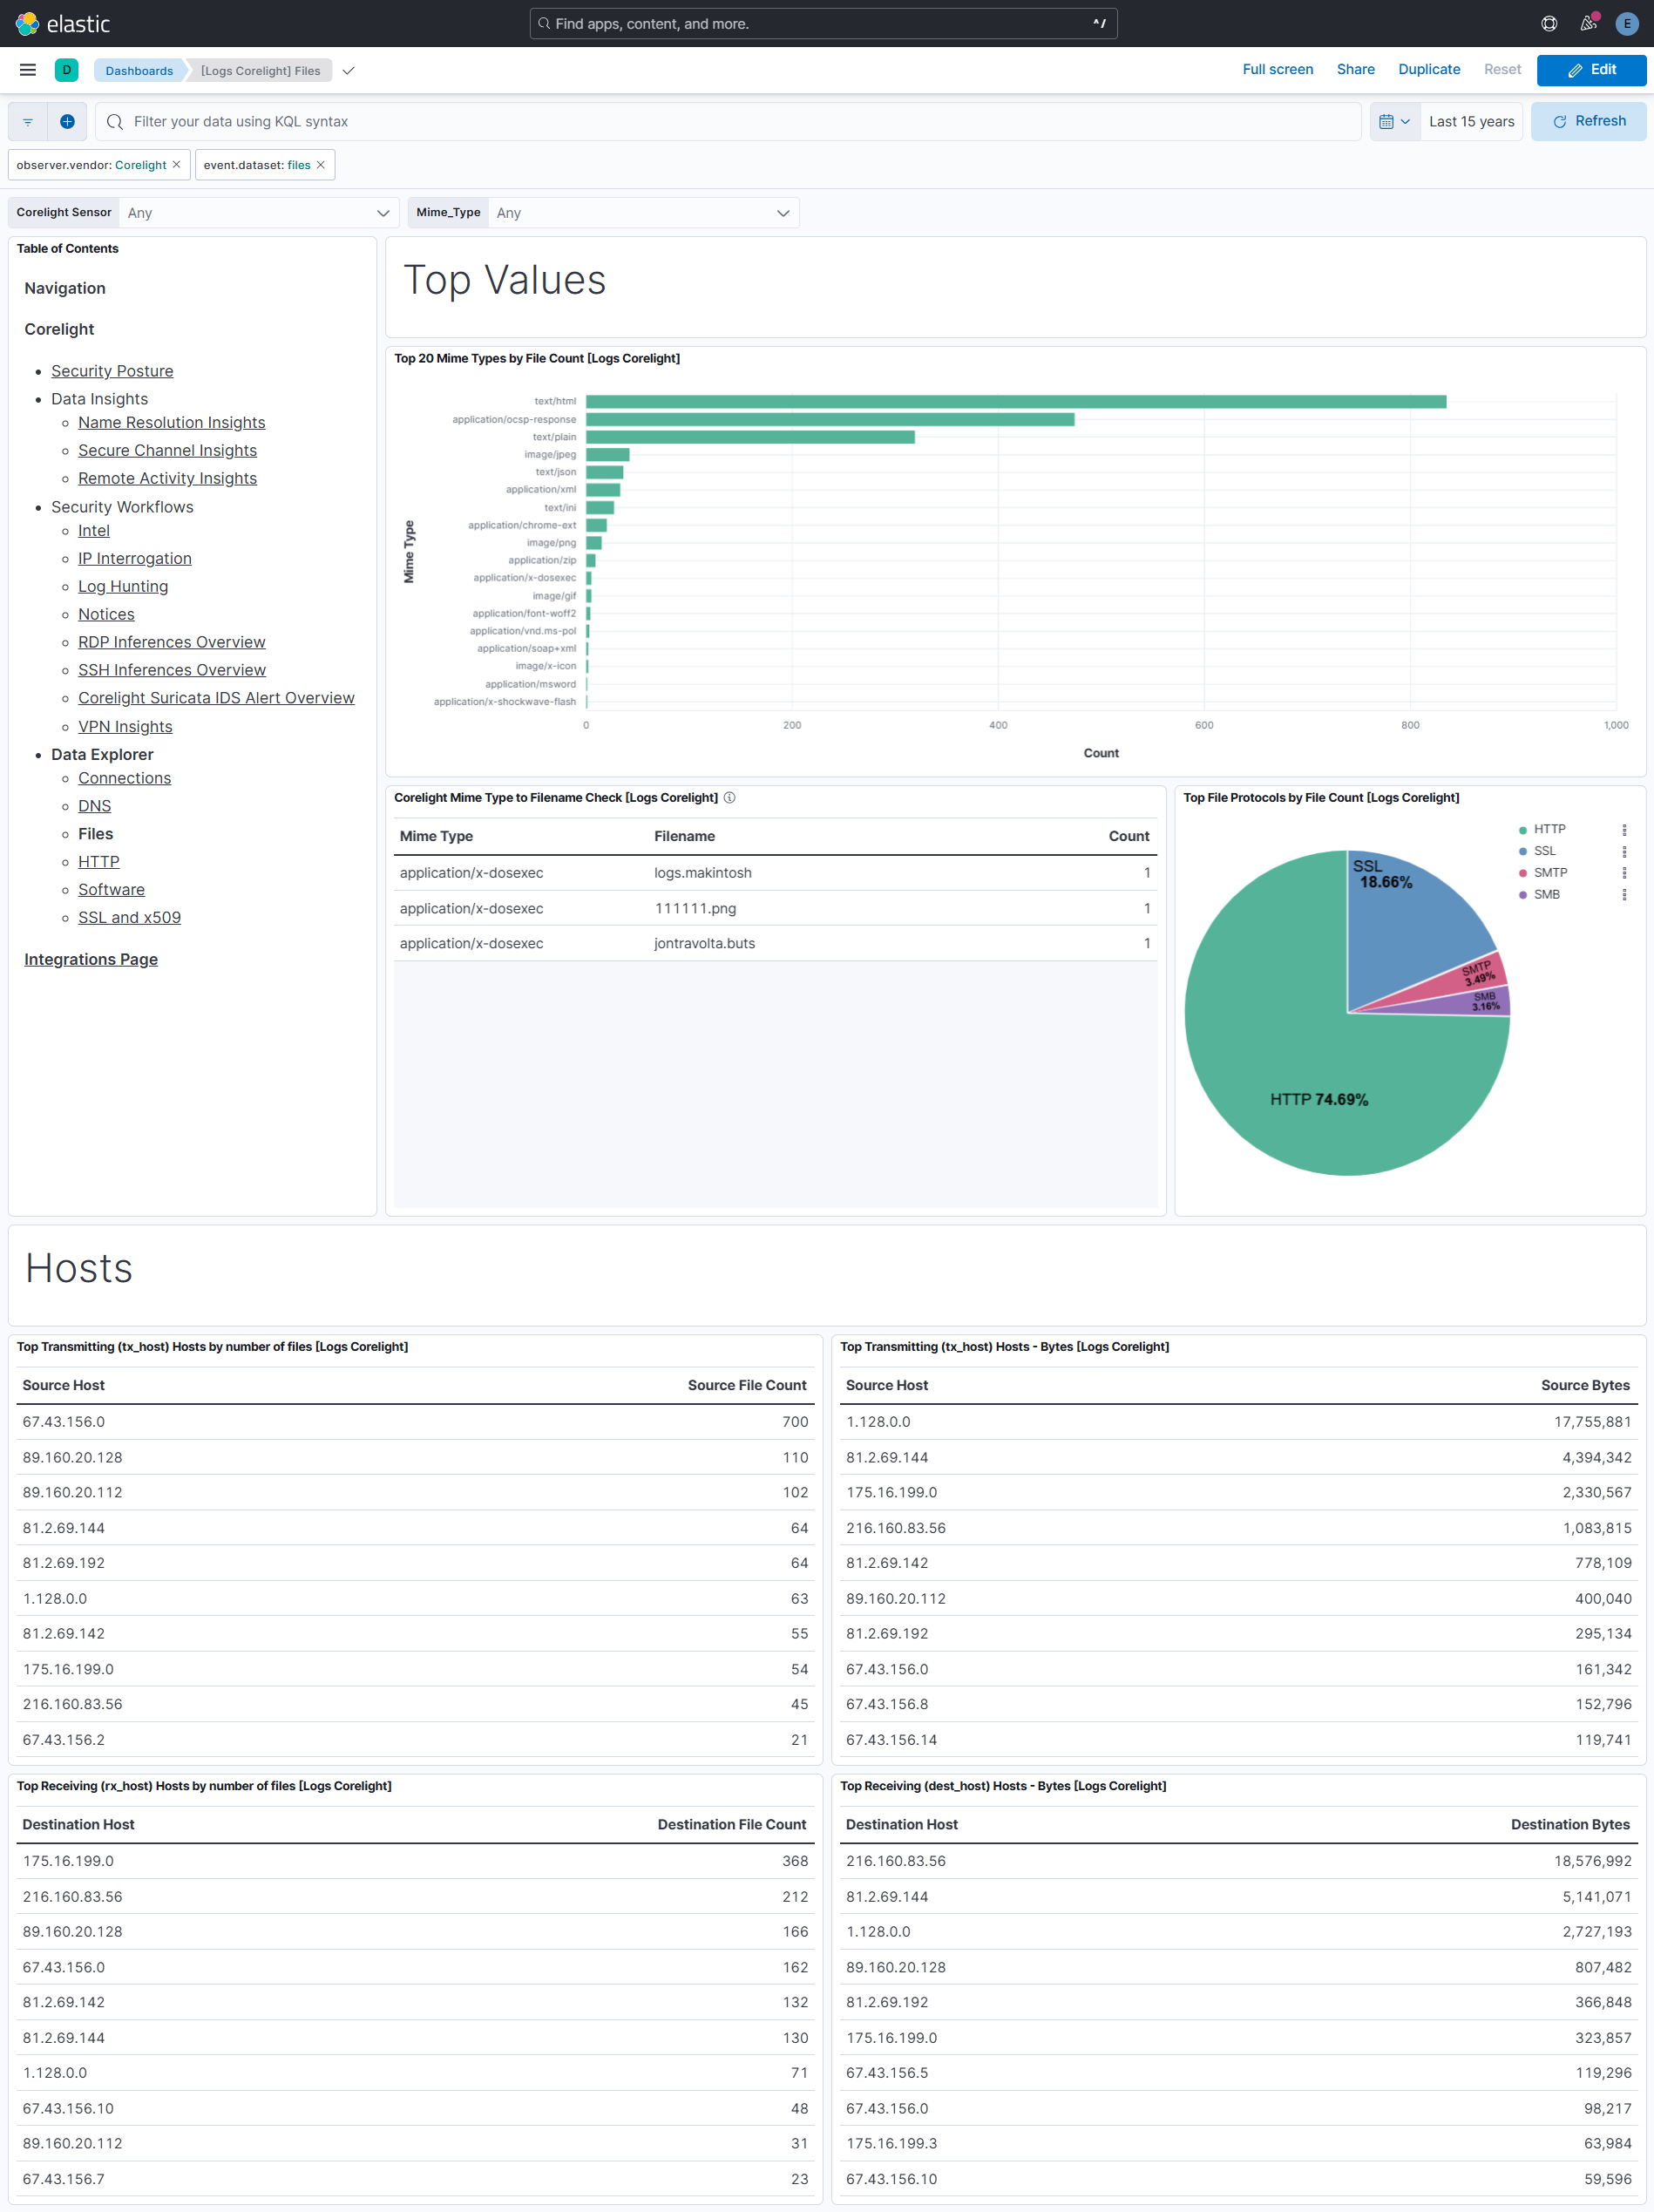
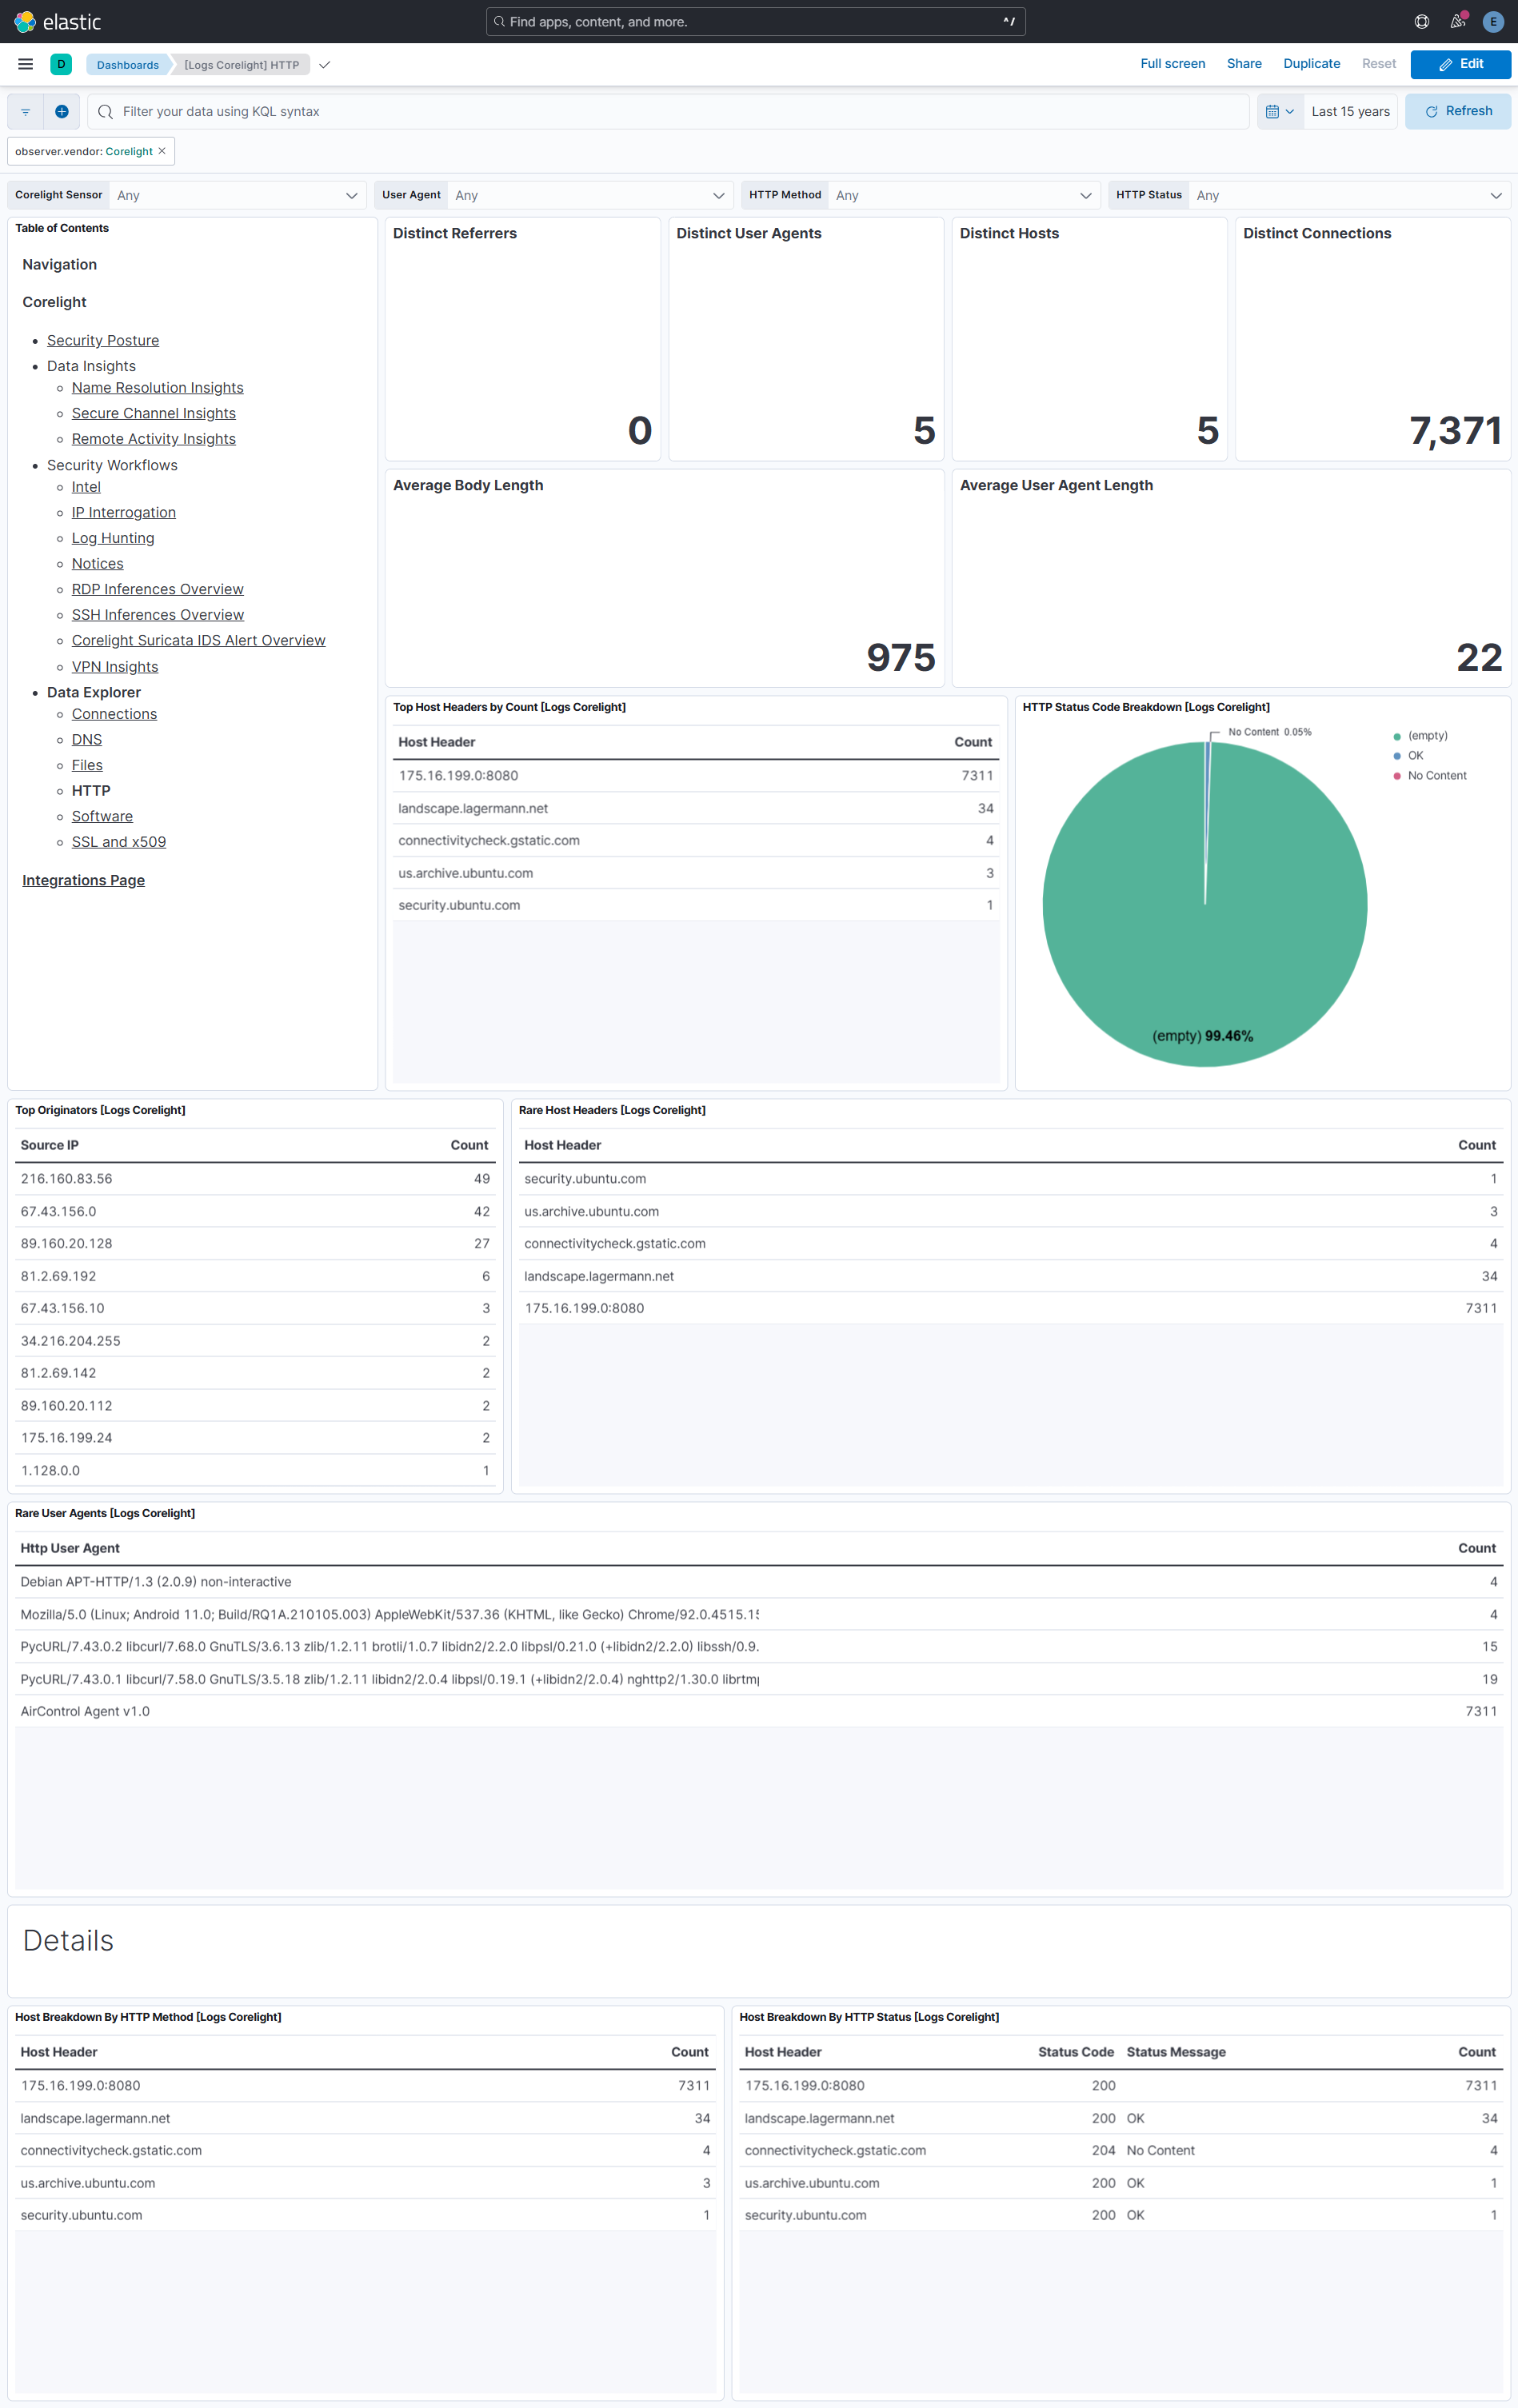
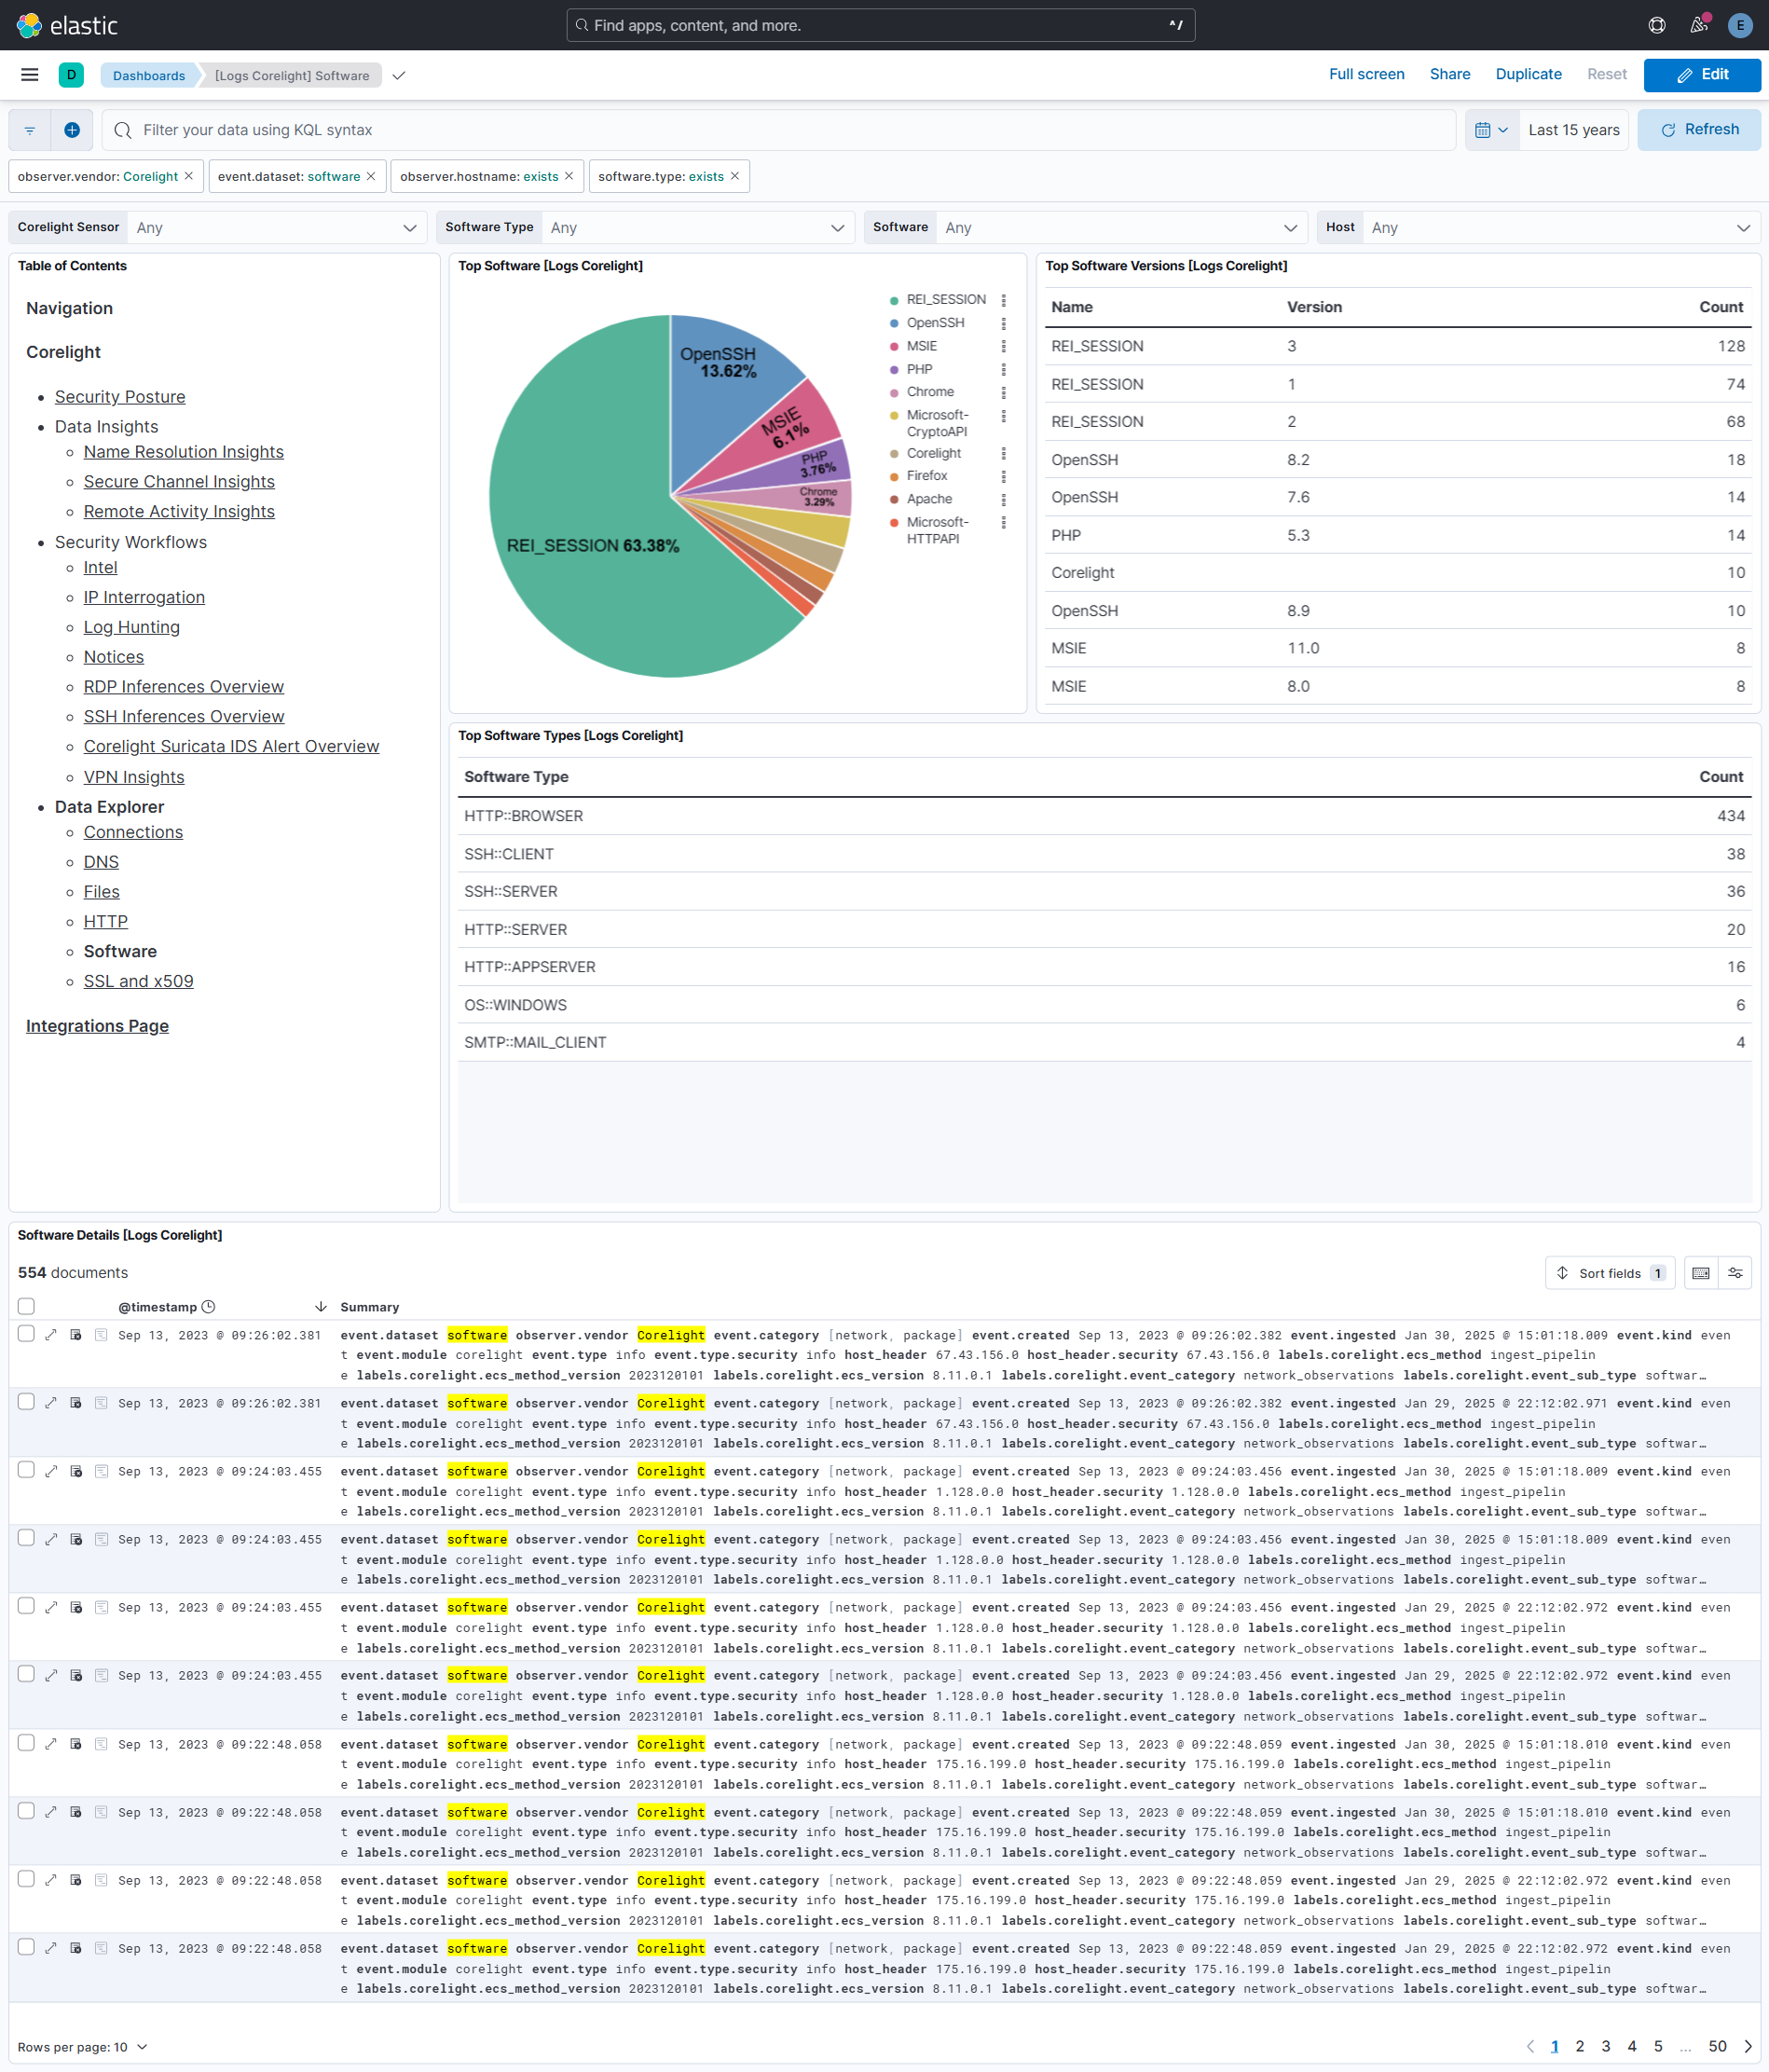
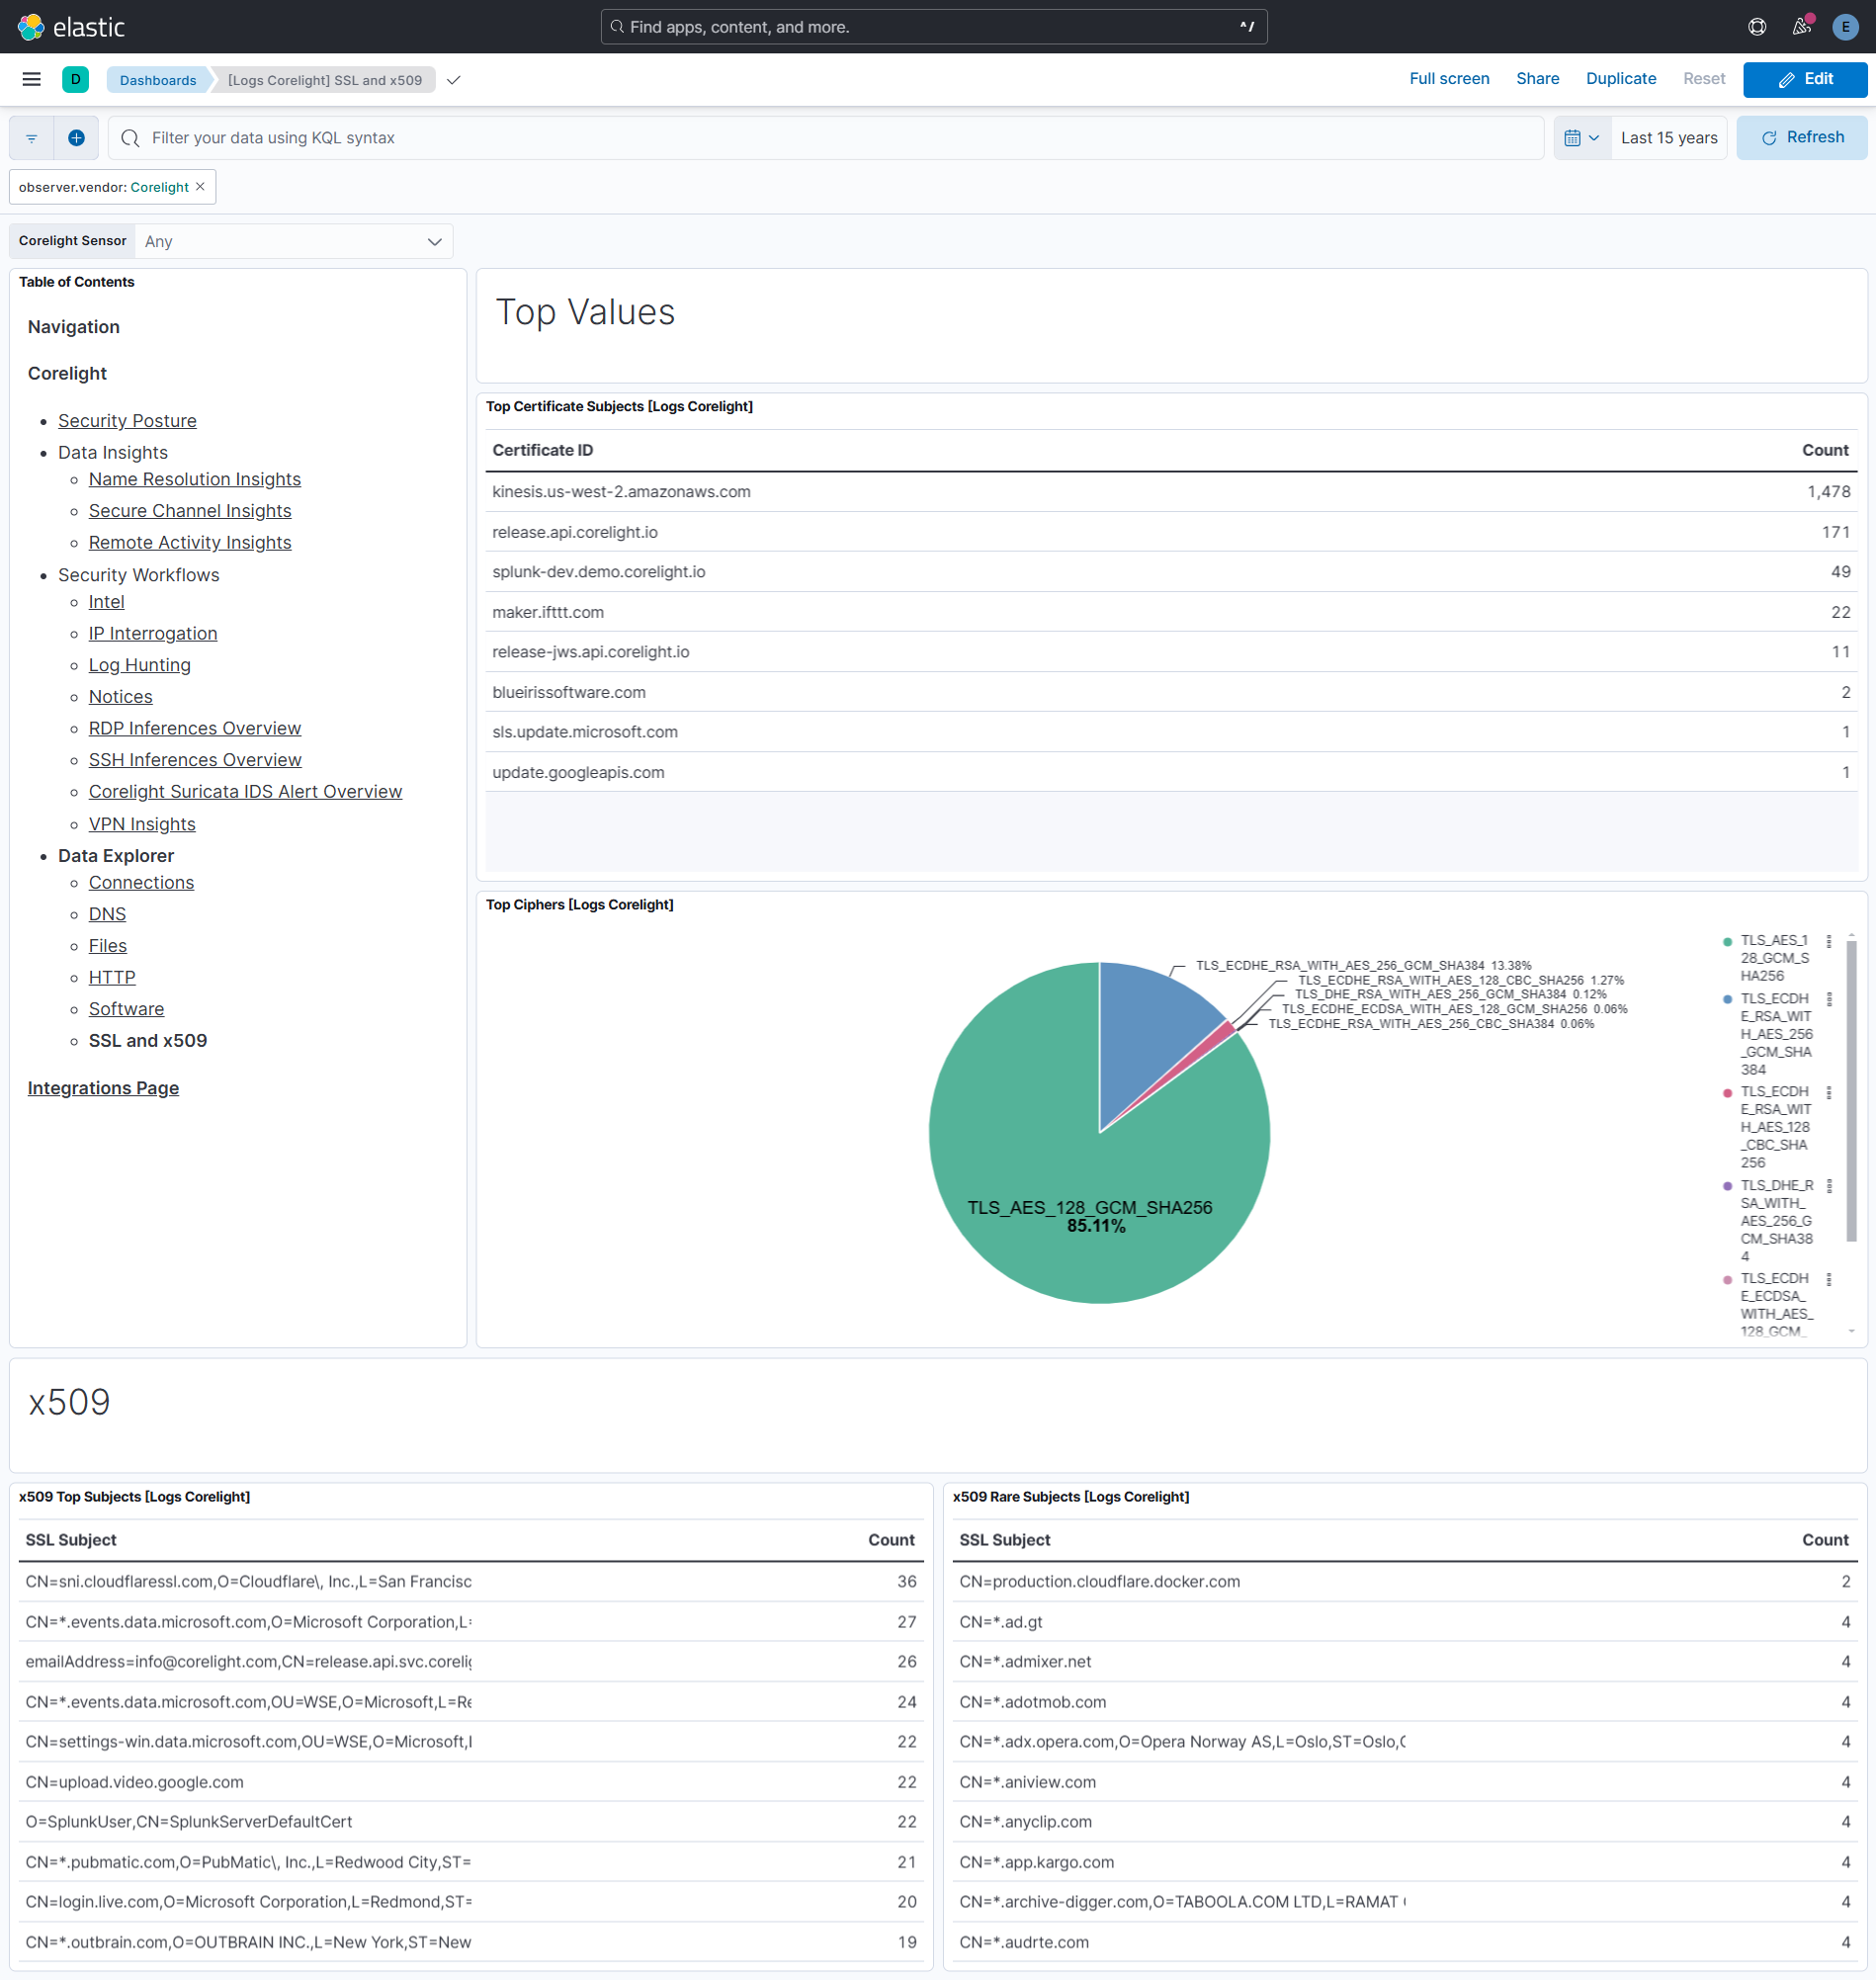
This integration includes only the Corelight dashboards mentioned below:
- Connections
- Corelight Suricata IDS Alert Overview
- DNS
- Files
- HTTP
- Intel
- IP Interrogation
- Log Hunting
- Name Resolution Insights
- Notices
- RDP Inferences Overview
- Remote Activity Insights
- SSH Inferences Overview
- SSL and x509
- Secure Channel Insights
- Security Posture
- Software
- VPN Insights
Prerequisites:
editAdd ECS Mappings: Start by adding the ECS (Elastic Common Schema) mappings from the Corelight GitHub organization. You can find the required templates here: Corelight ECS Templates. The script within the repository installs the necessary components, including index settings, index templates, ILM policies, and ingest pipelines etc. These components will ensure that Corelight data is correctly formatted and aligned with Elastic’s schema.
Send Data from Corelight to Elastic: Once the ECS mappings are in place, configure Elasticsearch in the web interface under Sensor > Export > Export to Elastic. It will require below parameters:
- Server: The HTTP or HTTPS URL (including the port).
- Prefix: The Elasticsearch index, alias, and template prefix (e.g. logs-corelight-*).
- Username: The Username to authenticate to Elasticsearch.
- Password: The Password to authenticate to Elasticsearch.
- Zeek logs to exclude: Logs that you don’t want to export to Elasticsearch. If blank, sensor will export all log types.
- Elasticsearch log filter: Logs to exclude using the Corelight Filtering Language.
Use the index prefix name (logs-*) instead of a custom index prefix.
Setup
editEnabling the integration in Elastic:
edit- In Kibana navigate to Management > Integrations.
-
In "Search for integrations" top bar, search
Corelight
. - Select the "Corelight" integration from the search results.
- Navigate to Settings.
- Select the "Install Corelight assets".
- Navigate to Assets to get list of dashboards.
This integration provides dashboards only. We recommend regularly checking and updating assets using the script from the Corelight repository. For any mapping or parsing issues, especially those not related to the dashboards, we recommend contacting Corelight, as they maintain those components.
Changelog
editChangelog
Version | Details | Kibana version(s) |
---|---|---|
0.8.0 |
Enhancement (View pull request) |
— |
0.7.0 |
Enhancement (View pull request) |
— |
0.6.0 |
Enhancement (View pull request) |
— |
0.5.0 |
Enhancement (View pull request) |
— |
0.4.0 |
Enhancement (View pull request) |
— |
0.3.0 |
Enhancement (View pull request) |
— |
0.2.0 |
Enhancement (View pull request) |
— |
0.1.0 |
Enhancement (View pull request) |
— |