IBM MQ integration
| Version | 1.8.0 (View all) |
| Subscription level What's this? |
Basic |
| Developed by What's this? |
Elastic |
| Ingestion method(s) | File, Prometheus |
| Minimum Kibana version(s) | 9.0.0 8.13.0 |
IBM MQ is a message-oriented middleware for secure and reliable communication between distributed systems. It supports messaging patterns like queuing, publish/subscribe, and assures message delivery without a direct connection between sender and receiver.
Use the IBM MQ integration to:
- Collect Queue Manager performance metrics and error logs, providing insights into messages, topics, subscriptions, and operational events.
- Streamline observability by ingesting IBM MQ metrics and logs into Elasticsearch, enabling centralized monitoring and analysis of IBM MQ environments.
- Enhance system reliability through real-time analysis and proactive alerting based on collected metrics and logs.
The IBM MQ integration collects logs and metrics data.
Logs provide insights into operations and events within the IBM MQ environment. The errorlog data stream collected by the IBM MQ integration enables users to track errors and warnings, understand their causes, and address issues related to message handling and processing.
Metrics provide statistics on the performance and health of IBM MQ. The qmgr data stream collected by the IBM MQ integration covers Queue Manager performance metrics, including message throughput, topics, subscriptions, and other operational statistics. This allows users to monitor and optimize the performance and reliability of their IBM MQ instances.
Data streams:
errorlog: Collects error and warning messages from the IBM MQ Queue Manager, providing details like error descriptions, actions, explanations, and error codes.qmgr: Collects performance metrics from the Queue Manager, including message throughput, topics, subscriptions, and other vital operational statistics.
NOTE: You can monitor and view logs within the ingested documents for IBM MQ using the logs-* index pattern in Discover. For metrics, the corresponding index pattern is metrics-*.
This integration has been tested against IBM MQ v9.1 and IBM MQ v9.2. Currently, the ibmmq qmgr data stream is only compatible with the containerized versions of IBM MQ, such as those available from IBM Cloud Container Registry or Docker Hub.
You need Elasticsearch for storing and searching your data and Kibana for visualizing and managing it. You can use our hosted Elasticsearch Service on Elastic Cloud, which is recommended or self-manage the Elastic Stack on your own hardware.
To ingest data from IBM MQ:
- You should specify Hostname and Port (example: localhost:9157) of Prometheus endpoint (/metrics).
- You should specify the path of IBM MQ Queue Manager Error logs. (default paths:
/var/mqm/errors/*.LOGand/var/mqm/qmgrs/*/errors/*.LOG)
For step-by-step instructions on how to set up an integration, check the Getting started guide.
Enable Metrics in IBM MQ: Ensure that the MQ_ENABLE_METRICS environment variable is set to true for user's IBM MQ service to expose the metrics endpoint.
The Docker image starts the runmqserver process, which spawns the HTTP server exposing metrics in Prometheus format on port 9157.
After the integration is successfully configured, clicking on the Assets tab of the IBM MQ Integration should display a list of available dashboards. Click on the dashboard available for user's configured data stream. It should be populated with the required data.
- In version 1.3.0 of this integration, the field type of
ibmmq.errorlog.error.descriptionhas been changed fromtexttokeyword. It is therefore recommended to update theibmmq.errorlog.error.descriptionfield to use thekeywordtype wherever it is being used. This can be achieved by using the Update By Query API, allowing for a seamless transition of the field type fromtexttokeywordfacross all relevant documents.
The qmgr data stream collects performance metrics of Queue Manager like messages, topics, subscriptions and calls.
Example
{
    "@timestamp": "2024-05-28T10:25:41.537Z",
    "agent": {
        "ephemeral_id": "2a2b7004-c50a-4ee2-9bc6-78d99713b117",
        "id": "476beedd-c7de-4696-a85b-d20aa455d46a",
        "name": "docker-fleet-agent",
        "type": "metricbeat",
        "version": "8.12.0"
    },
    "data_stream": {
        "dataset": "ibmmq.qmgr",
        "namespace": "ep",
        "type": "metrics"
    },
    "ecs": {
        "version": "8.11.0"
    },
    "elastic_agent": {
        "id": "476beedd-c7de-4696-a85b-d20aa455d46a",
        "snapshot": false,
        "version": "8.12.0"
    },
    "event": {
        "agent_id_status": "verified",
        "category": [
            "web"
        ],
        "dataset": "ibmmq.qmgr",
        "duration": 15347292,
        "ingested": "2024-05-28T10:25:53Z",
        "kind": "metric",
        "module": "ibmmq",
        "type": [
            "info"
        ]
    },
    "host": {
        "architecture": "x86_64",
        "containerized": true,
        "hostname": "docker-fleet-agent",
        "id": "829324aac17946dcace17006fa82a2d2",
        "ip": [
            "192.168.243.9"
        ],
        "mac": [
            "02-42-AC-1F-00-07"
        ],
        "name": "docker-fleet-agent",
        "os": {
            "codename": "focal",
            "family": "debian",
            "kernel": "3.10.0-1160.102.1.el7.x86_64",
            "name": "Ubuntu",
            "platform": "ubuntu",
            "type": "linux",
            "version": "20.04.6 LTS (Focal Fossa)"
        }
    },
    "ibmmq": {
        "labels": {
            "job": "ibmmq",
            "qmgr": "QM1"
        },
        "qmgr": {
            "calls": {
                "failed": {
                    "callback": {
                        "count": 0
                    },
                    "close": {
                        "count": 0
                    },
                    "connections": {
                        "count": 0
                    },
                    "get": {
                        "count": 2
                    },
                    "inquire": {
                        "count": 0
                    },
                    "open": {
                        "count": 0
                    },
                    "set": {
                        "count": 0
                    },
                    "subscription_request": {
                        "count": 0
                    }
                },
                "succeeded": {
                    "callback": {
                        "count": 0
                    },
                    "close": {
                        "count": 0
                    },
                    "connections": {
                        "count": 0
                    },
                    "control": {
                        "count": 0
                    },
                    "disconnect": {
                        "count": 0
                    },
                    "inquire": {
                        "count": 4
                    },
                    "open": {
                        "count": 0
                    },
                    "set": {
                        "count": 0
                    },
                    "status": {
                        "count": 0
                    },
                    "subscription_request": {
                        "count": 0
                    }
                }
            },
            "destructive": {
                "get": {
                    "bytes": 4868,
                    "count": 13
                }
            },
            "log": {
                "written": {
                    "bytes": {
                        "logical": 0,
                        "physical": 0
                    }
                }
            },
            "messages": {
                "commit": {
                    "count": 0
                },
                "expired": {
                    "count": 0
                },
                "failed": {
                    "browse": {
                        "count": 0
                    },
                    "mq": {
                        "put": {
                            "count": 0
                        },
                        "put1": {
                            "count": 0
                        }
                    }
                },
                "mq": {
                    "put": {
                        "bytes": 4868,
                        "count": 13
                    }
                },
                "non_persistent": {
                    "browse": {
                        "bytes": 0,
                        "count": 0
                    },
                    "destructive": {
                        "get": {
                            "count": 13
                        }
                    },
                    "get": {
                        "bytes": 4868
                    },
                    "mq": {
                        "put": {
                            "count": 13
                        },
                        "put1": {
                            "count": 0
                        }
                    },
                    "put": {
                        "bytes": 4868
                    }
                },
                "persistent": {
                    "browse": {
                        "bytes": 0,
                        "count": 0
                    },
                    "destructive": {
                        "get": {
                            "count": 0
                        }
                    },
                    "get": {
                        "bytes": 0
                    },
                    "mq": {
                        "put": {
                            "count": 0
                        },
                        "put1": {
                            "count": 0
                        }
                    },
                    "put": {
                        "bytes": 0
                    }
                },
                "published": {
                    "subscribers": {
                        "bytes": 3500,
                        "count": 13
                    }
                },
                "purged": {
                    "queue": {
                        "count": 0
                    }
                }
            },
            "rollback": {
                "count": 0
            },
            "subscription": {
                "durable": {
                    "alter": {
                        "count": 0
                    },
                    "create": {
                        "count": 0
                    },
                    "delete": {
                        "count": 0
                    },
                    "resume": {
                        "count": 0
                    }
                },
                "failed": {
                    "create_alter_resume": {
                        "count": 0
                    },
                    "delete": {
                        "count": 0
                    }
                },
                "non_durable": {
                    "create": {
                        "count": 0
                    },
                    "delete": {
                        "count": 0
                    }
                }
            },
            "topic": {
                "mq": {
                    "put": {
                        "count": 13,
                        "failed": {
                            "count": 0
                        },
                        "non_persistent": {
                            "count": 13
                        },
                        "persistent": {
                            "count": 0
                        }
                    }
                },
                "put": {
                    "bytes": 3500
                }
            }
        }
    },
    "metricset": {
        "name": "collector",
        "period": 10000
    },
    "service": {
        "address": "http://elastic-package-service-ibmmq-1:9157/metrics",
        "type": "ibmmq"
    },
    "tags": [
        "ibmmq-qmgr"
    ]
}
ECS Field Reference
Refer to the following document for detailed information on ECS fields.
Exported fields
| Field | Description | Type | Metric Type |
|---|---|---|---|
| @timestamp | Event timestamp. | date | |
| agent.id | Unique identifier of this agent (if one exists). Example: For Beats this would be beat.id. | keyword | |
| cloud.account.id | The cloud account or organization id used to identify different entities in a multi-tenant environment. Examples: AWS account id, Google Cloud ORG Id, or other unique identifier. | keyword | |
| cloud.availability_zone | Availability zone in which this host, resource, or service is located. | keyword | |
| cloud.instance.id | Instance ID of the host machine. | keyword | |
| cloud.provider | Name of the cloud provider. Example values are aws, azure, gcp, or digitalocean. | keyword | |
| cloud.region | Region in which this host, resource, or service is located. | keyword | |
| container.id | Unique container id. | keyword | |
| data_stream.dataset | Data stream dataset. | constant_keyword | |
| data_stream.namespace | Data stream namespace. | constant_keyword | |
| data_stream.type | Data stream type. | constant_keyword | |
| host.name | Name of the host. It can contain what hostname returns on Unix systems, the fully qualified domain name (FQDN), or a name specified by the user. The recommended value is the lowercase FQDN of the host. | keyword | |
| ibmmq.labels.job | Prometheus label job. | keyword | |
| ibmmq.labels.qmgr | Name of Queue Manager. | keyword | |
| ibmmq.qmgr.calls.failed.callback.count | Failed MQCB count. | long | counter |
| ibmmq.qmgr.calls.failed.close.count | Failed MQCLOSE count. | long | counter |
| ibmmq.qmgr.calls.failed.connections.count | Failed MQCONN/MQCONNX count. | long | counter |
| ibmmq.qmgr.calls.failed.get.count | Failed MQGET - count. | long | counter |
| ibmmq.qmgr.calls.failed.inquire.count | Failed MQINQ count. | long | counter |
| ibmmq.qmgr.calls.failed.open.count | Failed MQOPEN count. | long | counter |
| ibmmq.qmgr.calls.failed.set.count | Failed MQSET count. | long | counter |
| ibmmq.qmgr.calls.failed.subscription_request.count | Failed MQSUBRQ count. | long | counter |
| ibmmq.qmgr.calls.succeeded.callback.count | MQCB count. | long | counter |
| ibmmq.qmgr.calls.succeeded.close.count | MQCLOSE count. | long | counter |
| ibmmq.qmgr.calls.succeeded.connections.count | MQCONN/MQCONNX count. | long | counter |
| ibmmq.qmgr.calls.succeeded.control.count | MQCTL count. | long | counter |
| ibmmq.qmgr.calls.succeeded.disconnect.count | MQDISC count. | long | counter |
| ibmmq.qmgr.calls.succeeded.inquire.count | MQINQ count. | long | counter |
| ibmmq.qmgr.calls.succeeded.open.count | MQOPEN count. | long | counter |
| ibmmq.qmgr.calls.succeeded.set.count | MQSET count. | long | counter |
| ibmmq.qmgr.calls.succeeded.status.count | MQSTAT count. | long | counter |
| ibmmq.qmgr.calls.succeeded.subscription_request.count | MQSUBRQ count. | long | counter |
| ibmmq.qmgr.destructive.get.bytes | Interval total destructive get - byte count. | long | counter |
| ibmmq.qmgr.destructive.get.count | Interval total destructive get - count. | long | counter |
| ibmmq.qmgr.log.written.bytes.logical | Log - logical bytes written. | long | counter |
| ibmmq.qmgr.log.written.bytes.physical | Log - physical bytes written. | long | counter |
| ibmmq.qmgr.messages.commit.count | Commit count. | long | counter |
| ibmmq.qmgr.messages.expired.count | Expired message count. | long | counter |
| ibmmq.qmgr.messages.failed.browse.count | Failed browse count. | long | counter |
| ibmmq.qmgr.messages.failed.mq.put.count | Failed MQPUT count. | long | counter |
| ibmmq.qmgr.messages.failed.mq.put1.count | Failed MQPUT1 count. | long | counter |
| ibmmq.qmgr.messages.mq.put.bytes | Interval total MQPUT/MQPUT1 byte count. | long | counter |
| ibmmq.qmgr.messages.mq.put.count | Interval total MQPUT/MQPUT1 count. | long | counter |
| ibmmq.qmgr.messages.non_persistent.browse.bytes | Non-persistent message browse - byte count. | long | counter |
| ibmmq.qmgr.messages.non_persistent.browse.count | Non-persistent message browse - count. | long | counter |
| ibmmq.qmgr.messages.non_persistent.destructive.get.count | Non-persistent message destructive get - count. | long | counter |
| ibmmq.qmgr.messages.non_persistent.get.bytes | Got non-persistent messages - byte count. | long | counter |
| ibmmq.qmgr.messages.non_persistent.mq.put.count | Non-persistent message MQPUT count. | long | counter |
| ibmmq.qmgr.messages.non_persistent.mq.put1.count | Non-persistent message MQPUT1 count. | long | counter |
| ibmmq.qmgr.messages.non_persistent.put.bytes | Put non-persistent messages - byte count. | long | counter |
| ibmmq.qmgr.messages.persistent.browse.bytes | Persistent message browse - byte count. | long | counter |
| ibmmq.qmgr.messages.persistent.browse.count | Persistent message browse - count. | long | counter |
| ibmmq.qmgr.messages.persistent.destructive.get.count | Persistent message destructive get - count. | long | counter |
| ibmmq.qmgr.messages.persistent.get.bytes | Get persistent messages - byte count. | long | counter |
| ibmmq.qmgr.messages.persistent.mq.put.count | Persistent message MQPUT count. | long | counter |
| ibmmq.qmgr.messages.persistent.mq.put1.count | Persistent message MQPUT1 count. | long | counter |
| ibmmq.qmgr.messages.persistent.put.bytes | Put persistent messages - byte count. | long | counter |
| ibmmq.qmgr.messages.published.subscribers.bytes | Published to subscribers - byte count. | long | counter |
| ibmmq.qmgr.messages.published.subscribers.count | Published to subscribers - message count. | long | counter |
| ibmmq.qmgr.messages.purged.queue.count | Purged queue count. | long | counter |
| ibmmq.qmgr.rollback.count | Rollback count. | long | counter |
| ibmmq.qmgr.subscription.durable.alter.count | Alter durable subscription count. | long | counter |
| ibmmq.qmgr.subscription.durable.create.count | Create durable subscription count. | long | counter |
| ibmmq.qmgr.subscription.durable.delete.count | Delete durable subscription count. | long | counter |
| ibmmq.qmgr.subscription.durable.resume.count | Resume durable subscription count. | long | counter |
| ibmmq.qmgr.subscription.failed.create_alter_resume.count | Failed create/alter/resume subscription count. | long | counter |
| ibmmq.qmgr.subscription.failed.delete.count | Subscription delete failure count. | long | counter |
| ibmmq.qmgr.subscription.non_durable.create.count | Create non-durable subscription count. | long | counter |
| ibmmq.qmgr.subscription.non_durable.delete.count | Delete non-durable subscription count. | long | counter |
| ibmmq.qmgr.topic.mq.put.count | Topic MQPUT/MQPUT1 interval total. | long | counter |
| ibmmq.qmgr.topic.mq.put.failed.count | Failed topic MQPUT/MQPUT1 count. | long | counter |
| ibmmq.qmgr.topic.mq.put.non_persistent.count | Non-persistent - topic MQPUT/MQPUT1 count. | long | counter |
| ibmmq.qmgr.topic.mq.put.persistent.count | Persistent - topic MQPUT/MQPUT1 count. | long | counter |
| ibmmq.qmgr.topic.put.bytes | Interval total topic bytes put. | long | counter |
| service.address | Address where data about this service was collected from. This should be a URI, network address (ipv4:port or [ipv6]:port) or a resource path (sockets). | keyword |
The errorlog data stream collects Error logs of Queue Manager which include the description, action, explanation and code of the error.
Example
{
    "@timestamp": "2024-05-28T10:29:59.860Z",
    "agent": {
        "ephemeral_id": "cbbb6e1e-c10f-4635-bb3e-b42063268637",
        "id": "476beedd-c7de-4696-a85b-d20aa455d46a",
        "name": "docker-fleet-agent",
        "type": "filebeat",
        "version": "8.12.0"
    },
    "data_stream": {
        "dataset": "ibmmq.errorlog",
        "namespace": "ep",
        "type": "logs"
    },
    "ecs": {
        "version": "8.11.0"
    },
    "elastic_agent": {
        "id": "476beedd-c7de-4696-a85b-d20aa455d46a",
        "snapshot": false,
        "version": "8.12.0"
    },
    "event": {
        "agent_id_status": "verified",
        "created": "2024-05-28T10:30:26.219Z",
        "dataset": "ibmmq.errorlog",
        "ingested": "2024-05-28T10:30:38Z",
        "kind": "event",
        "module": "ibmmq",
        "type": [
            "error"
        ]
    },
    "host": {
        "hostname": "99726abecb7d",
        "name": "docker-fleet-agent"
    },
    "ibmmq": {
        "errorlog": {
            "error": {
                "action": "Host Info :- Linux 3.10.0-1160.102.1.el7.x86_64 (MQ Linux (x86-64 platform) 64-bit) Installation :- /opt/mqm (Installation1) Version :- 9.2.4.0 (p924-L211105.DE) ACTION: None.",
                "code": "AMQ6287I",
                "description": "IBM MQ V9.2.4.0 (p924-L211105.DE).",
                "explanation": "IBM MQ system"
            },
            "insert": {
                "comment": [
                    "Linux 3.10.0-1160.102.1.el7.x86_64 (MQ Linux (x86-64 platform) 64-bit)",
                    "/opt/mqm (Installation1)",
                    "9.2.4.0 (p924-L211105.DE)"
                ]
            },
            "installation": "Installation1"
        }
    },
    "input": {
        "type": "log"
    },
    "log": {
        "file": {
            "path": "/tmp/service_logs/AMQERR01.LOG"
        },
        "flags": [
            "multiline"
        ],
        "offset": 0
    },
    "process": {
        "pid": 58.1,
        "title": "crtmqm"
    },
    "service": {
        "version": "9.2.4.0"
    },
    "tags": [
        "forwarded",
        "ibmmq-errorlog"
    ],
    "user": {
        "name": "root"
    }
}
ECS Field Reference
Refer to the following document for detailed information on ECS fields.
Exported fields
| Field | Description | Type |
|---|---|---|
| @timestamp | Event timestamp. | date |
| data_stream.dataset | Data stream dataset. | constant_keyword |
| data_stream.namespace | Data stream namespace. | constant_keyword |
| data_stream.type | Data stream type. | constant_keyword |
| ibmmq.errorlog.error.action | Defines what to do when the error occurs. | keyword |
| ibmmq.errorlog.error.code | Error code. | keyword |
| ibmmq.errorlog.error.description | Error description. | keyword |
| ibmmq.errorlog.error.explanation | Explains the error in more detail. | keyword |
| ibmmq.errorlog.insert.arith | Changing content based on error.id. | keyword |
| ibmmq.errorlog.insert.comment | Changing content based on error.id. | keyword |
| ibmmq.errorlog.installation | This is the installation name which can be given at installation time. Each installation of IBM MQ on UNIX, Linux, and Windows, has a unique identifier known as an installation name. The installation name is used to associate things such as queue managers and configuration files with an installation. | keyword |
| ibmmq.errorlog.queue_manager | Name of the queue manager. Queue managers provide queuing services to applications, and manages the queues that belong to them. | keyword |
| input.type | The input type from which the event was generated. This field is set to the value specified for the type option in the input section of the Filebeat config file. | keyword |
| log.flags | This field contains the flags of the event. | keyword |
| log.offset | The file offset the reported line starts at. | long |
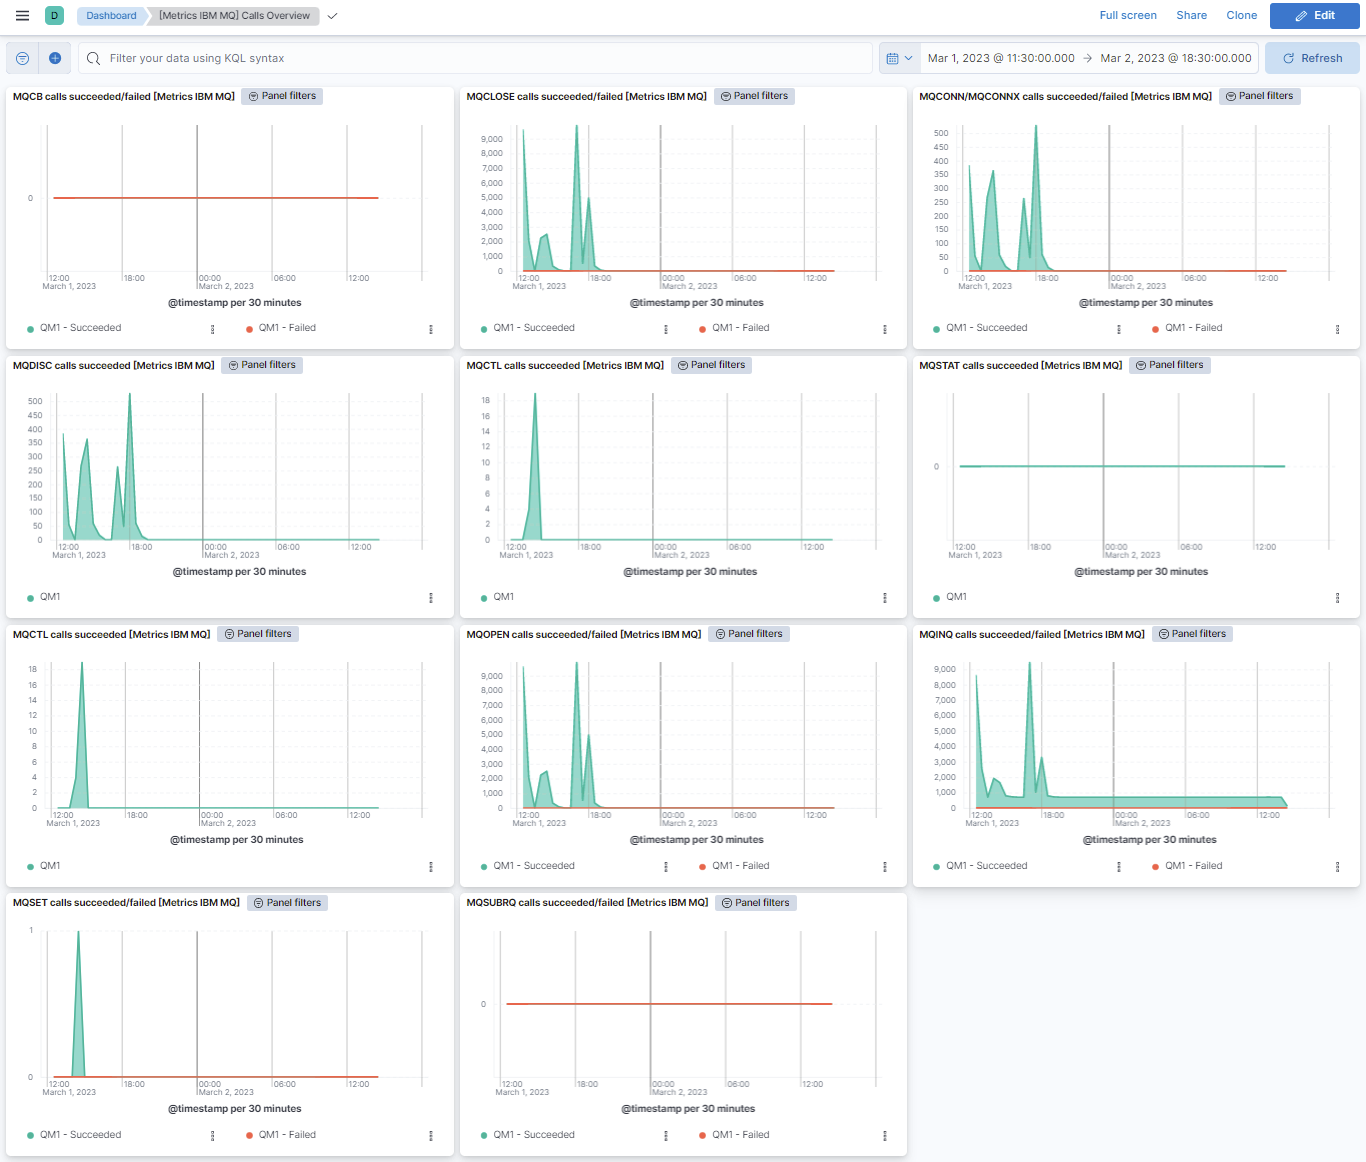
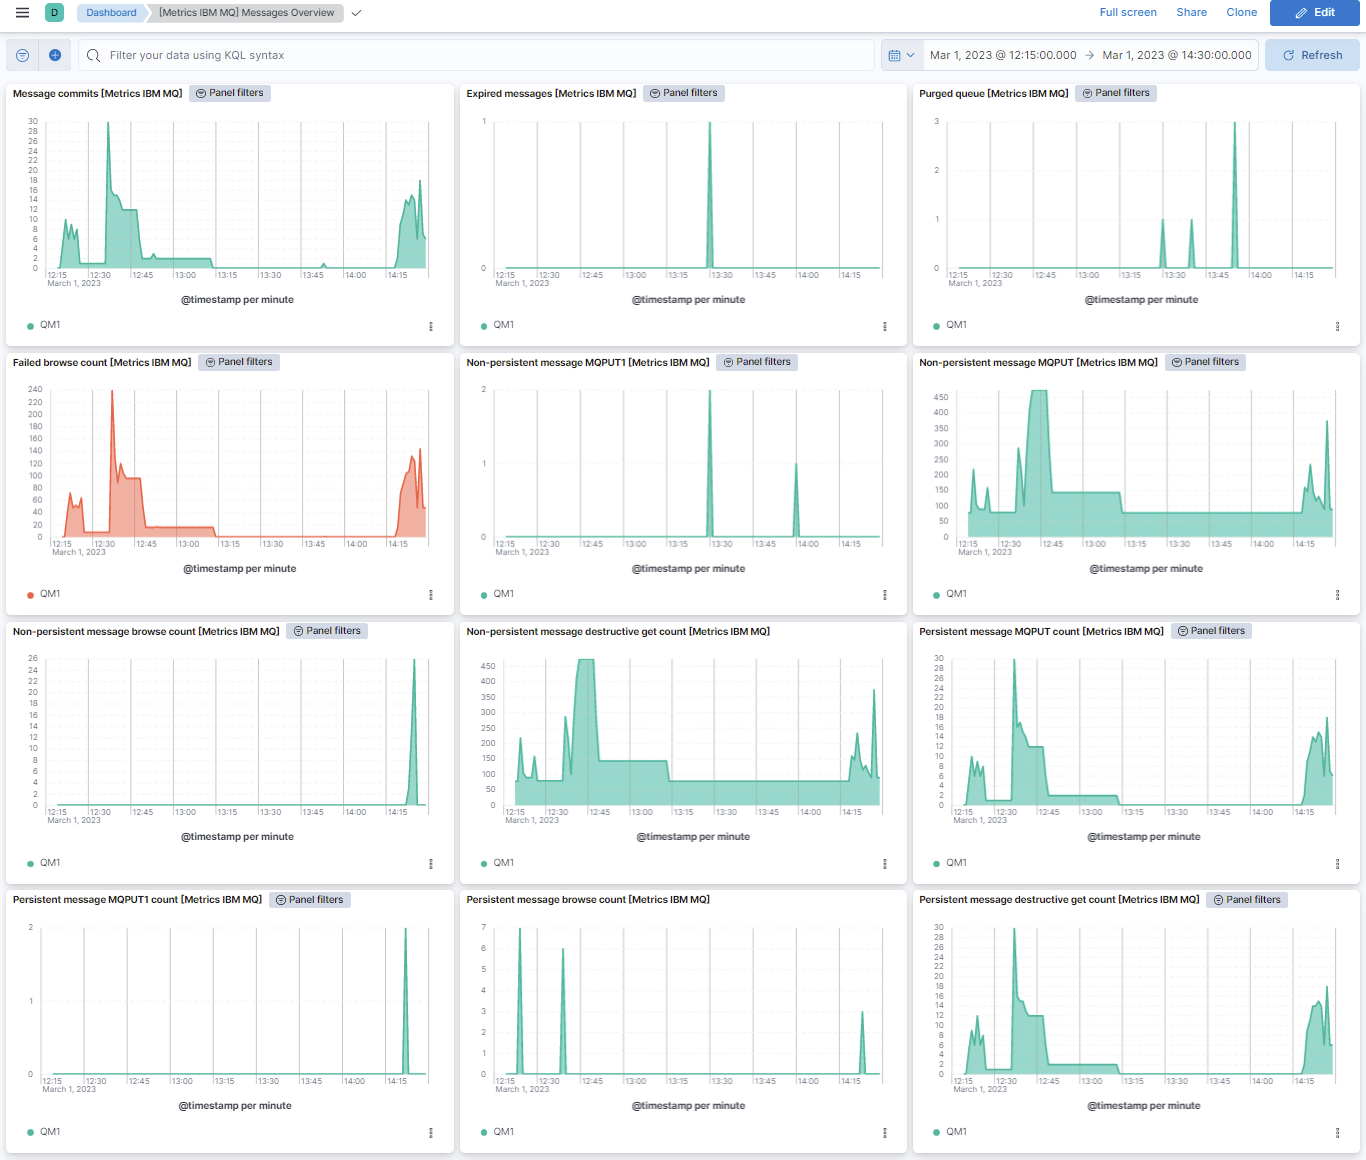
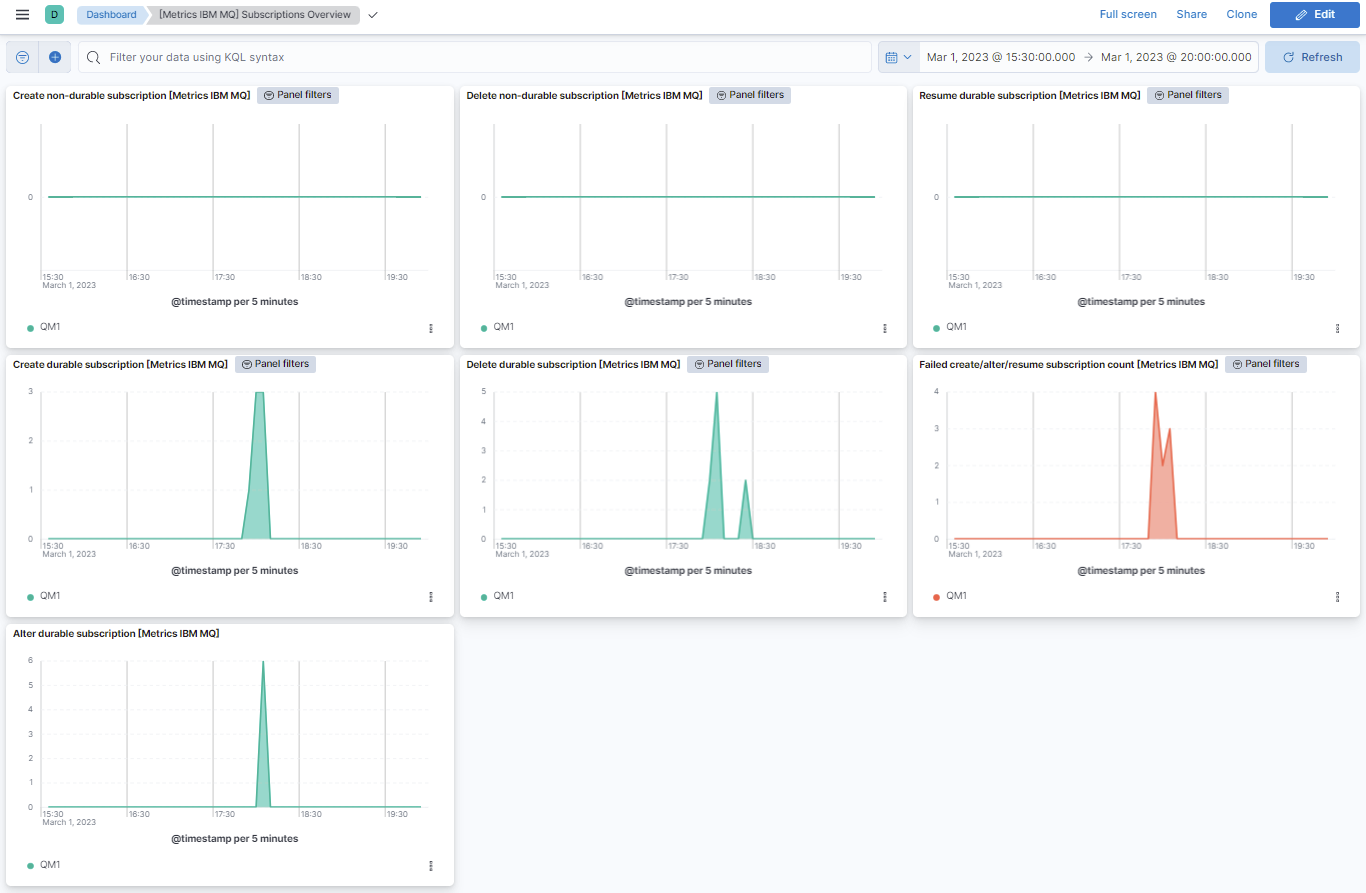
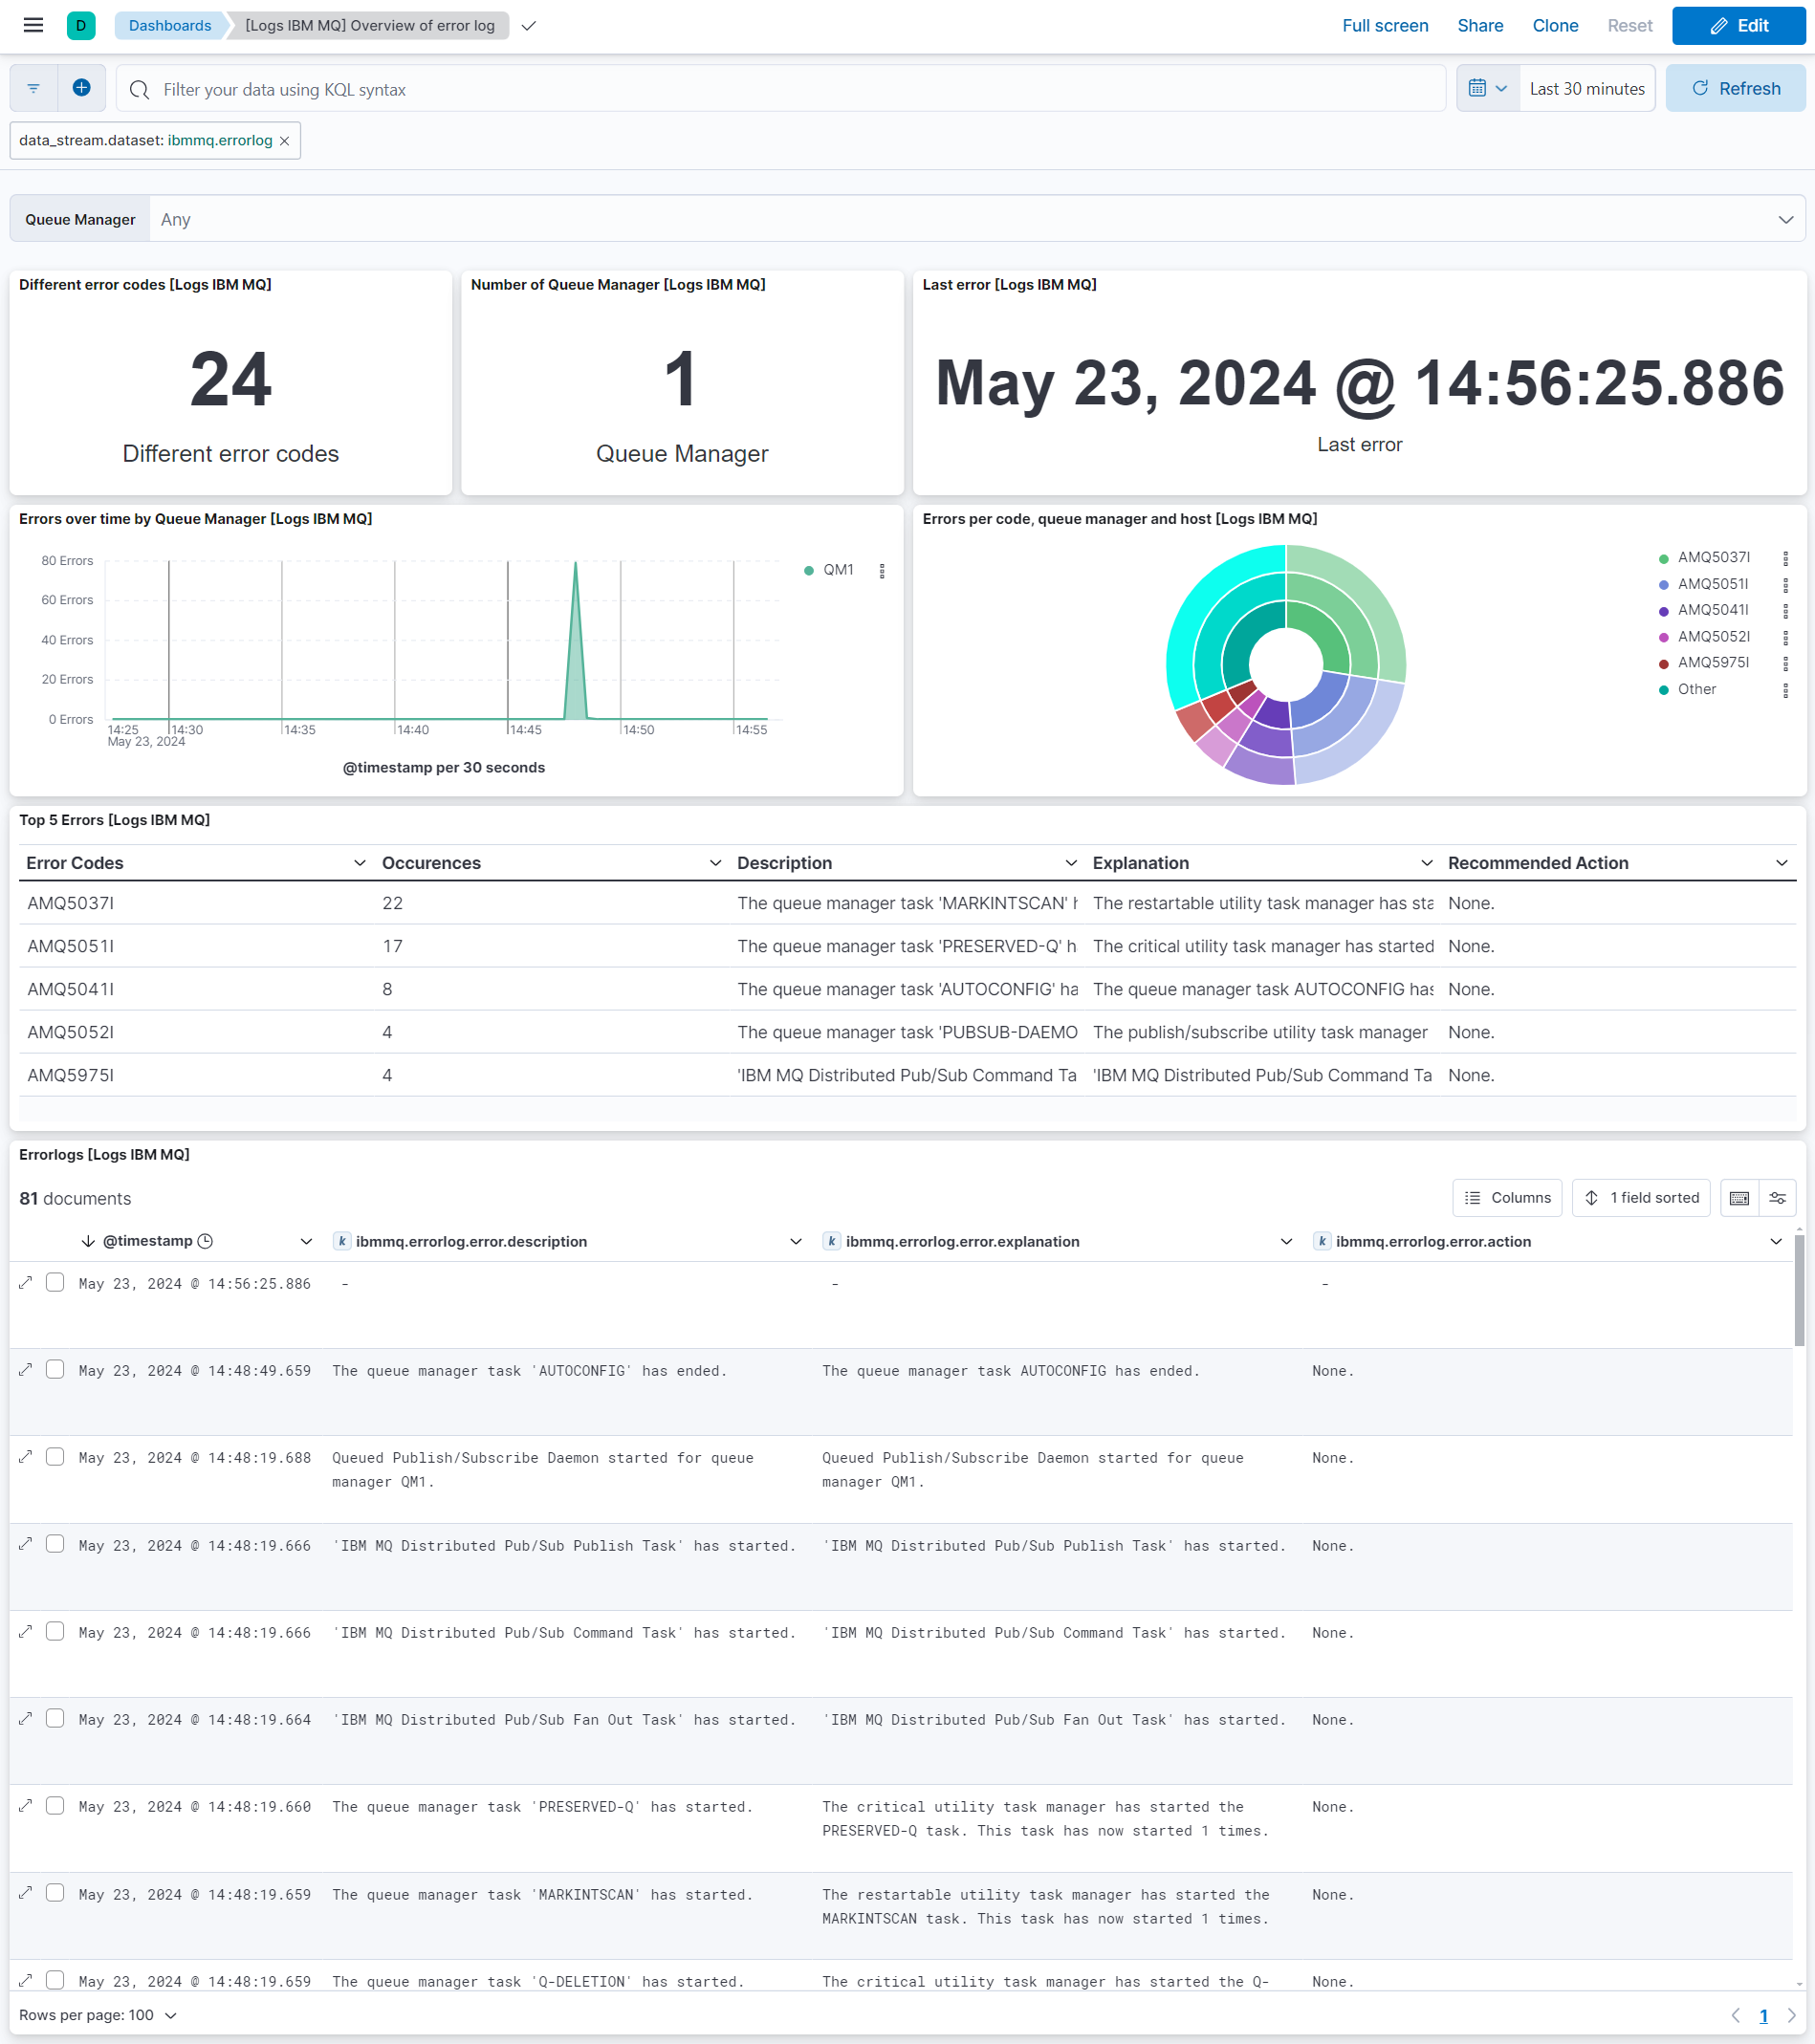
This integration includes one or more Kibana dashboards that visualizes the data collected by the integration. The screenshots below illustrate how the ingested data is displayed.
Changelog
| Version | Details | Minimum Kibana version |
|---|---|---|
| 1.8.0 | Enhancement (View pull request) Improve documentation |
9.0.0 8.13.0 |
| 1.7.0 | Enhancement (View pull request) Allow @custom pipeline access to event.original without setting preserve_original_event. |
9.0.0 8.13.0 |
| 1.6.1 | Bug fix (View pull request) Added description to ssl nodes including links to documentation. |
9.0.0 8.13.0 |
| 1.6.0 | Enhancement (View pull request) Add support for Kibana 9.0.0. |
9.0.0 8.13.0 |
| 1.5.0 | Enhancement (View pull request) Allow the usage of deprecated log input and support for stack 9.0 |
8.13.0 |
| 1.4.2 | Bug fix (View pull request) Update links to getting started docs |
8.13.0 |
| 1.4.1 | Enhancement (View pull request) Update the IBM MQ compatibility section. |
8.13.0 |
| 1.4.0 | Enhancement (View pull request) ECS version updated to 8.11.0. Update the kibana constraint to ^8.13.0. Modified the field definitions to remove ECS fields made redundant by the ecs@mappings component template. |
8.13.0 |
| 1.3.0 | Enhancement (View pull request) Enable secret for the password field and add dashboard-level filters. |
8.12.0 |
| 1.2.5 | Bug fix (View pull request) Drop empty events from errorlog data stream responses. |
8.8.0 |
| 1.2.4 | Bug fix (View pull request) Add null and ignore_missing check to handle event.original field. |
8.8.0 |
| 1.2.3 | Bug fix (View pull request) Remove forwarded tag from metrics data stream. |
8.8.0 |
| 1.2.2 | Bug fix (View pull request) Update the docker image. |
8.8.0 |
| 1.2.1 | Enhancement (View pull request) Update description for compatibility |
8.8.0 |
| 1.2.0 | Enhancement (View pull request) Enable time series data streams for the metrics datasets. This dramatically reduces storage for metrics and is expected to progressively improve query performance. For more details, see https://www.elastic.co/guide/en/elasticsearch/reference/current/tsds.html. |
8.8.0 |
| 1.1.0 | Enhancement (View pull request) Added metric_type mappings for qmgr datastream for TSDB enablement |
8.5.0 |
| 1.0.0 | Enhancement (View pull request) Make IBM MQ GA |
8.5.0 |
| 0.6.0 | Enhancement (View pull request) Added dimension fields for qmgr datastream for TSDB enablement |
8.5.0 |
| 0.5.0 | Enhancement (View pull request) Rename ownership from obs-service-integrations to obs-infraobs-integrations |
8.5.0 |
| 0.4.0 | Enhancement (View pull request) Migrate visualizations to lens. |
8.5.0 |
| 0.3.1 | Enhancement (View pull request) Added categories and/or subcategories. |
8.2.0 |
| 0.3.0 | Enhancement (View pull request) Update ECS version to 8.5.1 |
8.2.0 |
| 0.2.0 | Enhancement (View pull request) Added infrastructure category. |
8.2.0 |
| 0.1.1 | Enhancement (View pull request) IBM MQ integration package with "qmgr" data stream |
8.2.0 |
| 0.1.0 | Enhancement (View pull request) IBM MQ integration package with "errorlog" data stream |
8.2.0 |


