Syslog Router Integration
| Version | 0.4.0
|
| Subscription level What's this? |
Basic |
| Developed by What's this? |
Elastic |
| Ingestion method(s) | File, Network Protocol |
| Minimum Kibana version(s) | 9.0.0 8.14.3 |
To use beta integrations, go to the Integrations page in Kibana, scroll down, and toggle on the Display beta integrations option.
The Syslog Router integration can be used on a stream of syslog events to identify which integrations they belong to and forward to the appropriate data stream.
Syslog events will be routed to the data stream provided in the pattern
definition. In the event a match cannot be made, an event will be placed
into the log data stream. See the Setup section in this document for
further explanation on how to configure data streams.
Elasticsearch for storing and searching your data and Kibana for visualizing and managing it. We recommend using our hosted Elasticsearch Service on Elastic Cloud, or self-manage the Elastic Stack on your own hardware. Additionally, to route events to other data streams, the corresponding Elastic Integration assets will need to be installed.
Install the relevant integration assets in Kibana.
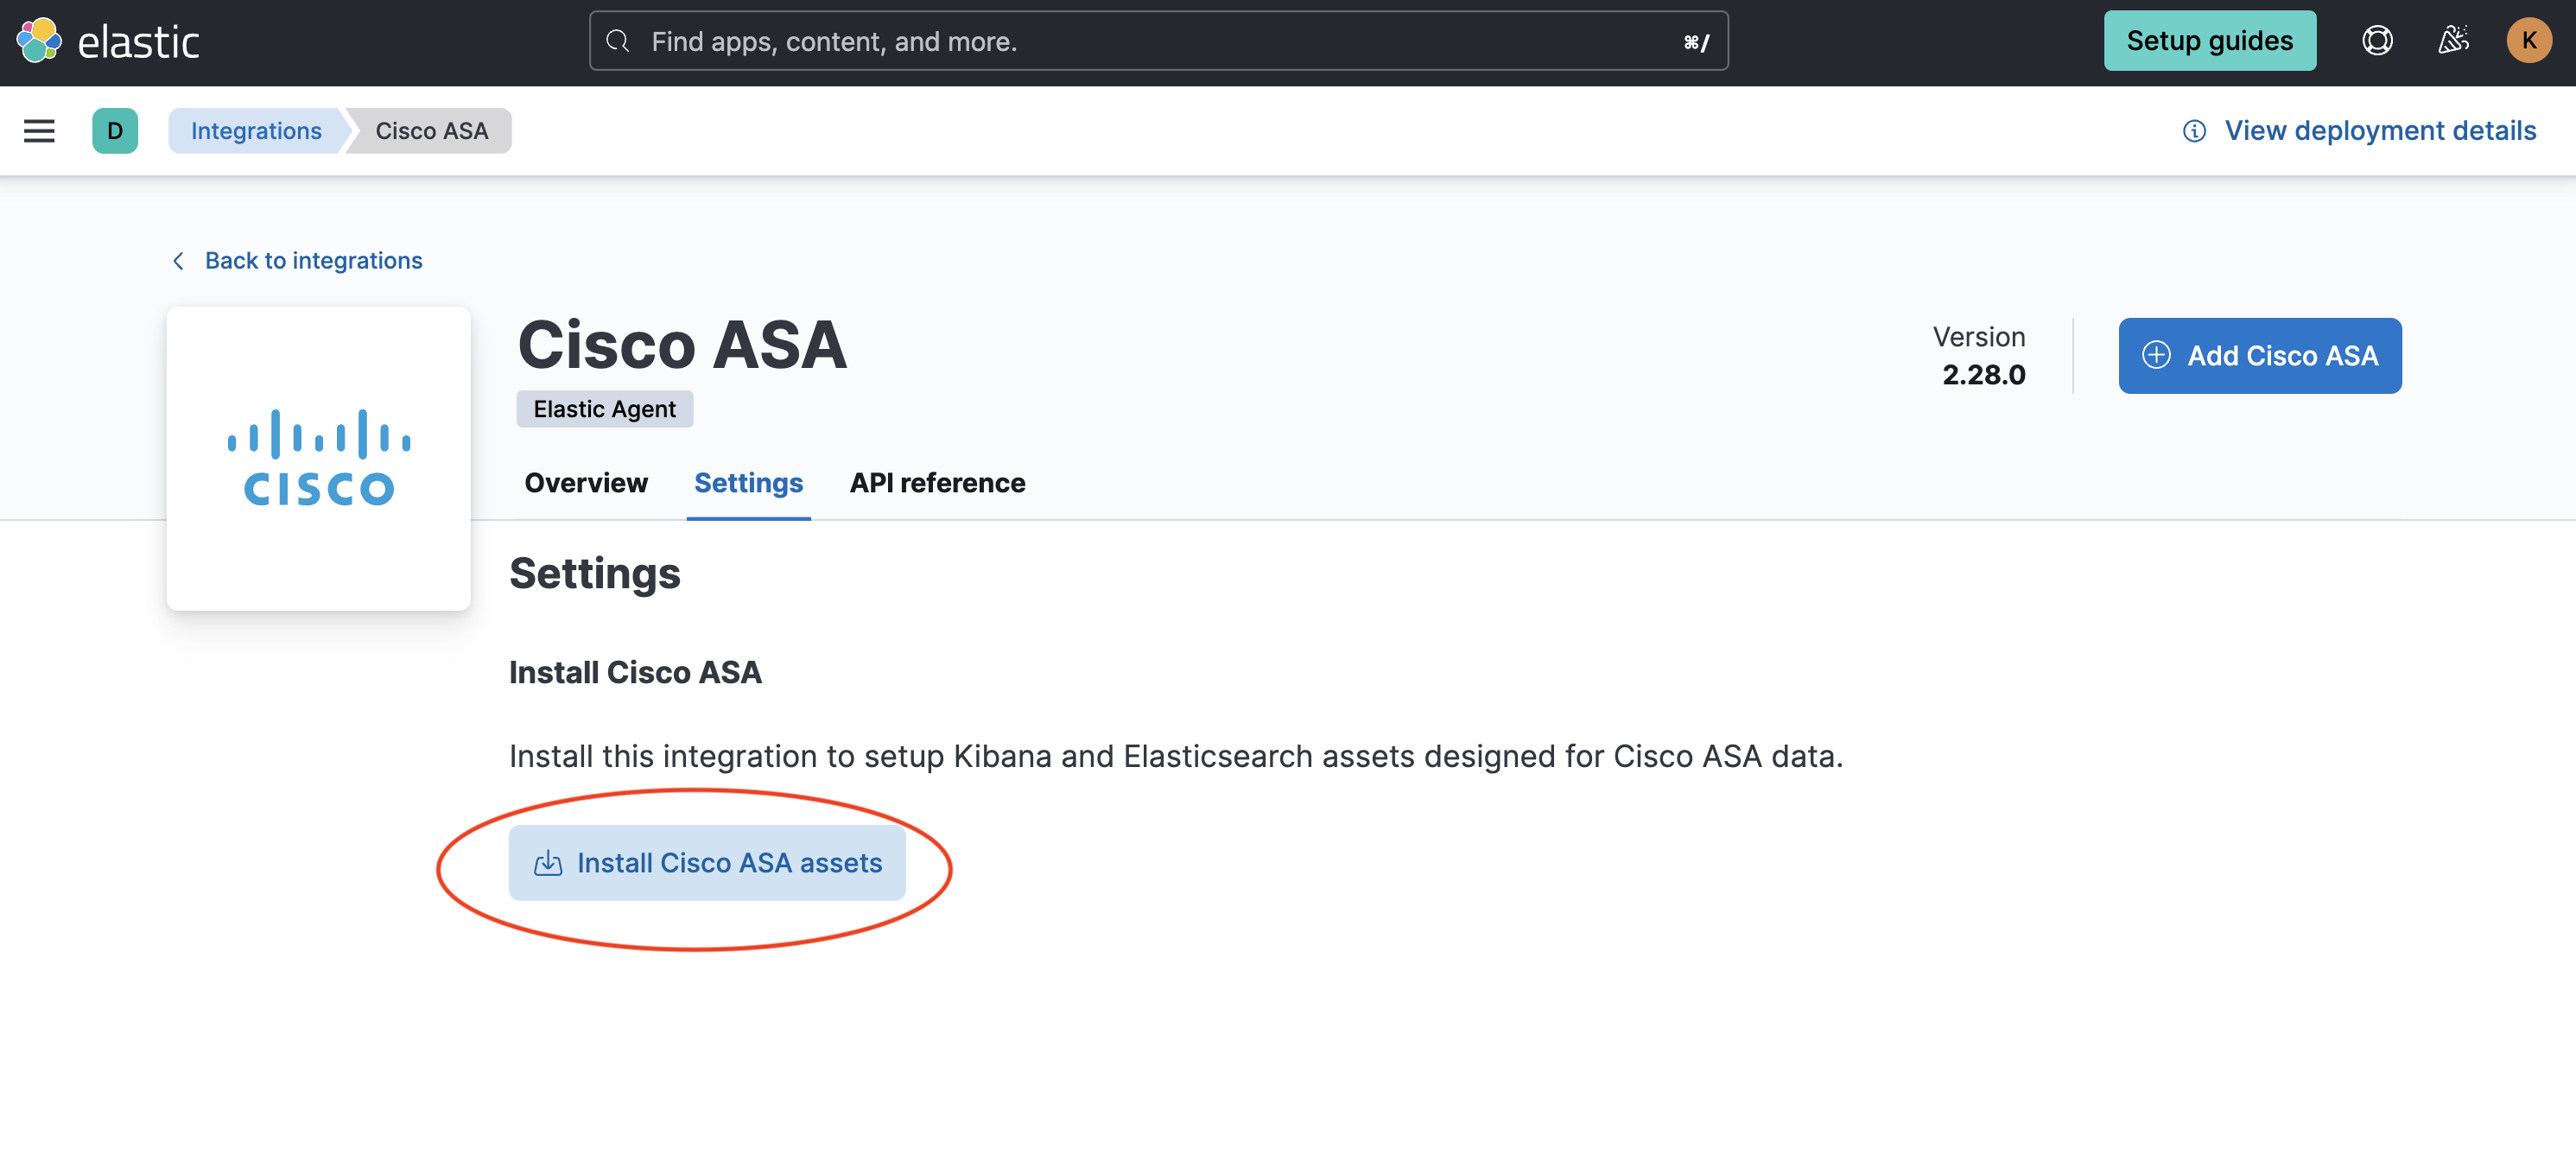
In order for the forwarded event to be properly handled, the target integration's assets (data stream, ingest pipeline, index template, etc.) need to be installed. In Kibana, navigate to Management > Integrations in the sidebar.
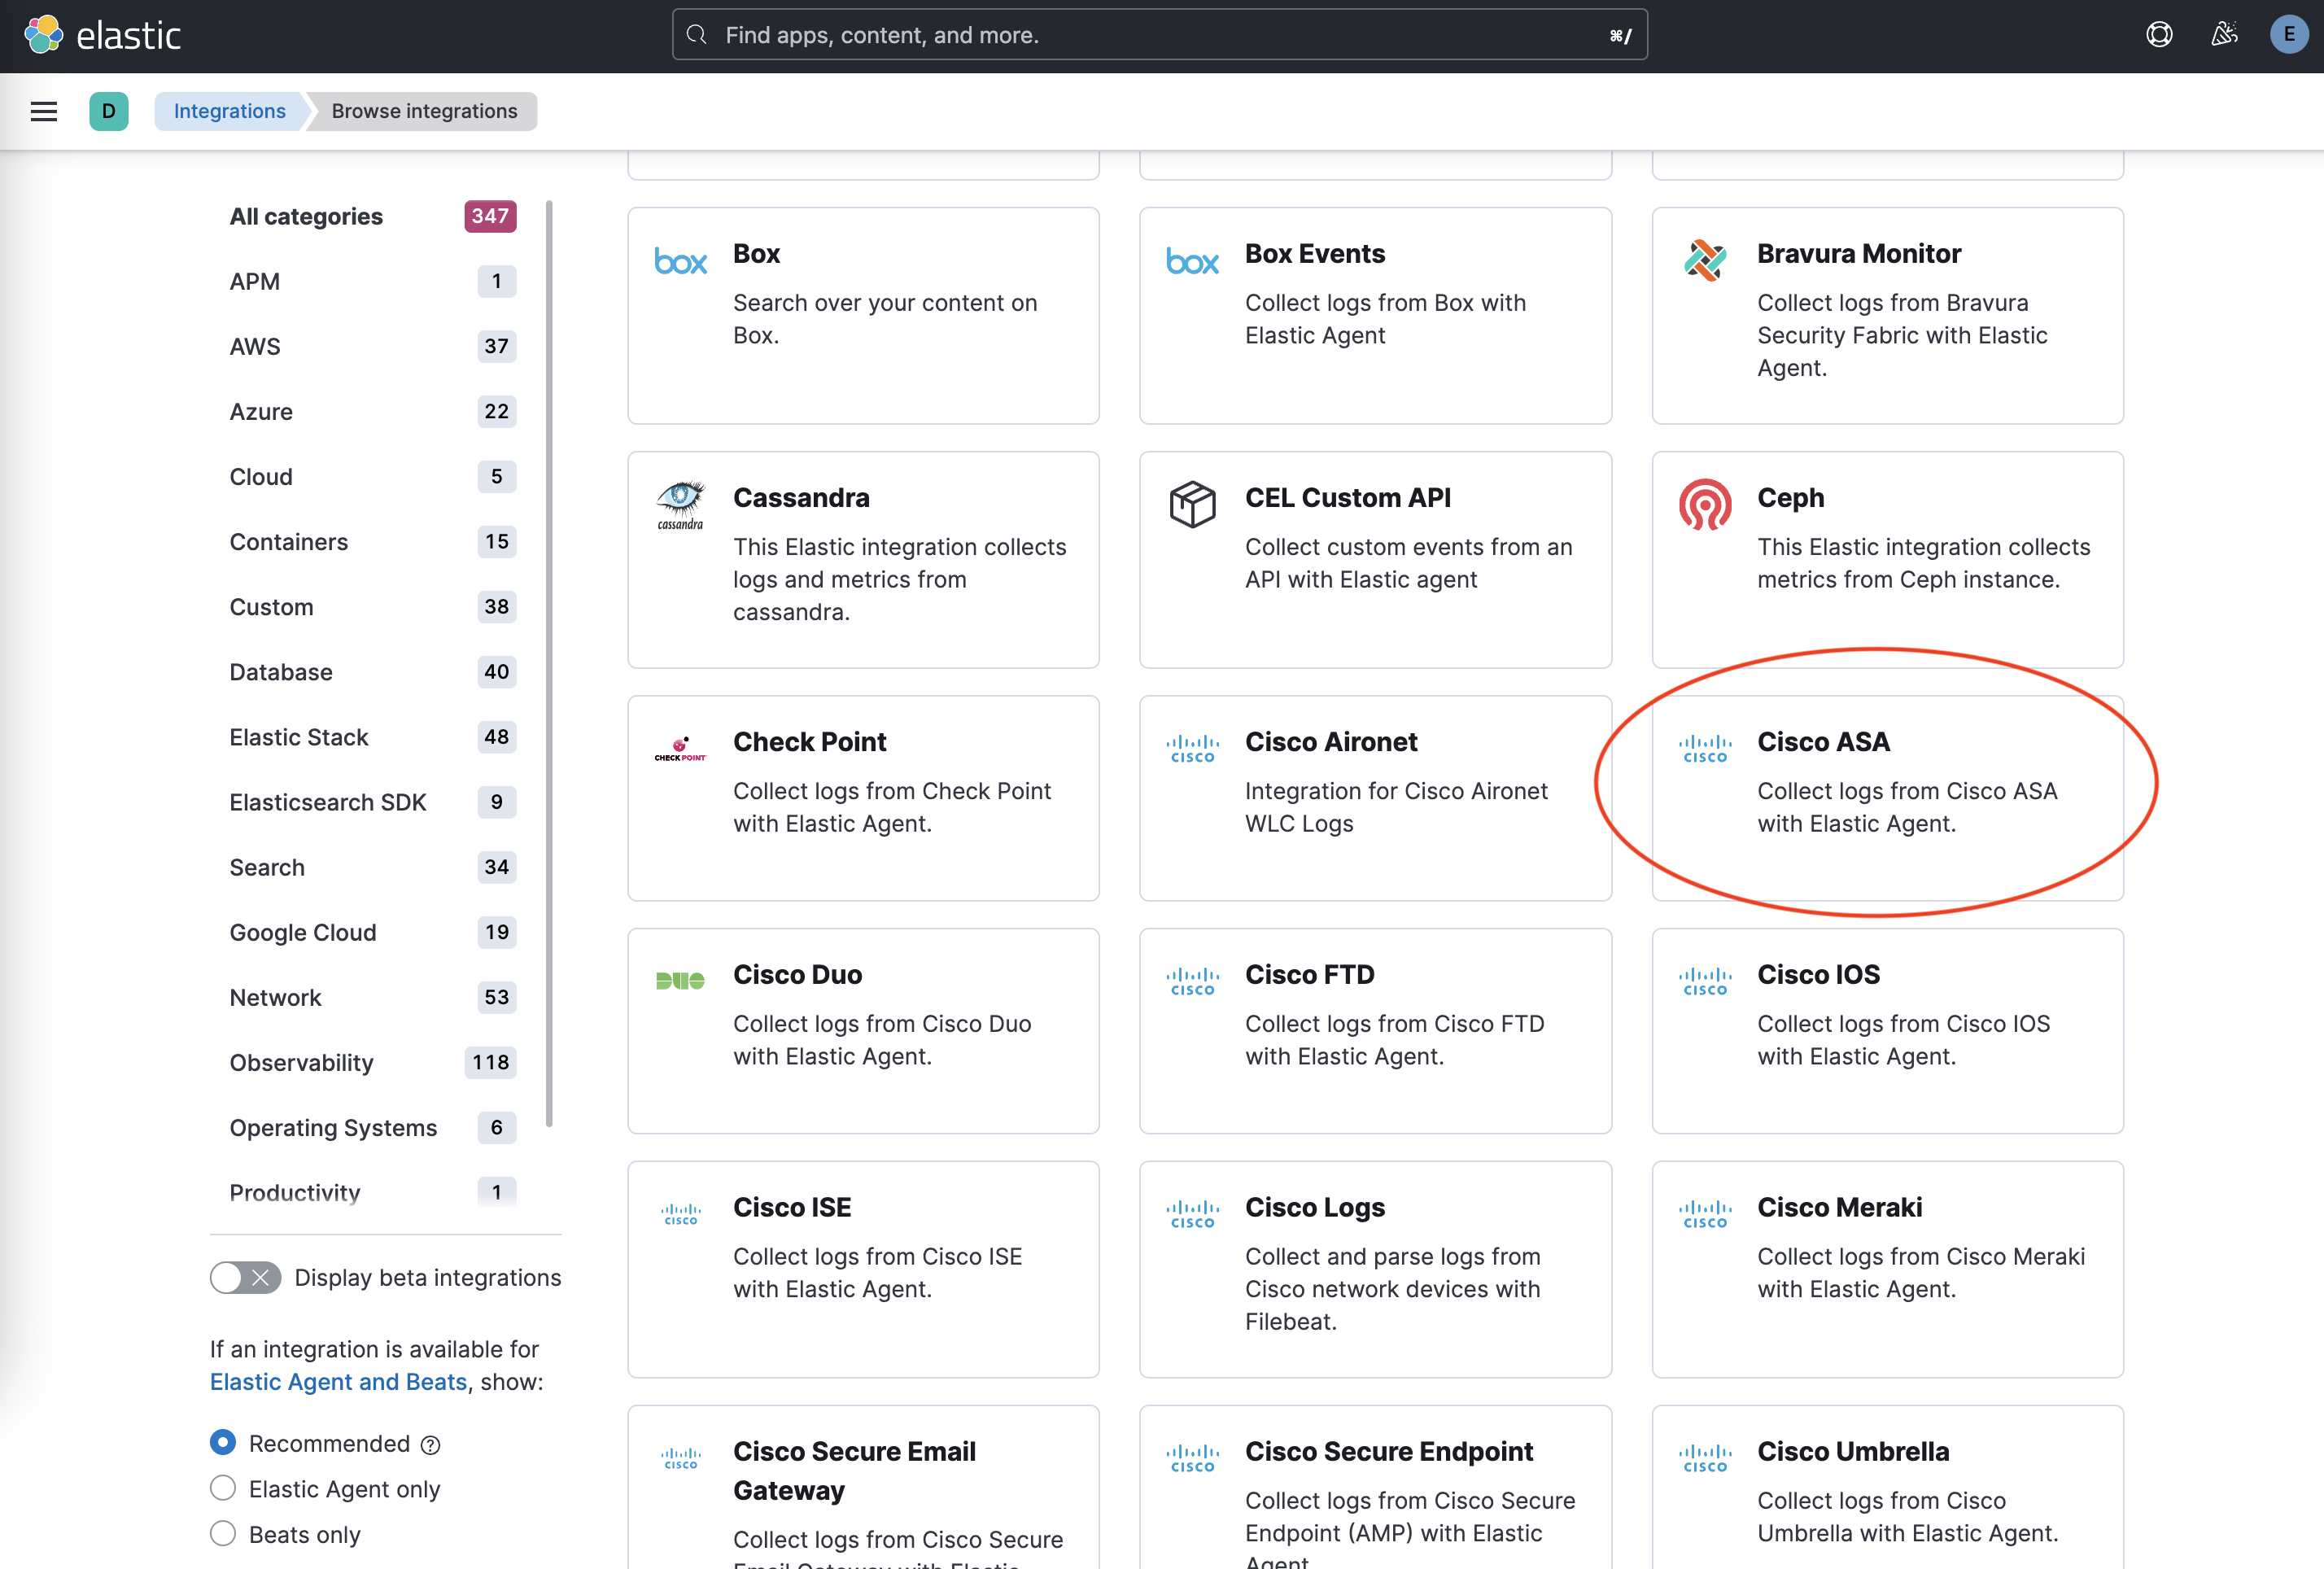
Find the relevant integration(s) by searching or browsing the catalog. For example, the Cisco ASA integration.

- Navigate to the Settings tab and click Install Cisco ASA assets. Confirm by clicking Install Cisco ASA in the popup.

The integration comes preconfigured with a number of pattern definitions. The pattern definitions are used in the order given. Care must be taken to ensure the patterns are executed in the correct order. Regular expressions which are more relaxed and could potentially match against multiple integrations should be run last and stricter patterns should be run first. The next priority should be given to integrations which will see the most traffic.
Pattern definitions may be reordered by moving the entire if/then block up or
down in the list. For example, moving Imperva SecureSphere above Cisco ASA:
Before:
- if:
    and:
      - not.has_fields: _conf.dataset
      - regexp.message: "%ASA-"
  then:
    - add_fields:
        target: ''
        fields:
          _conf.dataset: "cisco_asa.log"
          _conf.tz_offset: "UTC"
          _temp_.internal_zones: ['trust']
          _temp_.external_zones: ['untrust']
- if:
    and:
      - not.has_fields: _conf.dataset
      - regexp.message: "CEF:0\\|Imperva Inc.\\|SecureSphere"
  then:
    - add_fields:
        target: ''
        fields:
          _conf.dataset: "imperva.securesphere"
    - decode_cef:
        field: message
After:
- if:
    and:
      - not.has_fields: _conf.dataset
      - regexp.message: "CEF:0\\|Imperva Inc.\\|SecureSphere"
  then:
    - add_fields:
        target: ''
        fields:
          _conf.dataset: "imperva.securesphere"
    - decode_cef:
        field: message
- if:
    and:
      - not.has_fields: _conf.dataset
      - regexp.message: "%ASA-"
  then:
    - add_fields:
        target: ''
        fields:
          _conf.dataset: "cisco_asa.log"
          _conf.tz_offset: "UTC"
          _temp_.internal_zones: ['trust']
          _temp_.external_zones: ['untrust']
Individual pattern definitions may be disabled by removing the definition
entirely or by inserting comment characters (#) in front of the appropriate lines:
# - if:
#     and:
#       - not.has_fields: _conf.dataset
#       - regexp.message: "%ASA-"
#   then:
#     - add_fields:
#         target: ''
#         fields:
#           _conf.dataset: "cisco_asa.log"
#           _conf.tz_offset: "UTC"
#           _temp_.internal_zones: ['trust']
#           _temp_.external_zones: ['untrust']
Example configuration:
- if:
    and:
      - not.has_fields: _conf.dataset
      - regexp.message: "CEF:0\\|Imperva Inc.\\|SecureSphere"
  then:
    - add_fields:
        target: ''
        fields:
          _conf.dataset: "imperva.securesphere"
    - decode_cef:
        field: message
At its core, the Syslog Router integration utilizes the built-in conditionals and processors provided within Beats. While there are certain requirements that need to be maintained, additional conditions and processors may be added, if required.
The top level of each configuration contains an if/else condition. In the
if statement, an and combines two conditions. The first ensures that another
match has not already occurred, while the second condition is a regex, or regular
expression, which performs the actual match. If the regular expression
matches the message field, then the processors in the then statement of the
configuration will run.
If multiple patterns are required, they may be combined with an or condition:
- if:
    and:
      - not.has_fields: _conf.dataset
      - or:
        - regexp.message: <PATTERN_1>
        - regexp.message: <PATTERN_2>
In the then statement, a list of processors can be given. At minimum, an
add_fields processor needs to be added with the following fields:
Required fields:
_conf.dataset: The dataset (integration.data_stream) to forward to. This field is used by the routing rules in the integration to route documents to the correct pipeline.
Additional processors, such as decode_cef or syslog, may be provided if
additional processing is required.
Out of the box, the Syslog Router integration supports matching events from a number of integrations. Assets from these integrations must still be installed for events to be properly indexed (see Setup above).
DISCLAIMER: Due to subtle differences in how devices can emit syslog events, the patterns provided by default with the Syslog Router integration may not work in all cases. Some integrations may not be listed here, even though they support syslog events. In these cases, patterns would either be too complex or could overlap with patterns from other integrations, resulting in negative impacts on performance or accuracy in matching events to integrations. Custom patterns will need to be created for these cases.
- Arista NG Firewall
- Check Point
- Cisco ASA
- Cisco FTD
- Cisco ISE
- Cisco Secure Email Gateway
- Citrix WAF (CEF format only)
- Fortinet FortiEDR
- Fortinet FortiGate
- Fortinet FortiMail
- Fortinet FortiManager
- Fortinet FortiProxy
- Imperva SecureSphere (CEF format only)
- Iptables
- Juniper SRX
- Palo Alto Next-Gen Firewall
- QNAP NAS
- Snort
- Sonicwall Firewall
- Sophos XG
- Stormshield
Changelog
| Version | Details | Minimum Kibana version |
|---|---|---|
| 0.4.0 | Enhancement (View pull request) Preserve event.original on pipeline error. |
9.0.0 8.14.3 |
| 0.3.1 | Enhancement (View pull request) Generate processor tags and normalize error handler. |
9.0.0 8.14.3 |
| 0.3.0 | Enhancement (View pull request) Add support for Cisco IOS. Matches on the Cisco emblem header. |
9.0.0 8.14.3 |
| 0.2.1 | Enhancement (View pull request) Changed owners. |
9.0.0 8.14.3 |
| 0.2.0 | Enhancement (View pull request) Support stack version 9.0. |
9.0.0 8.14.3 |
| 0.1.2 | Bug fix (View pull request) Updated SSL description to be uniform and to include links to documentation. |
8.14.3 |
| 0.1.1 | Enhancement (View pull request) Ensure filestream fingerprint is disabled in system test. |
8.14.3 |
| 0.1.0 | Enhancement (View pull request) Initial draft of the package |
8.14.3 |