blacklens.io
| Version | 0.5.0
|
| Subscription level What's this? |
Basic |
| Developed by What's this? |
Community |
| Ingestion method(s) | API |
| Minimum Kibana version(s) | 9.1.4 9.0.7 8.19.4 |
To use beta integrations, go to the Integrations page in Kibana, scroll down, and toggle on the Display beta integrations option.
The blacklens.io integration allows you to monitor alerts. blacklens.io is a comprehensive Attack Surface Management platform that helps businesses understand and secure their external attack surface. By combining automated security analysis, continuous monitoring, and penetration testing, it identifies and addresses vulnerabilities early. With features like Darknet Monitoring, Vulnerability Scanning, and XDR Response, blacklens.io provides a proactive defense strategy to protect companies from cyber threats while offering a clear view of their security posture at all times.
Use the blacklens.io integration to fetch all related alerts about your Attack Surface. Then visualize that data in Kibana and create further alerts or enrich the data with other security solutions.
The blacklens.io integration collects one type of data streams: logs
Alerts returns a list of blacklens.io alerts (The API Docs are referenced within the portal)
You need Elasticsearch for storing and searching your data and Kibana for visualizing and managing it.
You can use our hosted Elasticsearch Service on Elastic Cloud, which is recommended, or self-manage the Elastic Stack on your own hardware.
You will require the alerts:read permission in order to fetch the Alerts via the API.
You need an active blacklens.io subscription and a user with the alerts:read permission to retrieve alerts via the API.
- Login to your blacklens.io Portal (This URL will be used for the Instance URL: 'https://portal-(ID).blacklens.io')
- Go to Profile → Generate API Key and copy it.
- Go to Settings → Company.
- Copy ws_id and tenant_id.
- In Kibana go to Management > Integrations.
- In "Search for integrations" search bar, type blacklens.io.
- Click on the "blacklens.io" integration from the search results.
- Click on the "Add blacklens.io" button to add the integration.
- Configure all required integration parameters.
- Alert data requires following parameters:
URLTenant ID (tenant_id)Workspace ID (ws_id)API Key
- Alert data requires following parameters:
- Save the integration.
For detailed setup instructions, please refer to the blacklens.io Knowledge Base (The link is referenced within the portal).
This is the alerts dataset
Example
{
    "@timestamp": "2024-11-12T09:39:58.489Z",
    "agent": {
        "ephemeral_id": "6f67dab1-a41b-450f-a155-a71e23a90def",
        "id": "078a56bf-68d7-4243-a5de-83dfb7e00e88",
        "name": "elastic-agent-18047",
        "type": "filebeat",
        "version": "8.19.4"
    },
    "blacklens": {
        "alert": {
            "id": 1001,
            "outcome": "affected",
            "severity": "medium",
            "status": "resolved",
            "title": "New Open Port",
            "type": "Port Scanner",
            "type_id": 100,
            "updated_date": "2024-11-12T09:39:58.489Z"
        }
    },
    "data_stream": {
        "dataset": "blacklens.alerts",
        "namespace": "38546",
        "type": "logs"
    },
    "ecs": {
        "version": "8.11.0"
    },
    "elastic_agent": {
        "id": "078a56bf-68d7-4243-a5de-83dfb7e00e88",
        "snapshot": false,
        "version": "8.19.4"
    },
    "event": {
        "agent_id_status": "verified",
        "category": [
            "threat"
        ],
        "created": "2026-01-19T05:27:59.414Z",
        "dataset": "blacklens.alerts",
        "id": "1001",
        "ingested": "2026-01-19T05:28:02Z",
        "type": [
            "indicator"
        ]
    },
    "input": {
        "type": "httpjson"
    },
    "tags": [
        "forwarded",
        "blacklens-alert"
    ]
}
Exported fields
| Field | Description | Type |
|---|---|---|
| @timestamp | Event timestamp. | date |
| blacklens.alert.details | Alert Details | nested |
| blacklens.alert.id | Unique Alert ID | integer |
| blacklens.alert.outcome | Determines whether the current alert triggers further events | keyword |
| blacklens.alert.severity | Alert Severity | keyword |
| blacklens.alert.status | Current Status of the Alert | keyword |
| blacklens.alert.title | Title/Description of the given Alert | keyword |
| blacklens.alert.type | Alert Type (Engine) | keyword |
| blacklens.alert.type_id | Alert Type ID (Engine) | integer |
| blacklens.alert.updated_date | Activity last updated time (UTC). | date |
| data_stream.dataset | Data stream dataset. | constant_keyword |
| data_stream.namespace | Data stream namespace. | constant_keyword |
| data_stream.type | Data stream type. | constant_keyword |
| event.dataset | Event dataset. | constant_keyword |
| event.kind | constant_keyword | |
| event.module | Event module. | constant_keyword |
| input.type | Type of filebeat input. | keyword |
| observer.product | constant_keyword | |
| observer.vendor | constant_keyword |
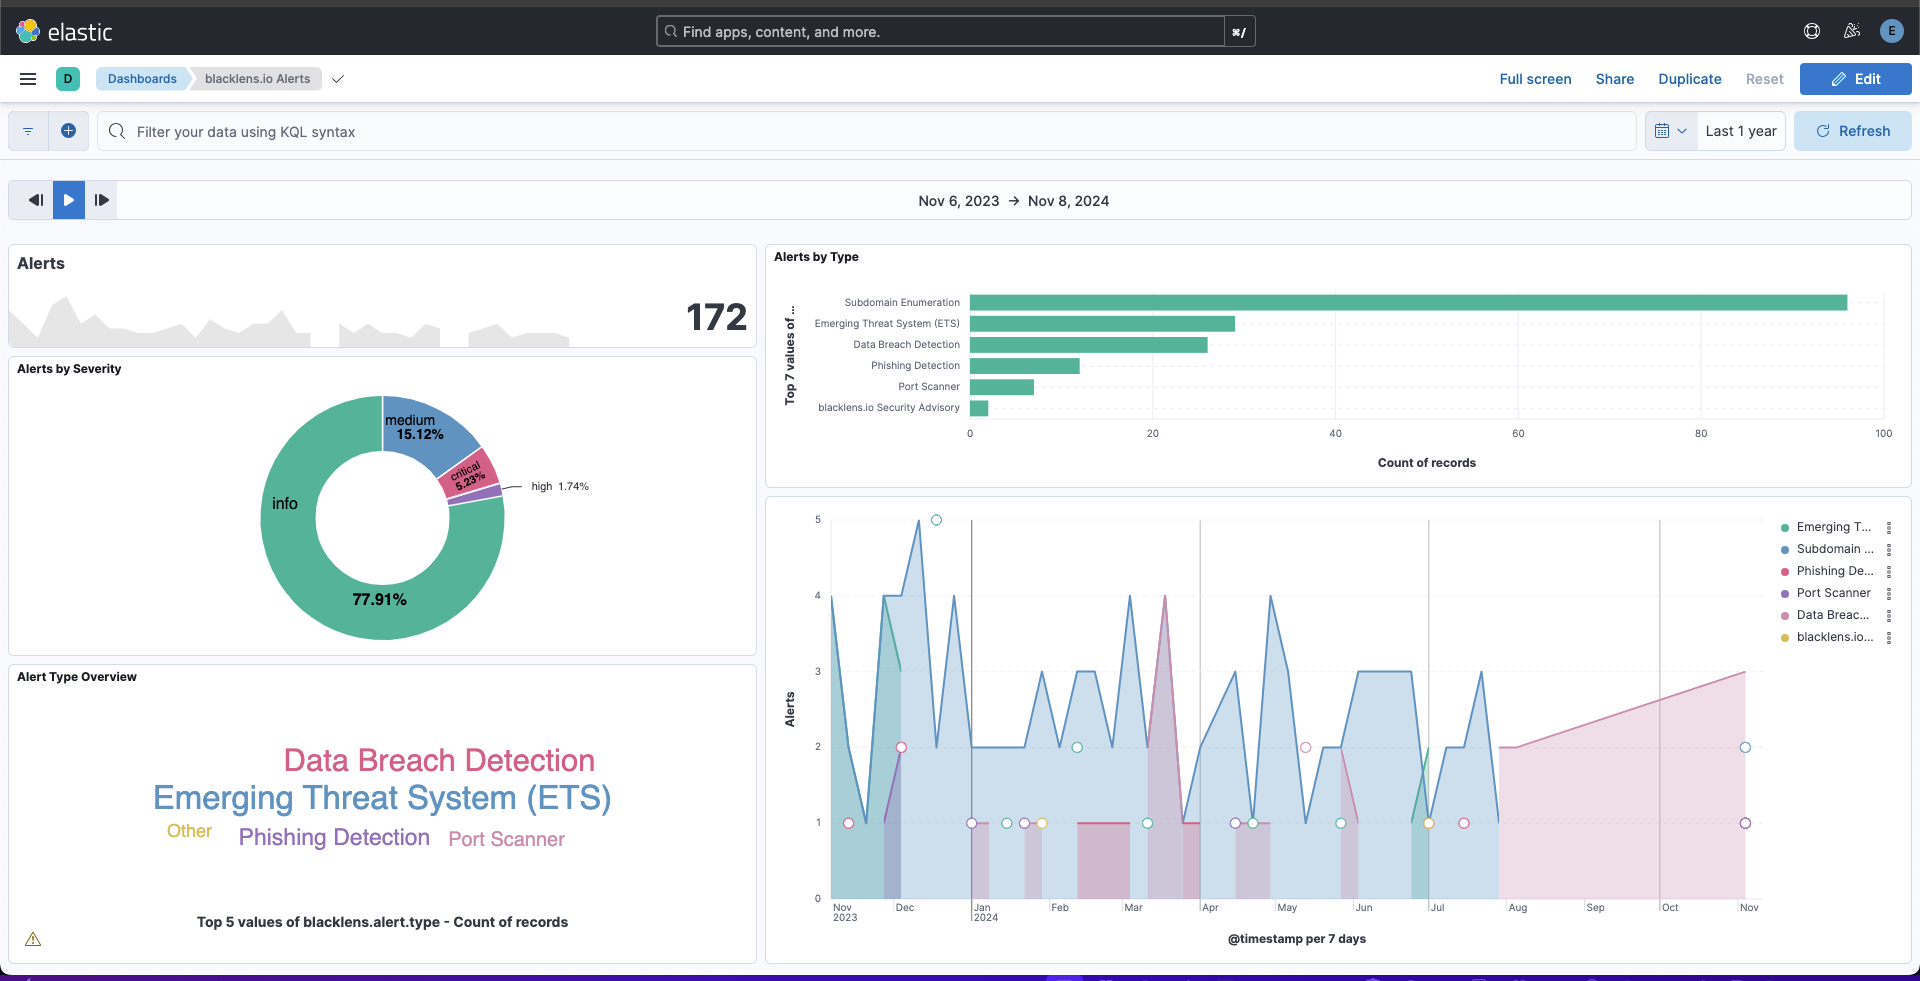
This integration includes one or more Kibana dashboards that visualizes the data collected by the integration. The screenshots below illustrate how the ingested data is displayed.
Changelog
| Version | Details | Minimum Kibana version |
|---|---|---|
| 0.5.0 | Enhancement (View pull request) Prevent updating fleet health status to degraded when pagination completes. |
9.1.4 9.0.7 8.19.4 |
| 0.4.1 | Bug fix (View pull request) Fix default request trace enabled behavior. |
9.0.0 8.15.2 |
| 0.4.0 | Enhancement (View pull request) Enable request trace log removal. |
9.0.0 8.15.2 |
| 0.3.0 | Enhancement (View pull request) Update Kibana constraint to support 9.0.0. |
9.0.0 8.15.2 |
| 0.2.1 | Bug fix (View pull request) Updated SSL description in package manifest.yml to be uniform and to include links to documentation. |
8.15.2 |
| 0.2.0 | Enhancement (View pull request) Add "preserve_original_event" tag to documents with event.kind set to "pipeline_error". |
8.15.2 |
| 0.1.0 | Enhancement (View pull request) Initial draft of the package |
8.15.2 |
