Filter and aggregate logs
Filter and aggregate your log data to find specific information, gain insight, and monitor your systems more efficiently. You can filter and aggregate based on structured fields like timestamps, log levels, and IP addresses that you’ve extracted from your log data.
This guide shows you how to:
- Filter logs: Narrow down your log data by applying specific criteria.
- Aggregate logs: Analyze and summarize data to find patterns and gain insight.
For Observability serverless projects, the Admin role or higher is required to create ingest pipelines and set the index template. To learn more, refer to Assign user roles and privileges.
The examples on this page use the following ingest pipeline and index template. The pipeline and template need to be set before you create your data stream in the following steps. Set them in Developer Tools, which you can find by searching for Developer Tools in the global search field.
If you haven't used ingest pipelines and index templates to parse your log data and extract structured fields yet, start with the Parse and organize logs documentation.
Set the ingest pipeline with the following command:
				PUT _ingest/pipeline/logs-example-default
					{
  "description": "Extracts the timestamp log level and host ip",
  "processors": [
    {
      "dissect": {
        "field": "message",
        "pattern": "%{@timestamp} %{log.level} %{host.ip} %{message}"
      }
    }
  ]
}
Set the index template with the following command:
				PUT _index_template/logs-example-default-template
					{
  "index_patterns": [ "logs-example-*" ],
  "data_stream": { },
  "priority": 500,
  "template": {
    "settings": {
      "index.default_pipeline":"logs-example-default"
    }
  },
  "composed_of": [
    "logs-mappings",
    "logs-settings",
    "logs@custom",
    "ecs@dynamic_templates"
  ],
  "ignore_missing_component_templates": ["logs@custom"]
}
Filter your data using the fields you’ve extracted so you can focus on log data with specific log levels, timestamp ranges, or host IPs. You can filter your log data in different ways:
- Filter logs in Discover: Filter and visualize log data in Discover.
- Filter logs with Query DSL: Filter log data from Developer Tools using Query DSL.
Discover is a tool that provides views of your log data based on data views and index patterns. To open Discover, find Discover in the global search field.
From Discover, open the logs-* or All logs data views from the Data views menu. From here, you can use the Kibana Query Language (KQL) in the search bar to narrow down the log data that’s displayed. For example, you might want to look into an event that occurred within a specific time range.
Add some logs with varying timestamps and log levels to your data stream:
- In your Observability project, go to Developer Tools.
- In the Console tab, run the following command:
				POST logs-example-default/_bulk
					{ "create": {} }
{ "message": "2025-04-15T08:15:20.234Z WARN 192.168.1.101 Disk usage exceeds 90%." }
{ "create": {} }
{ "message": "2025-04-14T10:30:45.789Z ERROR 192.168.1.102 Critical system failure detected." }
{ "create": {} }
{ "message": "2025-04-10T14:20:45.789Z ERROR 192.168.1.105 Database connection lost." }
{ "create": {} }
{ "message": "2025-04-20T09:40:32.345Z INFO 192.168.1.106 User logout initiated." }
For this example, let’s look for logs with a WARN or ERROR log level that occurred on April 14th or 15th. From Discover:
Make sure All logs is selected in the Data views menu.
Add the following KQL query in the search bar to filter for logs with log levels of
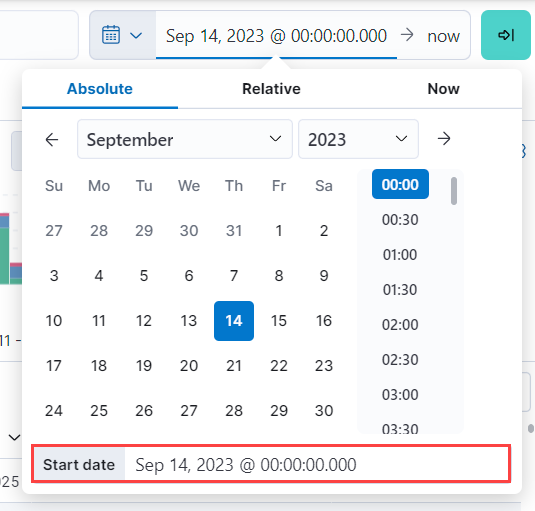
WARNorERROR:log.level: ("ERROR" or "WARN")Click the current time range, select Absolute, and set the Start date to
Apr 14, 2025 @ 00:00:00.000.
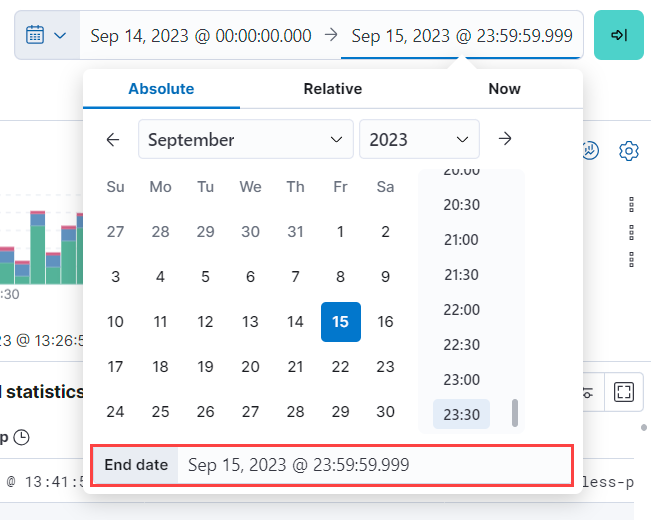
Click the end of the current time range, select Absolute, and set the End date to
Apr 15, 2025 @ 23:59:59.999.
Under the Documents tab, you’ll see the filtered log data matching your query.

For more on using Discover, refer to the Discover documentation.
Query DSL is a JSON-based language that sends requests and retrieves data from indices and data streams. You can filter your log data using Query DSL from Developer Tools.
For example, you might want to troubleshoot an issue that happened on a specific date or at a specific time. To do this, use a boolean query with a range query to filter for the specific timestamp range and a term query to filter for WARN and ERROR log levels.
First, from Developer Tools, add some logs with varying timestamps and log levels to your data stream with the following command:
				POST logs-example-default/_bulk
					{ "create": {} }
{ "message": "2025-04-15T08:15:20.234Z WARN 192.168.1.101 Disk usage exceeds 90%." }
{ "create": {} }
{ "message": "2025-04-14T10:30:45.789Z ERROR 192.168.1.102 Critical system failure detected." }
{ "create": {} }
{ "message": "2025-04-10T14:20:45.789Z ERROR 192.168.1.105 Database connection lost." }
{ "create": {} }
{ "message": "2025-04-20T09:40:32.345Z INFO 192.168.1.106 User logout initiated." }
Let’s say you want to look into an event that occurred between April 14th and 15th. The following boolean query filters for logs with timestamps during those days that also have a log level of ERROR or WARN.
				POST /logs-example-default/_search
					{
  "query": {
    "bool": {
      "filter": [
        {
          "range": {
            "@timestamp": {
              "gte": "2025-04-14T00:00:00",
              "lte": "2025-04-15T23:59:59"
            }
          }
        },
        {
          "terms": {
            "log.level": ["WARN", "ERROR"]
          }
        }
      ]
    }
  }
}
The filtered results should show WARN and ERROR logs that occurred within the timestamp range:
{
  ...
  "hits": {
    ...
    "hits": [
      {
        "_index": ".ds-logs-example-default-2025.04.25-000001",
        "_id": "JkwPzooBTddK4OtTQToP",
        "_score": 0,
        "_source": {
          "message": "192.168.1.101 Disk usage exceeds 90%.",
          "log": {
            "level": "WARN"
          },
          "@timestamp": "2025-04-15T08:15:20.234Z"
        }
      },
      {
        "_index": ".ds-logs-example-default-2025.04.25-000001",
        "_id": "A5YSzooBMYFrNGNwH75O",
        "_score": 0,
        "_source": {
          "message": "192.168.1.102 Critical system failure detected.",
          "log": {
            "level": "ERROR"
          },
          "@timestamp": "2025-04-14T10:30:45.789Z"
        }
      }
    ]
  }
}
Use aggregation to analyze and summarize your log data to find patterns and gain insight. Bucket aggregations organize log data into meaningful groups making it easier to identify patterns, trends, and anomalies within your logs.
For example, you might want to understand error distribution by analyzing the count of logs per log level.
First, from Developer Tools, add some logs with varying log levels to your data stream using the following command:
				POST logs-example-default/_bulk
					{ "create": {} }
{ "message": "2025-04-15T08:15:20.234Z WARN 192.168.1.101 Disk usage exceeds 90%." }
{ "create": {} }
{ "message": "2025-04-14T10:30:45.789Z ERROR 192.168.1.102 Critical system failure detected." }
{ "create": {} }
{ "message": "2025-04-15T12:45:55.123Z INFO 192.168.1.103 Application successfully started." }
{ "create": {} }
{ "message": "2025-04-14T15:20:10.789Z WARN 192.168.1.104 Network latency exceeding threshold." }
{ "create": {} }
{ "message": "2025-04-10T14:20:45.789Z ERROR 192.168.1.105 Database connection lost." }
{ "create": {} }
{ "message": "2025-04-20T09:40:32.345Z INFO 192.168.1.106 User logout initiated." }
{ "create": {} }
{ "message": "2025-04-21T15:20:55.678Z DEBUG 192.168.1.102 Database connection established." }
Next, run this command to aggregate your log data using the log.level field:
				POST logs-example-default/_search?size=0&filter_path=aggregations
					{
"size": 0,
"aggs": {
    "log_level_distribution": {
      "terms": {
        "field": "log.level"
      }
    }
  }
}
- Searches with an aggregation return both the query results and the aggregation, so you would see the logs matching the data and the aggregation. Setting
sizeto0limits the results to aggregations.
The results should show the number of logs in each log level:
{
  "aggregations": {
    "error_distribution": {
      "doc_count_error_upper_bound": 0,
      "sum_other_doc_count": 0,
      "buckets": [
        {
          "key": "ERROR",
          "doc_count": 2
        },
        {
          "key": "INFO",
          "doc_count": 2
        },
        {
          "key": "WARN",
          "doc_count": 2
        },
        {
          "key": "DEBUG",
          "doc_count": 1
        }
      ]
    }
  }
}
You can also combine aggregations and queries. For example, you might want to limit the scope of the previous aggregation by adding a range query:
				GET /logs-example-default/_search
					{
  "size": 0,
  "query": {
    "range": {
      "@timestamp": {
        "gte": "2025-04-14T00:00:00",
        "lte": "2025-04-15T23:59:59"
      }
    }
  },
  "aggs": {
    "my-agg-name": {
      "terms": {
        "field": "log.level"
      }
    }
  }
}
The results should show an aggregate of logs that occurred within your timestamp range:
{
  ...
  "hits": {
    ...
    "hits": []
  },
  "aggregations": {
    "my-agg-name": {
      "doc_count_error_upper_bound": 0,
      "sum_other_doc_count": 0,
      "buckets": [
        {
          "key": "WARN",
          "doc_count": 2
        },
        {
          "key": "ERROR",
          "doc_count": 1
        },
        {
          "key": "INFO",
          "doc_count": 1
        }
      ]
    }
  }
}
For more on aggregation types and available aggregations, refer to the Aggregations documentation.